- Forex, Gold, BTC Market Analysis | Trading Signals
- Sive Morten- Currencies, Gold, Bitcoin Daily Video
You are using an out of date browser. It may not display this or other websites correctly.
You should upgrade or use an alternative browser.
You should upgrade or use an alternative browser.
FOREX PRO WEEKLY August 24-28, 2015
- Thread starter Sive Morten
- Start date
Sive Morten
Special Consultant to the FPA
- Messages
- 18,635
Fantastic Analysis as usual Commander in pips,
Pls Commander kindly comment on GBP/USD on weekly chart there is consecutive bullish stop grabber with target @ 1.5929, Potential big & Small AB-CD forming. On daily there is butterfly sell with target @1.6290 this occur in one of the weekly AB-CD region. And I tried to redraw the wedge you talked about in the past GBP analysis since I thought it worthy of monitoring and is still acceptable as wedge. Please Commander what is your view.
Thanks as usual for your prompt response.
Hi Ochills,
yes, I also like situation on GBP and think that it is bullish and with growing inflation, UK has best chances for reasonable rate hike in nearest future. As I've said, in long term perspective, GBP could become real alternative, or at least add-on to CHF as safe-haven currency in EU, due difficult geopolitcal situation inside EU.
But...
This is not a grabber
") This is just trend shifting, because on previous candle market has not changed the trend to bullish.
This is just trend shifting, because on previous candle market has not changed the trend to bullish.Concerning other analysis - it is mostly the same, so you can find our recent research on GBP and check it...
Last edited:
Sive Morten
Special Consultant to the FPA
- Messages
- 18,635
Sive, back on August 12 you said that all the commodity currencies (CAD, AUD, NZ) were preparing to retrace upward on the high time frame charts and that retracement could last for weeks. You mentioned that major support for Aussie is at 7182 (approx 7200 area). Today Aussie went as low as 7033, then closed at 7150. Do you feel it is now at that major support level where one could go long? Loonie is also getting close to its major support.
HI Dave,
today I've prepared update on AUD. Yes, it has dropped slightly below monthly support, but this is nothing for this scale. By this drop market just has completed what we were waiting for... So this analysis is still 100% valid...
Sive Morten
Special Consultant to the FPA
- Messages
- 18,635
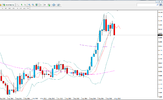
Sive, DXY (USD price index) looks to be headed for a confirmed DRPO Sell on the monthly target. See image attached. 3x3 MA is in red.
Excellent observation , Cosmos!
The second top could be a bit higher of DRPO, but even right now it looks thrilling. This reminds me our 2011 analysis when we've forecasted upside reversal on Dollar and rally that we have recently. Let's see how it will turn...
Sive Morten
Special Consultant to the FPA
- Messages
- 18,635
Hi Mau,Hej sive. What's your view on eurusd after the big move to 1.3500 ? Do you think we will get and up move to 1.5 before fall again to 1.28 ? Kind regards Mau
Actually I do not see yet any patterns that suggest action to 1.35. Currently our extended target is 1.22, as we've specified in weekly research. I prefer to go step by step. To speak about 1.35 or even 1.50 you need to see something that points on this development and makes this action possible. Currently we do not have anything of that sort.
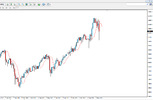
Sive, there might be a problem with the DXY DRPO chart I posted a few days ago. I have just looked at the DXY chart with a different broker and it does not show a close above the 3x3 after the first close below it. (see both charts attached with the red line being the 3x3 MA). It could still be set up for a DRPO but we would need close above with a new high and then another close below. It is the same issue you have brought up many times, that there is no central location o source for charts and price movements. Brokers use different times, and it can skew the patterns we might think we see. I suppose a chart from the futures market might solve this dilemma, but I do not have one - do you?
Attachments
Sive Morten
Special Consultant to the FPA
- Messages
- 18,635
I been so enjoying your updates commander, more power to you.
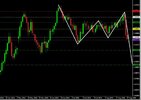
This looks like 222 sell on GBPUSD daily, correct?
Well, its a bit wide, but may be it could be treated as "222'...
Sive Morten
Special Consultant to the FPA
- Messages
- 18,635
Sive, there might be a problem with the DXY DRPO chart I posted a few days ago. I have just looked at the DXY chart with a different broker and it does not show a close above the 3x3 after the first close below it. (see both charts attached with the red line being the 3x3 MA). It could still be set up for a DRPO but we would need close above with a new high and then another close below. It is the same issue you have brought up many times, that there is no central location o source for charts and price movements. Brokers use different times, and it can skew the patterns we might think we see. I suppose a chart from the futures market might solve this dilemma, but I do not have one - do you?
Well, Probably we should look at DXY futures. This will give precise answer.
Similar threads
- Replies
- 7
- Views
- 761
- Replies
- 1
- Views
- 48
- Replies
- 11
- Views
- 294
- Replies
- 14
- Views
- 288
- Forex, Gold, BTC Market Analysis | Trading Signals
- Sive Morten- Currencies, Gold, Bitcoin Daily Video