Daily Technical Analysis by FxGrow

FxGrow Daily Technical Analysis – 17th Aug, 2015
By FxGrow Research & Analysis Team

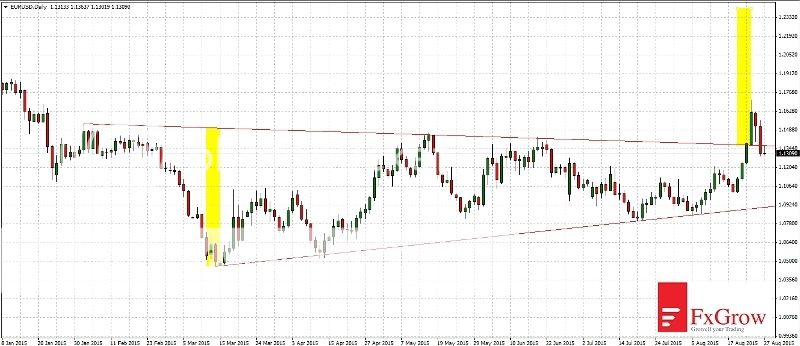
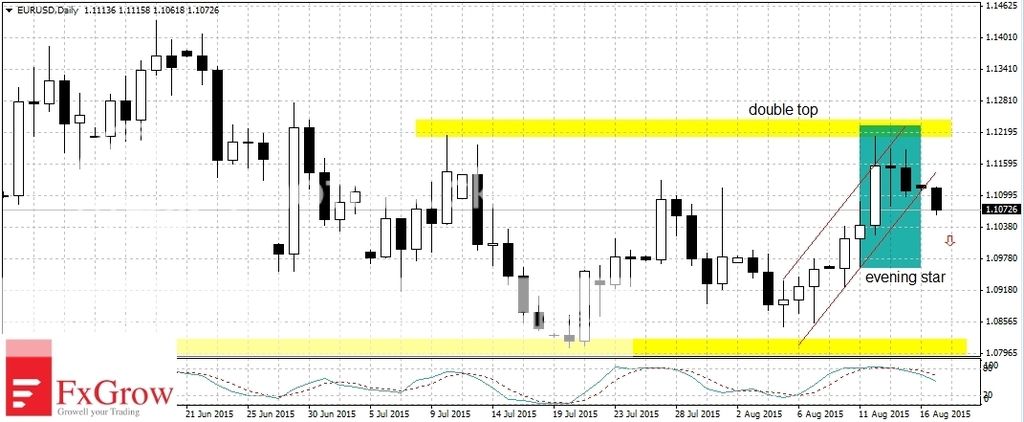
EURUSD (D1) Will the price fall after two bearish formations?

Double Top at 1.121 EURUSD and broken growth channel. The second formation is Evening Star (blue color on chart). Target Falls: 1.082

Alternative Scenario: Moving back inside bullish channel.

2015-08-17_analiza_EURUSD_ang_D1_zps6rugxko5.jpg


For more in depth Research & Analysis please visit FxGrow.

Note: This analysis is intended to provide general information and does not constitute the provision of INVESTMENT ADVICE. Investors should, before acting on this information, consider the appropriateness of this information having regard to their personal objectives, financial situation or needs. We recommend investors obtain investment advice specific to their situation before making any financial investment decision.
 
FxGrow Daily Technical Analysis – 18th Aug, 2015
By FxGrow Research & Analysis Team

USDCAD ends correction and now it's time for a new peak

2015-08-18_analiza_USDCAD_H1_zpszitr9i7r.jpg


USDCAD (US Dollar vs. Canadian Dollar) is at levels which were seen in 2004. Traders are biding higher levels what asures that the current trend will maintain. The rally is also supported by the structure of the current growth which formed since bottom made in 2012 a characteristic pattern described in Elliott Wave Theory as a 'Impulse Wave'.

The nearest resistance levels are 1.3212 (last peak), then 1.33 and 1.35. The last level is a Fibonnacci dependence where wave 1 = wave 5.

2015-08-18_analiza_USDCAD_H4_zpswrwntqsy.jpg


Last week USDCAD breached higher out of the downward channel and now it is moving towards the last peak. On 1-hour time frame the price tested the lower bound of the upward channel what have triggered a demand-side response.

For this currency pair long positions are preferred.


For more in depth Research & Analysis please visit FxGrow.

Note: This analysis is intended to provide general information and does not constitute the provision of INVESTMENT ADVICE. Investors should, before acting on this information, consider the appropriateness of this information having regard to their personal objectives, financial situation or needs. We recommend investors obtain investment advice specific to their situation before making any financial investment decision.
 
FxGrow Daily Technical Analysis – 20th Aug, 2015
By FxGrow Research & Analysis Team

USDCHF - bottom exit from consolidation and breached out support

2015-08-20_analiza_USDCHF_H1_zpsqjrywiyv.jpg


For a week USDCHF was moving in consolidation and created a channel with the width of 75 pips

Yesterday, the bears were able to breach out of the channel bottom and momentum to break the next support. In the chart it is also showed that there has been a re-test of broken support which has now become resistance. At daily interval situation is even more ambigous.

2015-08-20_analiza_USDCHF_D1%201_zps1boe5rif.jpg


Yesterday's candle breach out of the channel bottom with great force and now it is expected that soon it will move in the direction of 0.95000.


For more in depth Research & Analysis please visit FxGrow.

Note: This analysis is intended to provide general information and does not constitute the provision of INVESTMENT ADVICE. Investors should, before acting on this information, consider the appropriateness of this information having regard to their personal objectives, financial situation or needs. We recommend investors obtain investment advice specific to their situation before making any financial investment decision.
 
FxGrow Daily Technical Analysis – 25th Aug, 2015
By FxGrow Research & Analysis Team

Test of the longterm trend line and defense of support on GBPJPY.

GBPJPY is moving in an upward trend since the beginning of 2012. Although for the last 10 weeks GBPJPY did not break the peaks, but the upward trend is not compromised. Last Friday the bears were able to breach out of the channel bottom (interval H4) in which GBPJPY moved for 1.5 weeks. The result was yesterday's downward dynamic movement, which led price below July's support. Bulls, quickly began to buy and on the chart pemained only a long lower shadow.

2015-08-25_analiza_GBPJPY-W1_zps7vup8gr4.jpg


Weekly interval.

The current weekly candle has supported the upward trend line and is the third test of this line of 2012. The resistance that stopped move up at the level 195.00 was created in the years 2005, 2008 and it is the first serious test for the bulls since 2013.

2015-08-25_analiza_GBPJPY-H4_zpst4h1jc5h.jpg


For more in depth Research & Analysis please visit FxGrow.

Note: This analysis is intended to provide general information and does not constitute the provision of INVESTMENT ADVICE. Investors should, before acting on this information, consider the appropriateness of this information having regard to their personal objectives, financial situation or needs. We recommend investors obtain investment advice specific to their situation before making any financial investment decision.
 
FxGrow Daily Technical Analysis – 25th Aug, 2015
By FxGrow Research & Analysis Team

NZDUSD - 400 pips in 15 minutes and a false breakout from consolidation

New Zealand Dollar to US Dollar Rate moves in a downward trend since mid-2014 year. The movement of prices over the past four months took the shape of the downward channel, in which the price has dropped from 0.77 to 0.65.

In early August NZDUSD broke out successfully from the downward channel and created a consolidation. Yesterday it made a dynamic move downward breaking the bottom of a consolidation and then a moment later it returned to the inside. The support that stopped the descent is in the level of 0.6135, and these are the levels at which the NZDUSD has not been since 2009.

2015-08-25_analiza_NZDUSD-H4_zpsm3feeer4.jpg


Interval H4

After returning to the consolidation NZDUSD tries to break next intraday resistance which is the level of 0.6530. If the break will be successful the target of move up will be level 0.6700.

2015-08-25_analiza_NZDUSD-D1_zpsu4thymfo.jpg


For more in depth Research & Analysis please visit FxGrow.

Note: This analysis is intended to provide general information and does not constitute the provision of INVESTMENT ADVICE. Investors should, before acting on this information, consider the appropriateness of this information having regard to their personal objectives, financial situation or needs. We recommend investors obtain investment advice specific to their situation before making any financial investment decision.
 
FxGrow Daily Technical Analysis – 26th Aug, 2015
By FxGrow Research & Analysis Team

GBPUSD - move in the upward channel and attempt to exit from consolidation

From the bottom of 7 August formed the upward channel, in which "Cable" moves. Currently, the lower limit of the channel is located at 1.5667 and right now price moving in that direction. The movement of GBPUSD below 1.5667 level will indicate breakout of upward channel and return to the interior of consolidation. Rebound of this level will begin a new upward

2015-08-26_analiza_GBPUSD-H1_zps1rz2nndm.jpg


Last week I pointed out consolidation, which the GBPUSD broke up on Monday. However, yesterday there was a return movement that could mean a re-test of the consolidation or a false breakout and return to its interior.

2015-08-26_analiza_GBPUSD-H4_zpsggnete8s.jpg


For more in depth Research & Analysis please visit FxGrow.

Note: This analysis is intended to provide general information and does not constitute the provision of INVESTMENT ADVICE. Investors should, before acting on this information, consider the appropriateness of this information having regard to their personal objectives, financial situation or needs. We recommend investors obtain investment advice specific to their situation before making any financial investment decision.
 
Last edited:
FxGrow Daily Technical Analysis – 27th Aug, 2015
By FxGrow Research & Analysis Team

EURUSD broke out of the triangle, range of breaking 1.2400

EURUSD on Monday reached the highs of January 2015. At the same time there has been a breakout of the triangle, which was forming since February of this year. Today's session will be very important because yesterday the EURUSD returned to the interior of the triangle, but descents stopped at its upper limit. If the breakout is successful range of breaking is the level of 1.2400 However if there has been returning move to a triangle it is not excluded that the proper breakout of the triangle It will be down, and then its range of breaking will be around 1.0000

2015-08-27_analiza_EURUSD-D1_zpsyo3insuw.jpg


Interval H4
Descents stopped at the fibo 61,8% last move and it will be a good moment to return to upward movement.

2015-08-27_analiza_EURUSD-H4_zpsdy6wxbmu.jpg


For more in depth Research & Analysis please visit FxGrow.

Note: This analysis is intended to provide general information and does not constitute the provision of INVESTMENT ADVICE. Investors should, before acting on this information, consider the appropriateness of this information having regard to their personal objectives, financial situation or needs. We recommend investors obtain investment advice specific to their situation before making any financial investment decision.
 
FxGrow Daily Technical Analysis – 27th Aug, 2015
By FxGrow Research & Analysis Team

EURJPY - August minimum test

EURJPY moves for a month in a flat consolidation between 135.00 - 139.00. At the moment it is testing a lower limit of this consolidation. Successful break of this support will take a price to 133.30 and its defense will move towards 139.00.

2015-08-27_analiza_EURJPY-D1_zpszxdnfg4x.jpg


Interval H4

On Monday after attempt of breaking top of consolidation price formed double peak formation. EURJPY dynamically move inside downward trend channel. The first sign that this support will stop descent will be break upper limit of this channel.

2015-08-27_analiza_EURJPY-H4_zpsmsaxbvip.jpg


For more in depth Research & Analysis please visit FxGrow.

Note: This analysis is intended to provide general information and does not constitute the provision of INVESTMENT ADVICE. Investors should, before acting on this information, consider the appropriateness of this information having regard to their personal objectives, financial situation or needs. We recommend investors obtain investment advice specific to their situation before making any financial investment decision.
 
FxGrow Daily Technical Analysis – 28th Aug, 2015
By FxGrow Research & Analysis Team

AUDUSD rebound after the fall and movement of the flag formation.

AUDUSD since 2011 is moving in a downward trend, and the last six months there is a movement in the channel. On Monday a strong downward candle AUDUSD has tested the lower limit of the channel. At the lower band bulls appeared which is evident on the chart in the form of a long lower shadow. At the moment the price is in the middle of the channel however this move is more preparation before further falls rather than attempt of a long rebound.

2015-08-28_analiza_AUDUSD-D1_zpsnq1g0nct.jpg


Interval H1

After Monday's fall rebound was quickly, which abolished the 61.8% downward movement. For two days AUDUSD moves in the flag and the maximum level, which should stop the upward movement is 0.7240. The flag is a trend continuation formation so on AUDUSD is recommended for short position.

2015-08-28_analiza_AUDUSD-H1_zpsuz1lk2w9.jpg


For more in depth Research & Analysis please visit FxGrow.

Note: This analysis is intended to provide general information and does not constitute the provision of INVESTMENT ADVICE. Investors should, before acting on this information, consider the appropriateness of this information having regard to their personal objectives, financial situation or needs. We recommend investors obtain investment advice specific to their situation before making any financial investment decision.
 
FxGrow Daily Technical Analysis – 31st Aug, 2015
By FxGrow Research & Analysis Team

USDCAD - resistance stopped the upward movement

USDCAD from 2011 is moving in an upward trend. In this period it has gained almost 50% in value from 0.94 to 1.33. USDCAD is at levels which were seen in 2004. Easily break out of the level 1.3350 should not succeed which May cause move down. Price moves inside upward regression channel, and if falls start they will bring USD/CAD down even to 1.2400. That level is a lower limit of the trend channel.

2015-08-31_analiza_USDCAD-H1_zpsw1qmif5v.jpg


H1 Time-frame

Last week a peak of 1.3350 was reached and increases have been stopped. Further falls are currently stopped by support near 1.3170. Possible breakdown of this level could bring price to 1.3080.

2015-08-31_analiza_USDCAD-D1_zpsrwhwwym6.jpg


For more in depth Research & Analysis please visit FxGrow.

Note: This analysis is intended to provide general information and does not constitute the provision of INVESTMENT ADVICE. Investors should, before acting on this information, consider the appropriateness of this information having regard to their personal objectives, financial situation or needs. We recommend investors obtain investment advice specific to their situation before making any financial investment decision.
 
Back
Top