Technical Analysis by Admiral Markets

Technical Update - AUDUSD, USDCHF and AUDCHF
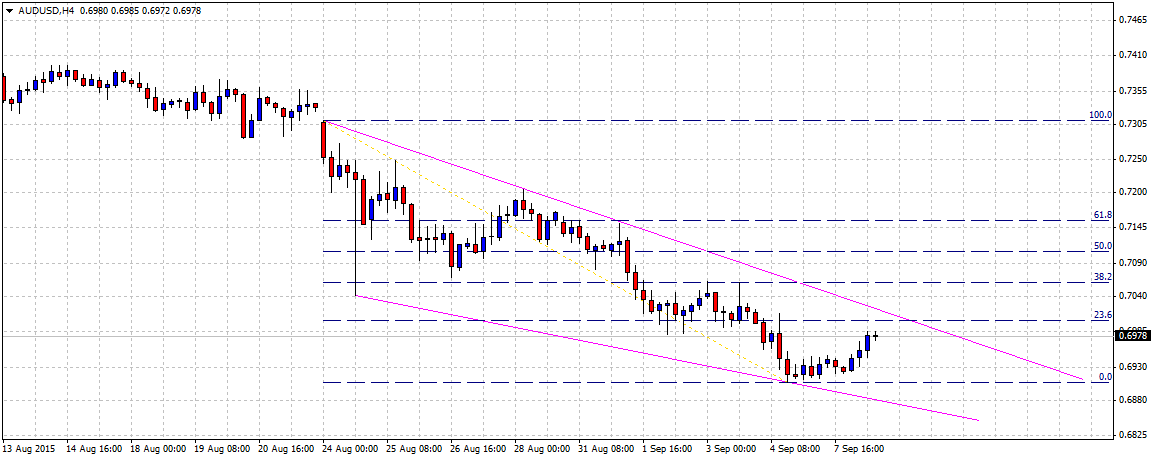
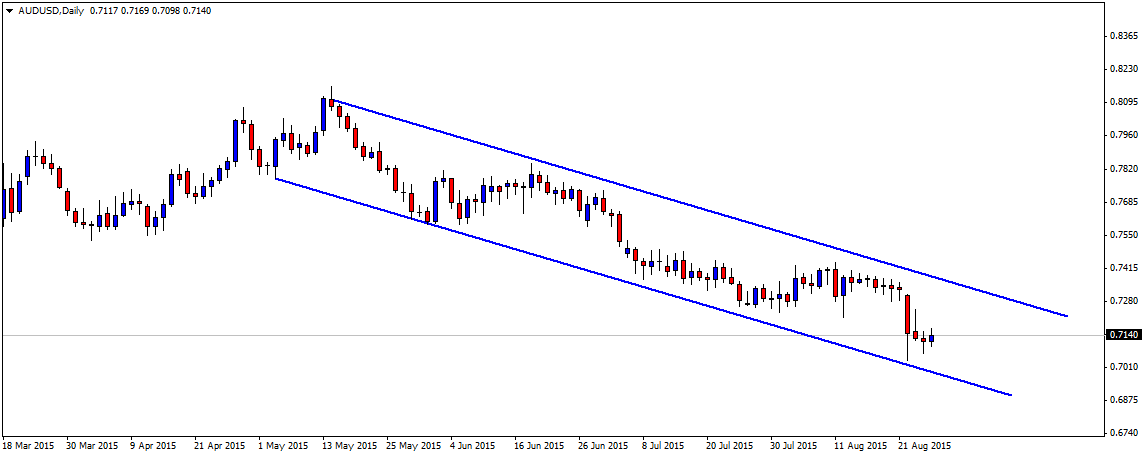
AUDUSD


The pair remains within a well-established down-trend as depicted by formation a descending trend-channel on daily chart. After nearly testing the lower trend-line support of the channel on Monday, the pair recovered a bit and is currently trading near 0.7150 level. Should the pair attempt a further recovery and manage to move above 0.7200-0.7210 round figure mark resistance, it could possibly aim towards testing the upper trend-line resistance of the channel, currently near 0.7350-60 area. Alternatively, failure to extend the bounce-back and a subsequent weakness back below 0.7100 mark is likely to be followed by additional weakness towards retesting the very important 0.7000 psychological mark support, which also coincides with the lower trend-line support of the channel.

USDCHF


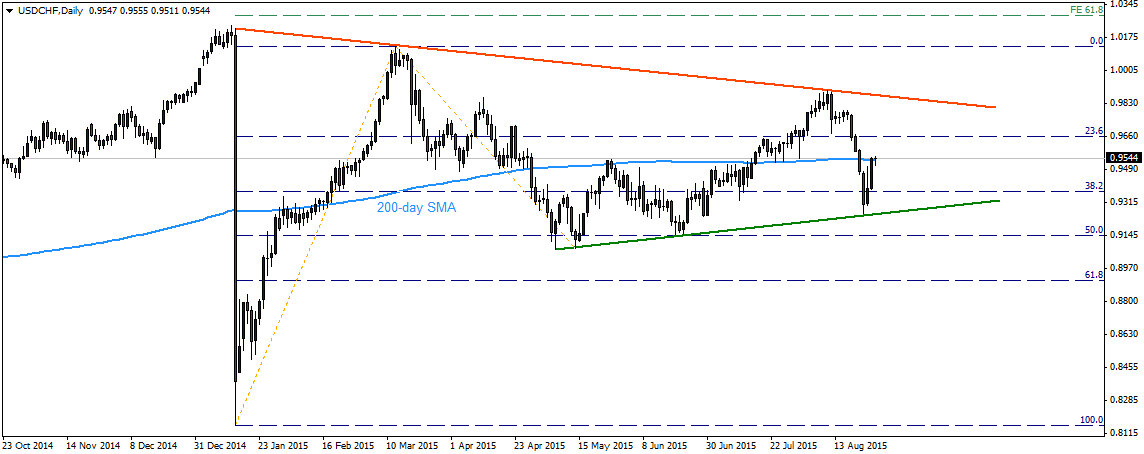
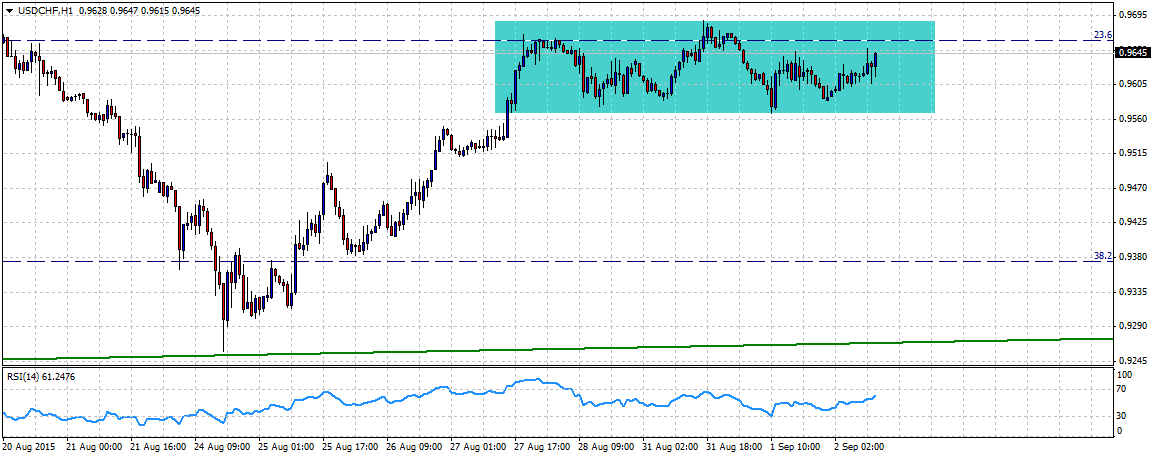
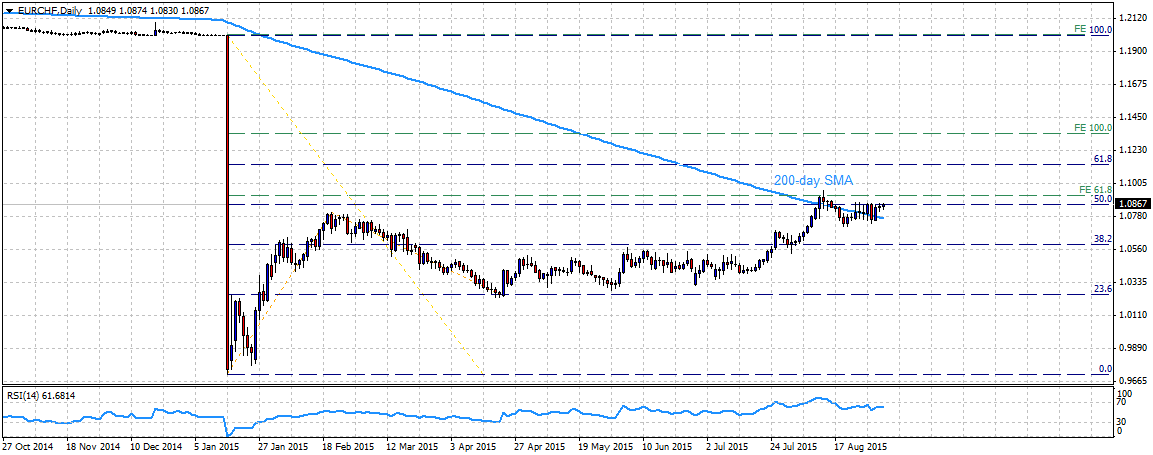
The pair's reversal from a descending trend-line resistance and a subsequent drop below 200-day SMA seems to have found support near 0.9260-50 region marking a short-term ascending trend-line. The pair bounced from the ascending trend-line support and is currently hovering around 200-day SMA, near 0.9550 region. A sustained strength above 200-day SMA seems to set the stage for extension of the bounce back towards 0.9650 resistance area representing 23.6% Fib. retracement level of Jan. 15 lows to March highs upswing. However, major upside resistance still continues to remain at the descending trend-line, currently near 0.9900 mark and a clear strength above might negate any near-term bearish outlook for the pair. Meanwhile, failure to register any remarkable strength above 200-day SMA, leading to weakness back below 0.9500-0.9480 immediate horizontal support, is likely to find support at 38.2% Fib. retracement level near 0.9360-50 area. This is closely followed by the ascending trend-line support, currently near 0.9280-65 area, which if broken now seems to further drag the pair towards 50% Fib. retracement level support near 0.9150 level.
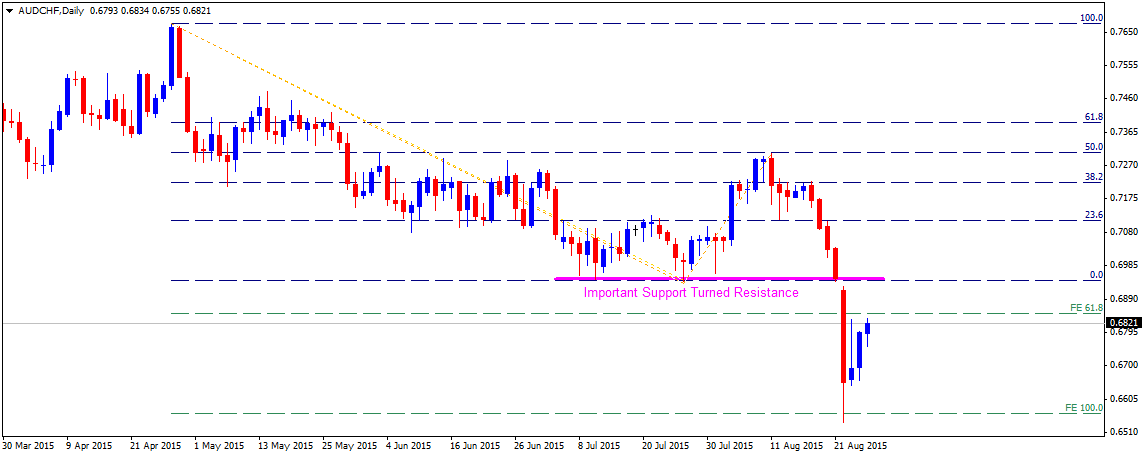
AUDCHF


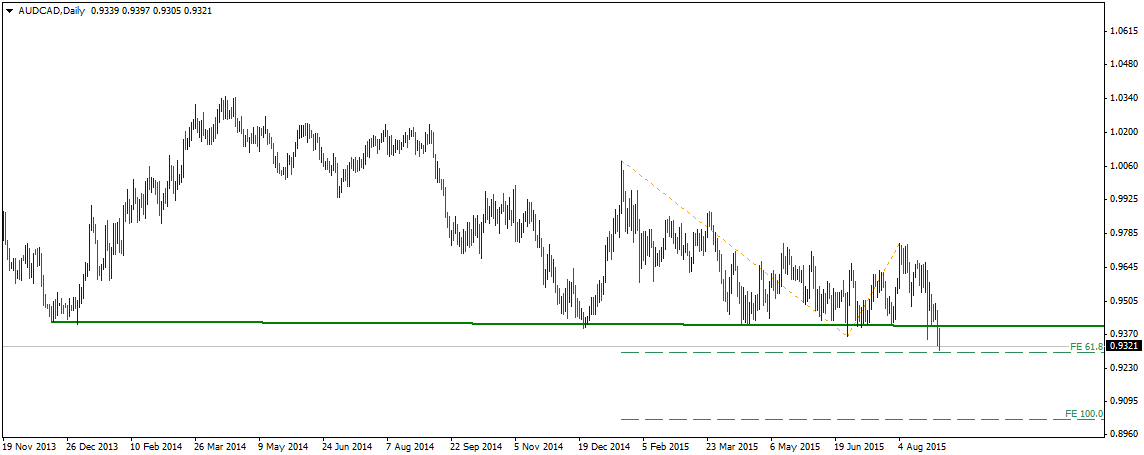
Failure to hold 0.6940 important support triggered a sharp fall, forcing the pair even below 61.8% Fib. expansion level support to test 100% Fib. expansion level support near 0.6550 level. The pair is currently witnessing a bounce-back from near-term oversold conditions but is likely to confront immediate resistance at 61.8% Fib. expansion level near 0.6850 level. A move above 0.6850 resistance is likely to be capped at an important support now turned immediate strong resistance near 0.6940-50 zone. Meanwhile on the downside, 0.6800 round figure mark seems to protect immediate downside. This is followed by another round figure mark support near 0.6700 mark, which if broken seems to drag the pair back towards retesting the very important 100% Fib. expansion level support near 0.6550-40 area.


“Original analysis is provided by Admiral Markets
 
Technical Outlook - NZDUSD, EURNZD, GBPNZD, NZDCHF

NZDUSD


Break of 0.6500 – 0.6490 horizontal support triggered NZDUSD decline towards the lowest level in more than eight years. A pullback following the plunge failed to sustain its trading above 0.6500 area, indicating the pair's re-test of recent lows, near 0.6250 level, breaking which 61.8% FE of its late June to recent decline, near 0.6150-40 can restrict its near-term downside. Given the pair's ability to extend the downward trajectory below 0.6140, it becomes vulnerable to test sub-0.6000 area. Meanwhile, 0.6400 round figure mark, quickly followed by the 0.6490 – 0.6500 region, are likely immediate resistance that could restrict the pair's up-move while a trade above 0.6500 can witness 23.6% Fibo of its April – August decline, near 0.6600 round figure mark prior to testing 0.6700 – 0.6710 horizontal resistance that could trigger the pair's rally towards 0.6900 area if broken on a closing basis.

EURNZD


Having failed to sustain the ascending trend-channel resistance break, the EURNZD witnessed a pullback towards 0.7275 mark; however, a bounce from the same level seems fueling the pair to again target the channel resistance re-test, presently near 0.8235-40 area. Though, the pair is less likely to break the channel resistance and can witness a pullback from the same, if not, it could rally towards the recent highs of 0.8730, breaking which 0.8980 – 0.9000 area becomes crucial to determine the pair's subsequent up-move. On the downside, 23.6% Fibo of its April August advance, near 0.7570, followed by the recent lows of 0.7275, could limit the pair's near-term decline while an extended decline below 0.7275 can be restricted by the channel support, near 0.7000 round figure mark. Moreover, an extended decline below 0.7000 can witness 38.2% Fibo, near 0.6860, and the 50-day SMA, presently near 0.6750, prior to targeting 0.6300 round figure mark, also including the 50% Fibonacci Retracement level.

GBPNZD


Four month old ascending trend-channel resistance restricted the last week's GBPNZD rally, that fueled the pair to six year's high; however, 23.6% Fibo of its April – August advance, near 2.3780, triggered the pair's bounce towards 2.4300 round figure mark. The pair currently trades near 2.4150 area, signaling a pullback to 23.6% Fibo, near 2.3780. However, the channel support, near 2.3640, quickly followed by 50-day SMA, presently at 2.3540, could limit the pair's near-term decline. Should the pair successfully breaks 2.3540 support on a closing basis, it becomes vulnerable to plunge towards 38.2% Fibo near 2.2930 mark; though, 2.3150 can become intermediate rest. Alternatively, recent high of 2.4300 and the 2.4450-60 can nearby resistances, breaking which the pair can again rally to its recent highs of 2.5180 and the channel resistance of 2.5460.

NZDCHF


Bounce from last Monday's close, near 0.6030 fueled the NZDCHF towards testing 0.6280 during last weekend; however, the pair failed to surpass 0.6275-80 horizontal mark and plunged to 61.8% FE of its May – July decline, near 0.6060 during Tuesday's trading. Should the pair manages to break 0.6060, it can immediately test 0.6000 – 0.5990 support area, breaking which 0.5950 and the 0.5900 round figure mark are likely supports before it could re-test the 100% FE of the said move, also including the recent lows, near 0.5780-75 support-zone. However, a reversal from current levels could find 0.6200 round figure mark, including July lows, as an immediate resistance prior to its 0.6275-80 re-test. Further, an extended advance beyond 0.6280 could be capped by the 50day SMA, near 0.6340, breaking which the pair could rally to 0.6500 – 0.6510 horizontal resistance region with 0.6400 round figure mark being an intermediate resistance.


“Original analysis is provided by Admiral Markets
 
Important CAD Pairs Technical Outlook

USDCAD

After rising to 1.3350 level, marking its highest level in over a decade, the pair witnessed some profit taking moves from higher levels. The pair is currently trading close the lower trend-line support of a short-term ascending trend-channel formation on 4-hourly chart. A decisive break below the lower trend-line support of the channel, currently near 1.3130-10 zone, now seems to open room for extension of the near-term corrective move towards its next important horizontal support near 1.2950 region with 1.3000 psychological mark acting as intermediate support. Alternatively, should the pair continue holding the trend-channel support and moves back above 1.3200 mark, it seems to make an attempt to retest 1.3280-1.3300 resistance. Further, on a sustained strength above 1.3300 mark the pair is more likely to surpass recent highs and aim towards testing the upper trend-line resistance of the channel, currently near 1.3440-50 area.

GBPCAD

The pair has clearly broken through a well-established ascending trend-channel held since early May this year and subsequently dropped below 23.6% Fib. retracement level support of its up-move from early May lows to recent highs. Hence, from current levels the pair seems more vulnerable to continue drifting lower, initially towards 2.0100 intermediate horizontal support and eventually towards testing 38.2% Fib. retracement level support near 1.9900 level. Meanwhile, a pull-back above 2.0300 mark now seems to confront immediate resistance near 2.0390-2.0400 level and any further strength above 2.0400 mark now seems to be capped at the trend-channel break-point, support turned resistance, near 2.0500 psychological mark. Only a follow-up strength above 2.0500 mark now seems to negate near-term bearish outlook for the pair.

AUDCAD

Following a break below an important support near 0.9400 horizontal area, the pair dropped to test 61.8% Fib. expansion level support near 0.9300 mark. Any bounce-back from 0.9300 support is now likely to face strong resistance at its previous strong support now turned resistance near 0.9400 mark. Further, strength above 0.9400 mark now seems to be short-lived and is more likely to be capped at 0.9500 mark. Meanwhile, weakness below 61.8% Fib. expansion level support near 0.9300 mark seems to immediately drag the pair towards testing sub-0.9200 mark support, level earlier tested in July-August 2013. The near-term downward trajectory is expected to continue even below 0.9200 support towards testing 100% Fib. expansion level support near 0.9000 important psychological mark.


EURCAD

The pair's corrective move from 1.5550-60 resistance area, marking its highest level since Mar. 2014, seems to have found some intermediate support near 1.4700 mark. However, bounce from this 1.4700 mark support now seems to find difficulty in conquering 1.4950-60 resistance area, represented by 23.6% Fib. retracement level of its upswing from April lows to August highs. The movement between an intermediate support and immediate resistance suggests near-term range-bound move till the pair either breaks below 1.4700 mark support or decisively strengthens above 1.4950-60 resistance. A clear strength above 23.6% Fib. retracement level seems to boost the pair immediately towards 1.5150 resistance area. Meanwhile, decisive weakness below 1.4700 mark is likely to drag the towards testing sub-1.4600 mark support, representing 38.2% Fib. retracement level.


“Original analysis is provided by Admiral Markets
 
Technical Overview – Important CHF Pairs

USDCHF

Following its sharp recovery from 0.9260-50 support area leading to strength back above 200-day SMA, the pair now seems to have entered consolidation phase as depicted by formation of a Rectangle on 1-hourly chart. The trading range resistance, near 0.9660-80 zone, also coincides with 23.6% Fib. retracement level of its Jan. 15 lows to March highs upswing. A sustained trade above 0.9660-80 resistance area, marking a clear break through from the Rectangular formation, now seems to pave way for continuing the pair's near-term up-move initially towards 0.9800 mark horizontal resistance before aiming towards its next major resistance near 0.9850 level. The 0.9850 resistance represents a descending trend-line extending from Jan. high through highs tested in March and in August. On the downside, the lower end of the trading range, near 0.9570-60 area, seems to continue providing immediate support for the pair. Failure to hold the trading range support and a subsequent drop back below 200-day SMA support, currently near 0.9540-35 level, seems to drag the pair towards testing 38.2% Fib. retracement level support near 0.9360-50 region. This is closely followed by a strong support marked by short-term ascending trend-line support, near 0.9300-0.9280 area.

EURCHF

Even as the pair has managed to climb back above 200-day SMA, it continues facing resistance near 1.0900 mark, representing 61.8% Fib. expansion level of its up-move from Jan. low to Feb. high. The 1.0900 resistance area also coincides with 50% Fib. retracement level of the pair's big fall witness on Jan. 15. Should the pair manage to conquer this immediate resistance it is likely to extend it near-term upward trajectory towards 61.8% Fib. retracement level resistance near 1.1130 level. Alternatively, reversal from 1.0900 resistance and a subsequent weakness back below 200-day SMA, currently near 1.0770 region, is likely to infuse additional near-term weakness initially towards an intermediate horizontal support near 1.0670 level and eventually towards 38.2% Fib. retracement level support near 1.0590 area. Considering that the pair has moved above 200-day SMA for the first time since Jan. and with RSI reading above 50 suggests higher possibilities of resumption of the prior recovery trend. However, a decisive break back below 200-day SMA might negate the near-term bullish expectations.

GBPCHF

After nearly recovering its heavy losses recorded on Jan. 15, the pair started sliding back but has managed to hold an important support confluence near 1.4640-20 area, comprising of 200-day SMA and 50% Fib. retracement level of May to August upswing. Should the pair continue holding above this important support confluence and move back above 38.2% Fib. retracement level resistance near 1.4800 mark, it seems more likely to move back towards testing 50-day SMA intermediate resistance, currently near 1.4920 level. Strength above 50-day SMA is likely to be followed by an up-move back towards 1.5000 psychological mark resistance, also coinciding with 23.6% Fib. retracement level. However, should the pair fail to register any meaningful bounce from 1.4640-20 support confluence and starts weakening below 1.4600 mark, it is likely to accelerate its fall immediately towards 1.4520 intermediate support. The fall could further get extended towards 61.8% Fib. retracement level support near 1.4420-1.4400 round figure mark.

CHFJPY

Failure to hold an important support near 125.40-20 area, coinciding with 61.8% Fib. retracement level support of its up-move from March lows to high tested in June, now seems to have opened room for continuing the near-term depreciating move. Moreover, on daily chart the pair clearly seems to be trending down as depicted by formation of a descending trend-channel. Hence, a follow-up selling pressure below 124.00 round figure mark seems to continue dragging the pair lower towards testing its next major support near 122.20-122.00 zone, also marking the lower trend-line support of the descending channel. Any bounce from current levels, now seems to face immediate strong resistance at an important support break point near 125.00-125.20 area. Any follow-up strength above 125.00 mark now seems to be capped at the very important 200-day SMA resistance, currently near 126.50-60 region, also nearing the upper trend-line resistance of the channel.


“Original analysis is provided by Admiral Markets
 
Technical Outlook: Important AUD Pairs

AUDUSD


Pair's failed attempt to bounce from 0.7040 pulled the AUDUSD back to sub-0.7000, marking fresh six years low; however, four month old descending trend-channel support, coupled with the 100% FE of its November 2014 – April 2015 decline, near 0.6900 round figure mark, could provide strong support to trigger the pair's pullback towards 0.7100, followed by the 0.7200 psychological resistance. Though, channel resistance, presently at 0.7315, and the 50-day SMA, together with the 61.8% FE of the said move, near 0.7370-80 area, could limit further upside by the pair. Should it break the 0.7380 on a closing basis, the 0.7530-40 horizontal mark, including April lows, becomes a strong resistance to stop successive upward trajectory by the pair. Meanwhile, break of 0.6900 can make the pair vulnerable to aim 0.6700 level on the downside.

EURAUD


Failure to break 1.6600 round figure mark horizontal resistance, including November 2009 highs, gave rise to EURAUD correction towards 1.5600 area; though, renewed buying pressure seems currently fueling the pair to 1.6250 immediate resistance, breaking which 1.6340-50 are is likely an intermediate resistance before the pair can give another shot to test 1.6600 mark while a break of which can make the pair climb 1.6900 region. On the downside, 38.2% Fibo of its recent advance, near 1.5880, followed by the 1.5800 psychological level, also including the ascending trend-line support, are likely immediate supports that the pair can test. Should it fails to hold 1.5800 level, 50% Fibo, near 1.5650 and the 1.5550 are likely consecutive rests that the pair could look for during its downward trajectory before testing the 1.5300 horizontal support that could restrict near-term declines by the pair. Moreover, a break of 1.5300 could make the pair's decline more aggressive to test sub-1.5000 area.

GBPAUD


Even if the ascending trend-channel resistance, presently near 2.2230, restricted the GBPAUD advance during last week, the pair bounced from 23.6% Fibonacci Retracement of its January – August advance, signaling a heads up to 2.2050 area before testing the channel resistance and to the recent highs of 2.2390 – 2.2400 area. Moreover, an extended rise above 2.2400 is less likely to stop before 2.2800 with 2.2550 being intermediate rest. Alternatively, the said 23.6% Fibo, near 2.1430, followed by the channel support, 2.1330, are likely levels that could limit the pair's near-term decline. Given the pair's inability stop near 2.1330, it can plunge to sub - 2.0900 area, testing 2.0850, as mentioned by the 38.2% Fibo level.

AUDCHF


The 0.6930-40 horizontal mark, including July-August lows, restricted the AUDCHF's bounce from 0.6530, making its vulnerable to re-test 0.6650-40 support area, prior to targeting the recent lows. However, 100% FE of its March – July decline, near 0.6500 round figure mark, could provide strong support to limit the pair's further decline, breaking which the pair can plunge to 0.6200 area. On the upside, 0.6800 mark, as signaled by the 61.8% FE, becomes an immediate resistance for the pair trader to watch, breaking which 0.6900 and the 0.6930-40 are likely consecutive barriers that could limit the pair's further upside. Moreover, a sustained trading above 0.6940 can strengthen the pair to extend its upward trajectory towards 0.7090 – 0.7100 area.


“Original analysis is provided by Admiral Markets
 
Technical Update - GBPUSD, AUDNZD and NZDJPY

GBPUSD
be8qpg.png


The pair once again failed to capitalise on its strength above 200-day SMA. The pair subsequently dropped below 50% Fib. retracement level of its up-move from April low to June high to test its lowest level in 3-months. From current levels, the pair seems vulnerable to continue drifting lower to retest June lows support near 1.5200-1.5180 area. Failure to hold 1.5200 level now seems to open room for an immediate downside towards testing 61.8% Fib. retracement level support near 1.5080 region. However, should the pair manage to hold 1.5200 mark support and starts moving above 1.5250-60 immediate resistance marked by 50% Fib. retracement level, it seems more likely to extend the bounce towards retesting 200-day SMA, currently near 1.5350-60 area. Only a decisive move above 200-day SMA leading to a subsequent strength above 1.5400 mark, representing 38.2% Fib. retracement level, might negate possibilities of any further downside for the pair.

AUDNZD
x3uam8.png


Barring its sharp volatile move in the beginning of the week gone-by, the pair continues to reverse from a short-term descending trend-line resistance. On the flip side, the pair has managed to hold an important support near 1.0940-20 area, also coinciding with 100-day SMA. Should the pair decisively break below this important support, it is likely to continue drifting lower towards its next major support at 200-day SMA, currently near 1.0700-1.0680 zone. Meanwhile, a bounce from current support area, is likely to confront immediate resistance near 1.1020 horizontal level. A decisive strength above this immediate resistance set the stage for a retest of the short-term ascending trend-line resistance, currently near 1.1200-1.1220 area.

4j8ack.png


After a sharp fall in the previous week, towards 72.00 mark, the pair recovered sharply to move back above 81.00 mark. The 72.00 mark support also coincides with 61.8% Fib. retracement level of the pair's big up-move that started in May 2012 and lasted till Nov.-Dec. 2014. The pair, however, resumed its weakening trend this week and is now headed for its lowest weekly close since August 2013. Should the pair close below 76.00 mark, representing 50% Fib. retracement level, it is likely to extend its weakening trend in the near-term back towards retesting 61.8% Fib. retracement level support near 72.00 mark. Any bounce-back now seems face immediate resistance near 76.80-77.00 mark horizontal zone. Should the pair manage to hold 76.00 mark support and strengthen back above 77.00 mark resistance, it seems more likely to extend the near-term recovery back towards 80.00 psychological mark, coinciding with 38.2% Fib. retracement level and also nearing 50-day SMA.

Original material is provided by Admiral Markets
 
Technical Check - Important EUR Pairs and Euro Index

EURUSD

The pair failed to build on its sharp up-move from 1.1000 level to above 1.1700 mark and subsequently reversed back to test an important support confluence near 1.1150 level. The 1.1150 support level comprises of 61.8% Fib. retracement level of 1.0808 to 1.1713 up-swing, a short-term ascending trend-line support and a descending trend-line resistance break point. The pair is currently trading near the ascending trend-line support near 1.1200 mark. A decisive break below 1.1200 mark now seems to immediately drag the pair back towards testing 61.8% fib. retracement level support near 1.1150. The fall could further get extended towards testing 1.1120-10 support area, comprising of 100-day SMA and the descending trend-line break-out point. Alternatively, should the pair continue holding above 1.1200 mark and manages to move back above 50% Fib. retracement level resistance near 1.1250-60 zone, it seems more likely to clear 1.1300 intermediate resistance and aim towards testing 38.2% Fib. retracement level resistance near 1.1360-70 area. The up-move could further get extended towards the very important psychological mark resistance near 1.1500 mark, also coinciding with 23.6% Fib. retracement level.

EURGBP

Following a break-through a descending trend-line resistance, the pair's recovery extended to test an important resistance near 0.7350 level. The pair is currently hovering around 0.7350 resistance area, comprising of 200-day SMA and 23.6% Fib. retracement level of Aug. 2013 to July 2015 big downfall. The pair has managed to move above 200-day SMA for the first time since Oct. 2013 and should it continue holding above 0.7350-70 resistance area it seems more likely to extend the recovery trend towards 0.7600-20 resistance area, marked by 38.2% Fib. retracement level. Intermediate resistance levels area pegged near 0.7440-50 zone and 0.7560-70 region. However, should the pair starts reversing from this immediate resistance and subsequently drop below 0.7310-0.7300 support area, it is likely to drop immediately towards testing the descending trend-line resistance break-point now turned support near 0.7200 level. Further, a decisive weakness back below 0.7200 mark might negate any near-term bullish expectations, thus paving way for resumption of the prior weakening trend towards testing a very important support near 0.7050-40 area.

EURJPY

The pair once again failed to sustain its strength above 200-day SMA and a reversal from a short-term descending trend-line resistance dragged the pair below a an ascending trend-line support. Extending its weakness, the pair subsequent dropped below 200-day SMA and has now weakened below 38.2% Fib. retracement level of its up-move from April low to high tested in June. From current levels, sustained weakness below 135.00 mark is likely to be followed by an extended fall towards testing a very important support at 133.60-50 area, nearing 50% Fib. retracement level, with 134.40 horizontal area providing some intermediate support. Meanwhile, bounce-back from 135.00 mark and a subsequent move above 38.2% Fib. retracement level resistance near 135.40 level now seems to confront resistance at 200-day SMA, currently near 136.20-30 region. A sustained trade above 200-day SMA has the potential to lift the pair back towards testing the ascending trend-line support break point now turned resistance near 137.50-60 zone, also coinciding with 23.6% Fib. retracement level. The 137.50 region now seems to act as a very important resistance on the upside.

Euro Index (I.EURX)

Although the index managed to move above 200-day SMA for the first time since May 2014, it seems to have lost momentum and started reversing from 38.2% Fib. retracement level of March 2013 to March 2015 bearish fall. The 38.2% Fib. retracement level also coincides with a short-term ascending trend-line resistance, which along with another ascending trend-line seems to constitute towards formation of a bearish Rising Wedge chart-pattern. The lower ascending trend-line support lies near 98.30 level, also coinciding with 23.6% Fib. retracement level. Failure to hold 98.30 important support, thus confirming the possible bearish Rising Wedge chart pattern, seems to accelerated the fall towards its next important support near 97.00 mark. However, should it manage to hold 98.30 support confluence and manages to move above 99.30-35 immediate horizontal resistance, the index is likely to make a fresh attempt to surpass 100.00 psychological mark resistance and aim towards retesting the very important resistance confluence near 101.00 mark. Only a decisive strength above 101.00 strong resistance might negate any near-term bearish outlook for the index.


“Original analysis is provided by Admiral Markets
 
Technical Outlook - USDJPY, GBPJPY, AUDJPY and CADJPY

USDJPY


Ever since the USDJPY broke 122.00 – 121.70 broad support region, it plunged to 116.00 round figure mark. However, a bounce from the lows, near 116.20, fueled the pair to re-test mentioned important support-turned-resistance region which it failed to surpass and again declined below 200-day SMA and the 50% Fibo of its December 2014 – June 2015 up-move, at 120.70-80 that now acts as an immediate resistance. Currently, 119.80, quickly followed by the 119.00 mark, may restrict the pair's immediate decline, breaking which 118.30 and the 117.00 are likely consecutive rests before the pair could plunge to 116.00 mark. Alternatively, a break of 120.70-80 can witness 121.70 – 122.00 region for one more time while a sustained trading above 122.00 can fuel the pair towards 123 and 124.50 levels during its extended upward trajectory.

GBPJPY


GBPJPY's plunge below 185.30 – 185.00 support area, including 50% Fibonacci Retracement of its April – June rally, forced the pair to test lowest levels in nearly four months. Though, descending trend-line support, also encompassing the 61.8% Fibo, near 182.80-70, acted as a bounce support for the pair during Wednesday. The pair seems currently struggling between 185.00 and the 182.70 region with downside being more expected. Should the pair breaks 182.70, it is likely to test 181.50 and the 180.00 round figure mark. Moreover, a sustained trading below 180.00 may find it difficult to break 178.50 multiple support area. On the upside, a clear break of 185.30 can quickly fuel the pair towards 187.50 and the 188.00 mark that signals 38.2% Fibo. Should the pair breaks 188.00 on a closing basis, 100-day SMA, near 189.30 may then act as an intermediate resistance prior to the pair's rally towards 191.00 mark.

AUDJPY


Sustained break of 89.30-35 horizontal support, including July lows, strengthened AUDJPY decline to test 82.00 round figure mark. Short covering rally from the low seems being capped by the immediate descending trend-line resistance, currently near 85.00 psychological level, signaling pair's extended downward trajectory towards 83.60 and to the 82.00 mark. Moreover, sustained trading below 82.00 may find 61.8% FE of it August decline to recent highs, near 180.50, as a consecutive support. Alternatively, break of 85.00 can quickly fuel the pair to test 38.2% Fibo, near 86.00 and to the 50% Fibo, near 87.30. Given the pair's successive move above 87.30, the 89.30-35 horizontal mark can again come into the play and can restrict the pair's further advance.

CADJPY


Even if the short-covering rally pulled the CADJPY towards 92.50 from its 87.30 mark, the pair failed to sustain the same resistance and is again signaling extended declines towards 90.00 and the 88.50 support levels. If the pair plunges below 88.50, it can target 87.30 and the 61.8% FE of it July – August decline, near 86.30. Should the pair reverses from the current level, 92.50 becomes an immediate resistance to restrict the pair's near-term advance, surpassing which 94.00 – 94.10 horizontal support could provide strong resistance to restrict the pair's further up-move.


“Original analysis is provided by Admiral Markets
 
Technical Update - EURUSD, USDJPY, USDCAD and AUDUSD

EURUSD

Last week, the pair broke through a short-term ascending trend-line support to test and bounce from 100-day SMA support near 1.1100-1.1080 area. The bounce from 100-day SMA now seems to reverse from an intermediate resistance near 1.1230-40 area, marking a short-term descending trend-line. From current levels, the pair seems to find immediate support at 100-day SMA, currently near 1.1120. Sustained weakness below 100-day SMA now seems to open room for continuing the near-term weakening trend immediately to 1.1020-1.1000 round figure mark support. However, should the pair continue holding 100-day SMA support and manage to move back above 1.1200 round figure mark resistance, leading to a move above the short-term descending trend-line resistance, currently near 1.1230 level, the pair seems more likely to extend its up-move towards testing the ascending trend-line support break-point, now turned resistance near 1.1290-1.1300 region.

USDJPY


The pair managed to bounce back from an important horizontal support nearing 118.50 level to clear a short-term descending trend-line resistance near 119.60-70 zone and is currently trading close to 120.00 mark. Any follow-up build-up above 120.00 mark, is more likely to confront a strong resistance near 120.70-80 area, also marking 200-day SMA. Only a sustained move back above 200-day SMA resistance might now negate any bearish outlook, thus paving way for further appreciating move in the near-term. Alternatively, should the pair fail to capitalise on its strength above the short-term descending trend-line resistance and start weakening back below 119.50 immediate support, the pair could possibly turn vulnerable to retest the very important support, currently near 118.80 level. Further, decisive weakness below 118.80 support opens room for continuing the near-term depreciating move towards retesting another strong support near 116.10-116.00 region.

USDCAD


Although the pair has maintained its up-trend, as depicted by formation of an ascending trend-channel on 4-hourly chart, it now seems to find difficulty in conquering 1.3300 mark resistance and thus seems vulnerable to retest the lower trend-line support of the channel, currently near 1.3180 level. Further, a decisive weakness below 1.3180 support, marking a break-down from the ascending channel, has the potential to further drag the pair towards 1.3100 mark support. The drop could get extended towards testing sub-1.3000 mark support in the near-term. However, should the pair manage to clear 1.3300 mark immediate resistance, it seems all set to surpass recent high resistance near 1.3350 region and continue climbing higher towards testing the upper trend-line resistance of the channel, currently near 1.3500 mark.

AUDUSD

The pair on 4-hourly chart seems to be in the process of forming a bullish reversal, Falling Wedge, chart pattern with the upper descending trend-line resistance near 0.7020 level. The formation, however, is not complete unless the pair decisively conquers this 0.7020 resistance, which also coincides with 23.6% Fib. retracement level of Aug. 24 to Sept. 04 downfall. Hence, a decisive break through 0.7020 resistance now seems to open room for extension of the near-term recovery move immediately towards 0.7100-0.7120 resistance, marking 50% Fib. retracement level. Meanwhile on the downside, 0.6945-40 area now seems to provide immediate support. Failure to hold this immediate support might lead to further weakness, possibly even below 0.6900 mark, towards testing another descending trend-line support, also forming part of the bullish Falling Wedge chart-pattern, currently near 0.6880 level.


“Original analysis is provided by Admiral Markets
 
Technical Outlook – EURGBP, EURJPY, EURAUD and EURNZD

EURGBP


Ever since the EURGBP failed to break 0.7400 – 0.7420 horizontal resistance region, it kept trading between the 0.7250 – 0.7400 area, portraying rectangle formation. The pair now trades near the formation support, 0.7250, breaking which it could quickly test 0.7200 round figure mark and the 0.7150 horizontal support; however, further downside by the pair can be restricted by 76.4% Fibo of its July – August advance, near 0.7050 and the 0.7000 round figure mark. Alternatively, a reversal from the current level can find multiple resistances near 0.7300 – 0.7310 zone, including 23.6% Fibo, breaking which the pair can extend its up-move towards 0.7400 – 0.7420 area. Should the pair successfully breaks 0.7420 on a closing basis, it can target 0.7600 area with 0.7490 - 0.7500 being intermediate resistance.

EURJPY


Although, short-covering rally, following the 133.50 – 133.00 broad support region break, fueled EURJPY towards testing 134 mark, a close above short-term descending trend-line, presently near 134, becomes prerequisite for the pair to target 38.2% Fibo of its April – June advance, near 135.30. Should the pair manage to stretch its advance beyond 135.30, the 23.6% Fibo, near 137.50 and the 138.90 – 139.00 horizontal region are likely consecutive resistances that the pair could aim during its upward trajectory. On the downside, 133.00 and the 61.8% Fibo, near 131.80 are likely immediate supports for the pair, breaking which the pair can plunge towards 130.00 round figure mark that serves as a strong barrier to limit its further decline. Given the pair's ability to break 130.00 on a closing basis, it can quickly test 128.70 and the 127.50 support levels.

EURAUD


Irrespective of the EURAUD's inability to break 1.6150 horizontal mark, encompassing 23.6% Fibo of its August advance, short-term ascending triangle formation keep favoring the pair's up-move. The pair seems now heading towards the formation support, near 1.5950, breaking which the pair can immediate test 1.5770 and the 1.5600 mark. Moreover, sustained decline following 1.5600 round figure mark break could make the pair vulnerable to test 1.5330-20 horizontal support, with 1.5460 being intermediate support. Given the pair's bounce from 1.5250, the 1.6050 could act as an immediate resistance before the pair could against target 1.6150 mark while continuation of the upward trajectory, following sustain break of 1.6150, could witness 1.6250 and the can fuel the pair towards August highs, near 1.6600 round figure mark.

EURNZD


Following its failed attempt to break four month old ascending trend-channel resistance, the EURNZD maintained trading between 1.7900 and the 1.7280-70 area. It currently trades near the 1.7900 resistance mark, breaking which the channel resistance, presently near 1.8300 could become strong resistance to limit further upside by the pair; however, 1.8000 psychological magnet can provide intermediate rest for the pair's up-move. On the downside, 1.7570, indicating 23.6% Fibo of its April – August advance, and the 1.7270, are likely immediate supports for the pair. Moreover, an extended decline below 1.7270 could find it difficult to break 1.7100 round figure mark, also including the channel support.


“Original analysis is provided by Admiral Markets
 
Back
Top