Elliott Wave Analysis by Admiral Markets

Major Forex Pairs at Decisive Support and Resistance

EUR/USD

4 hour
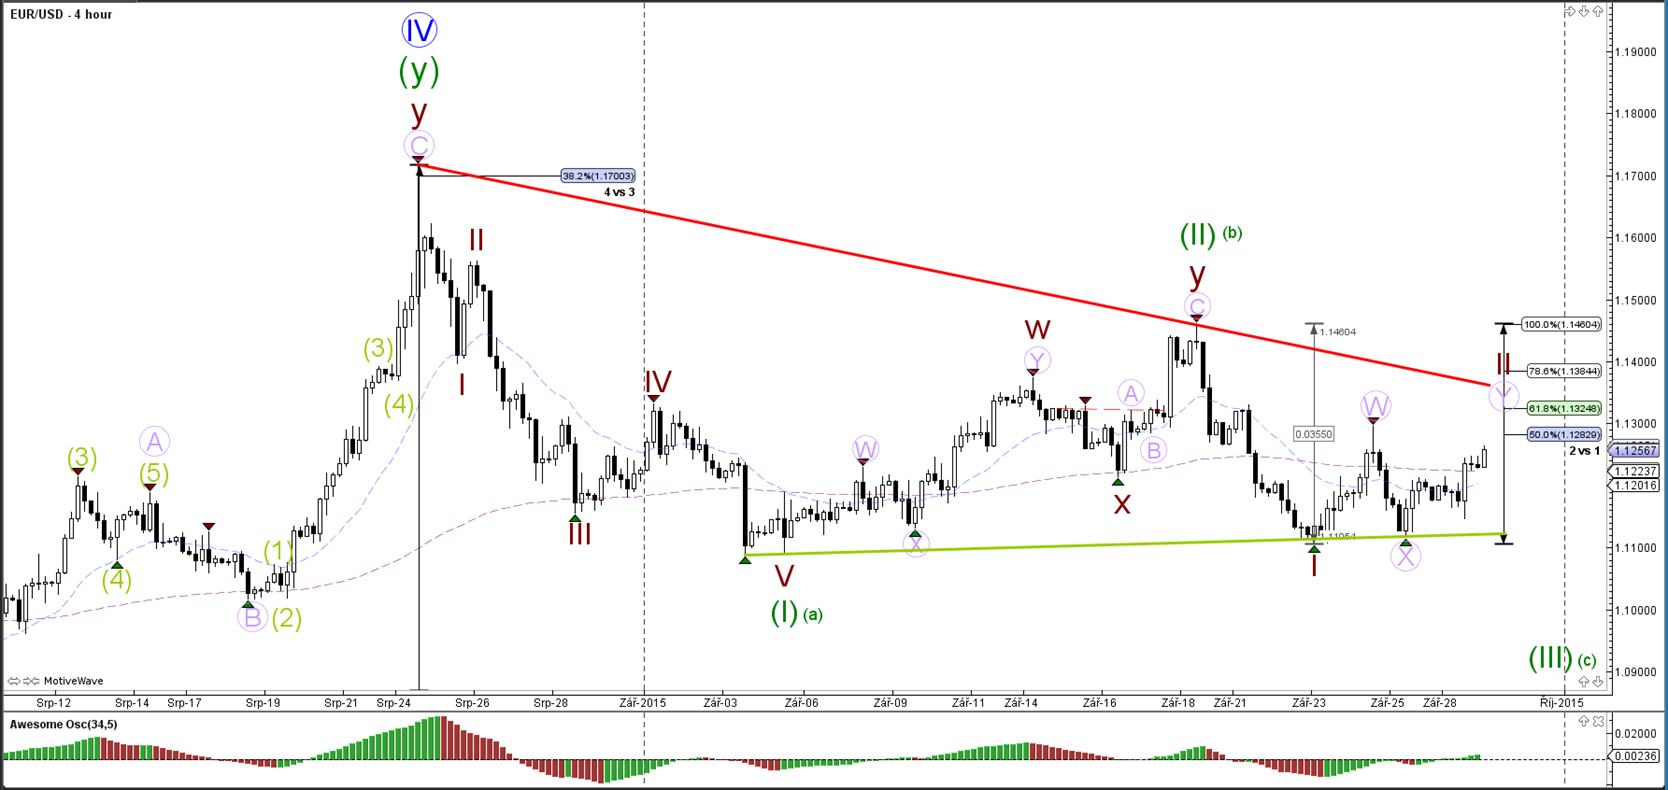


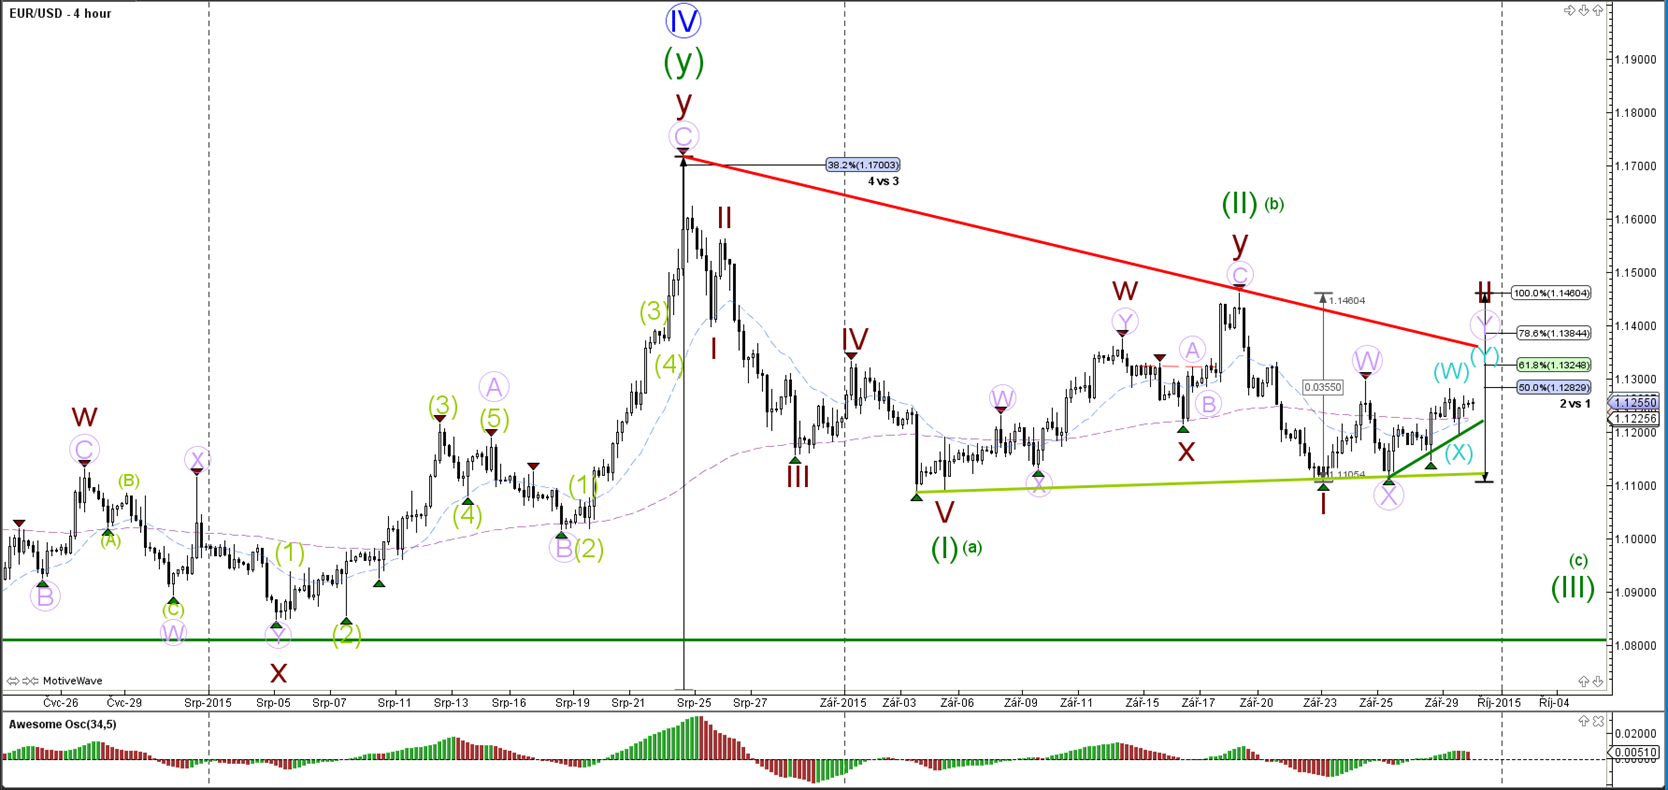
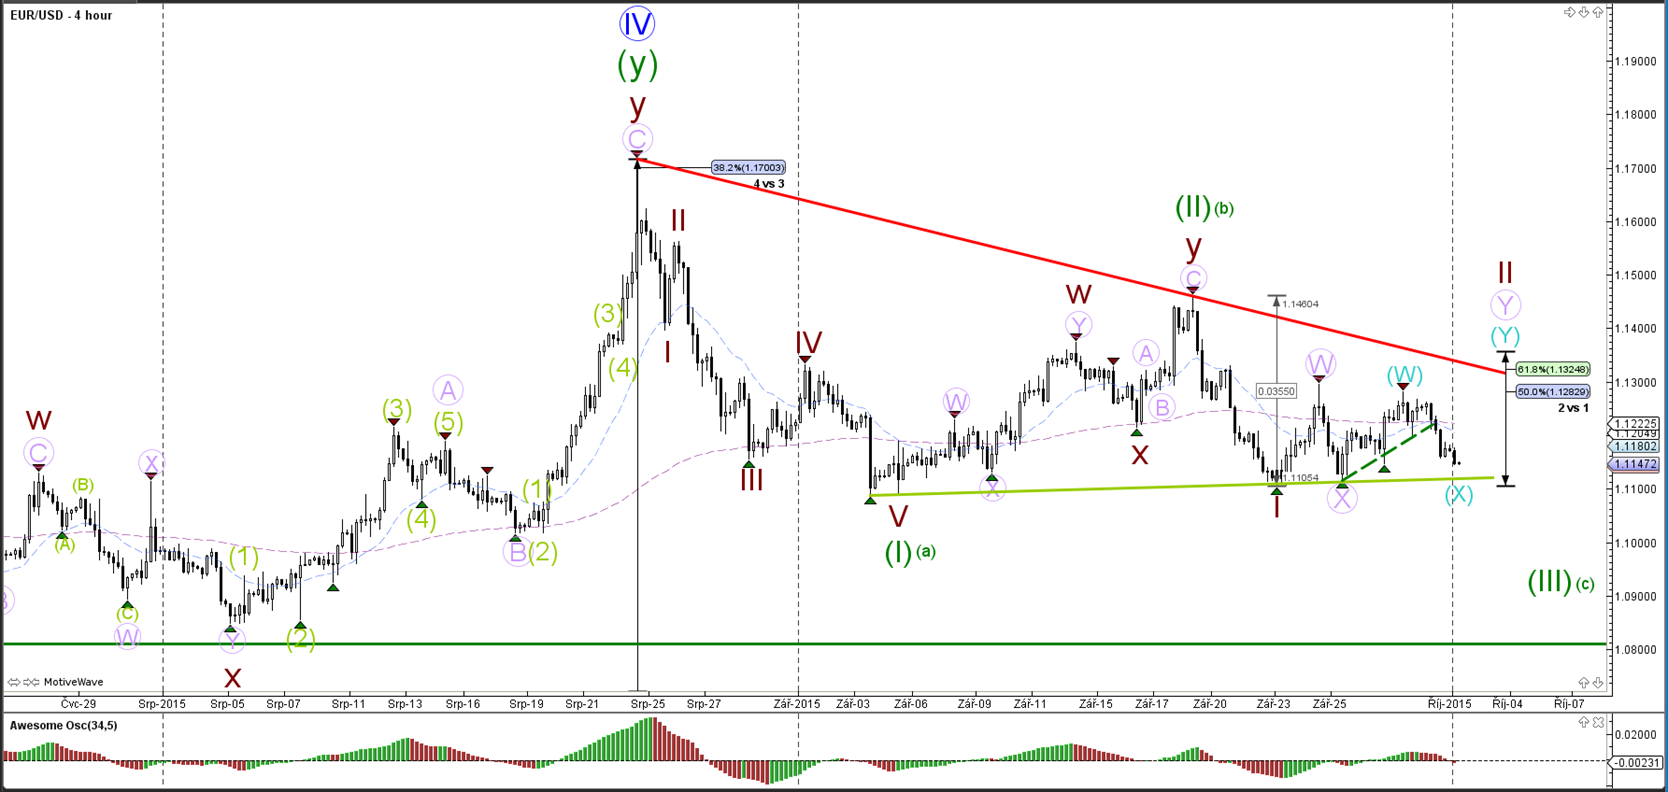
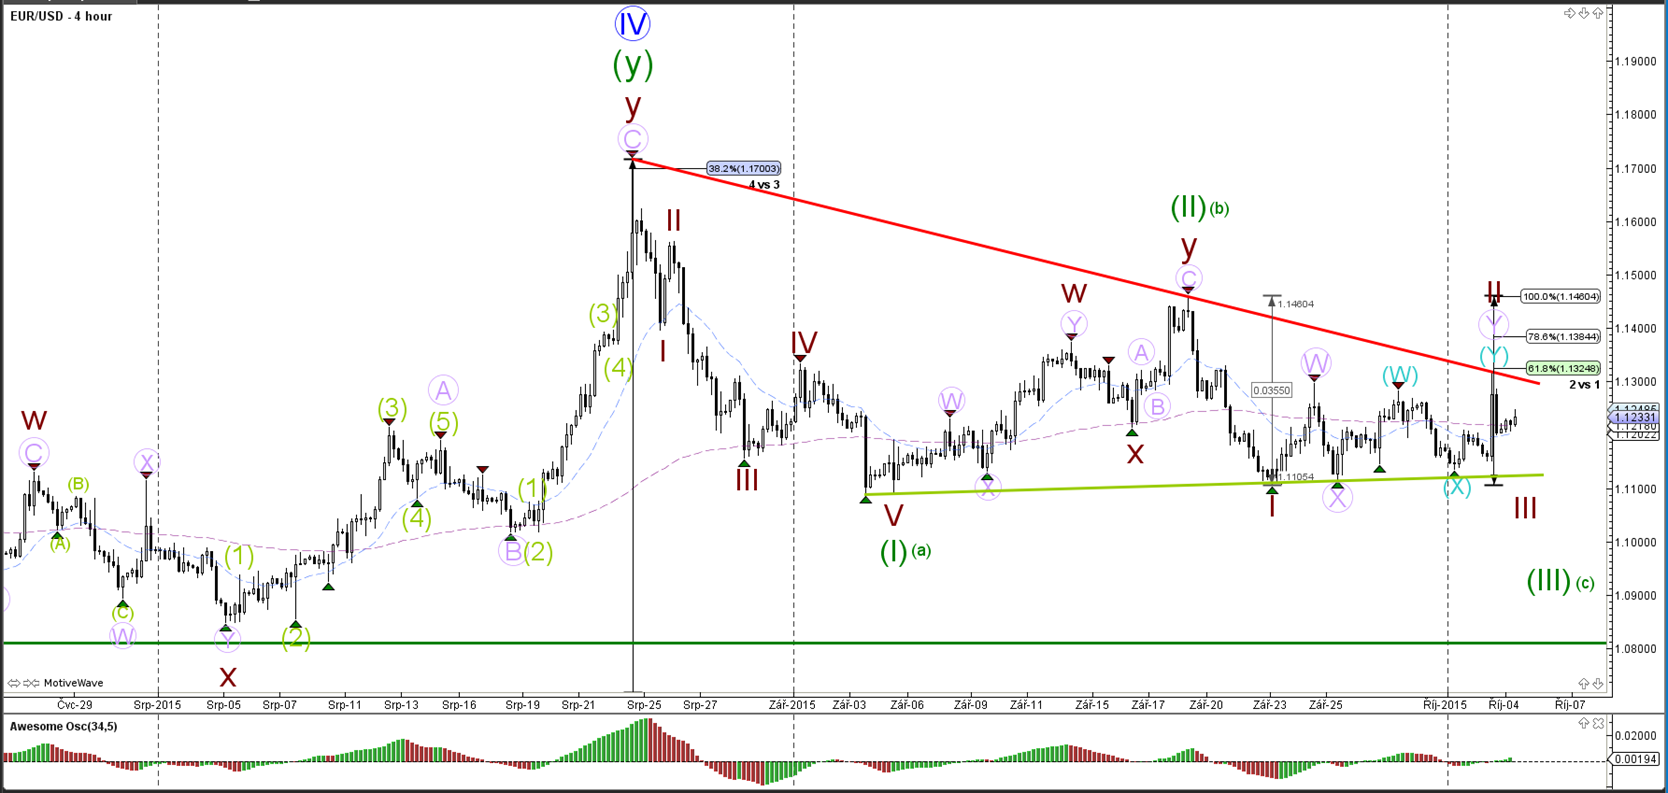
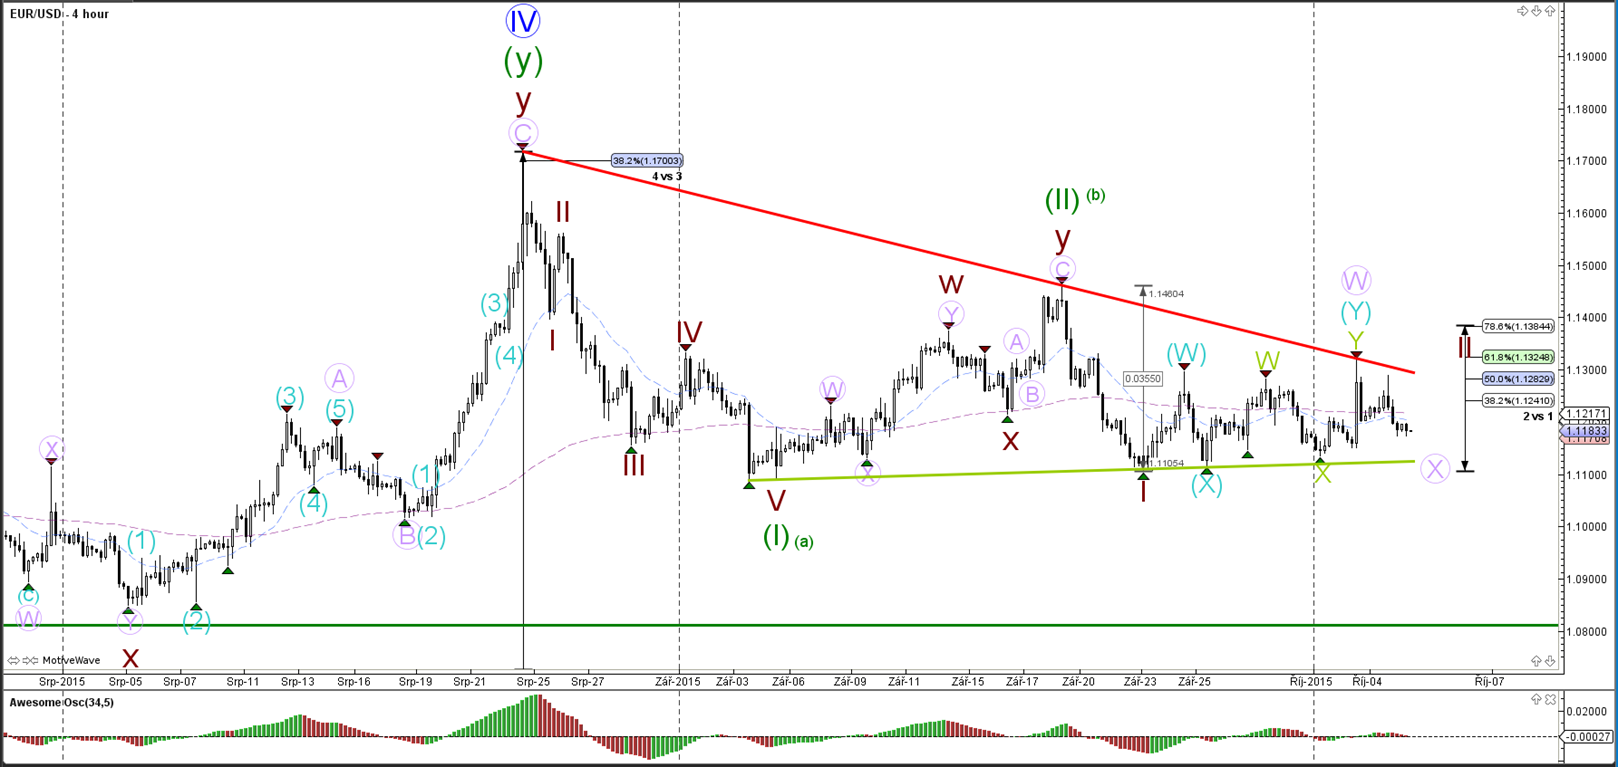
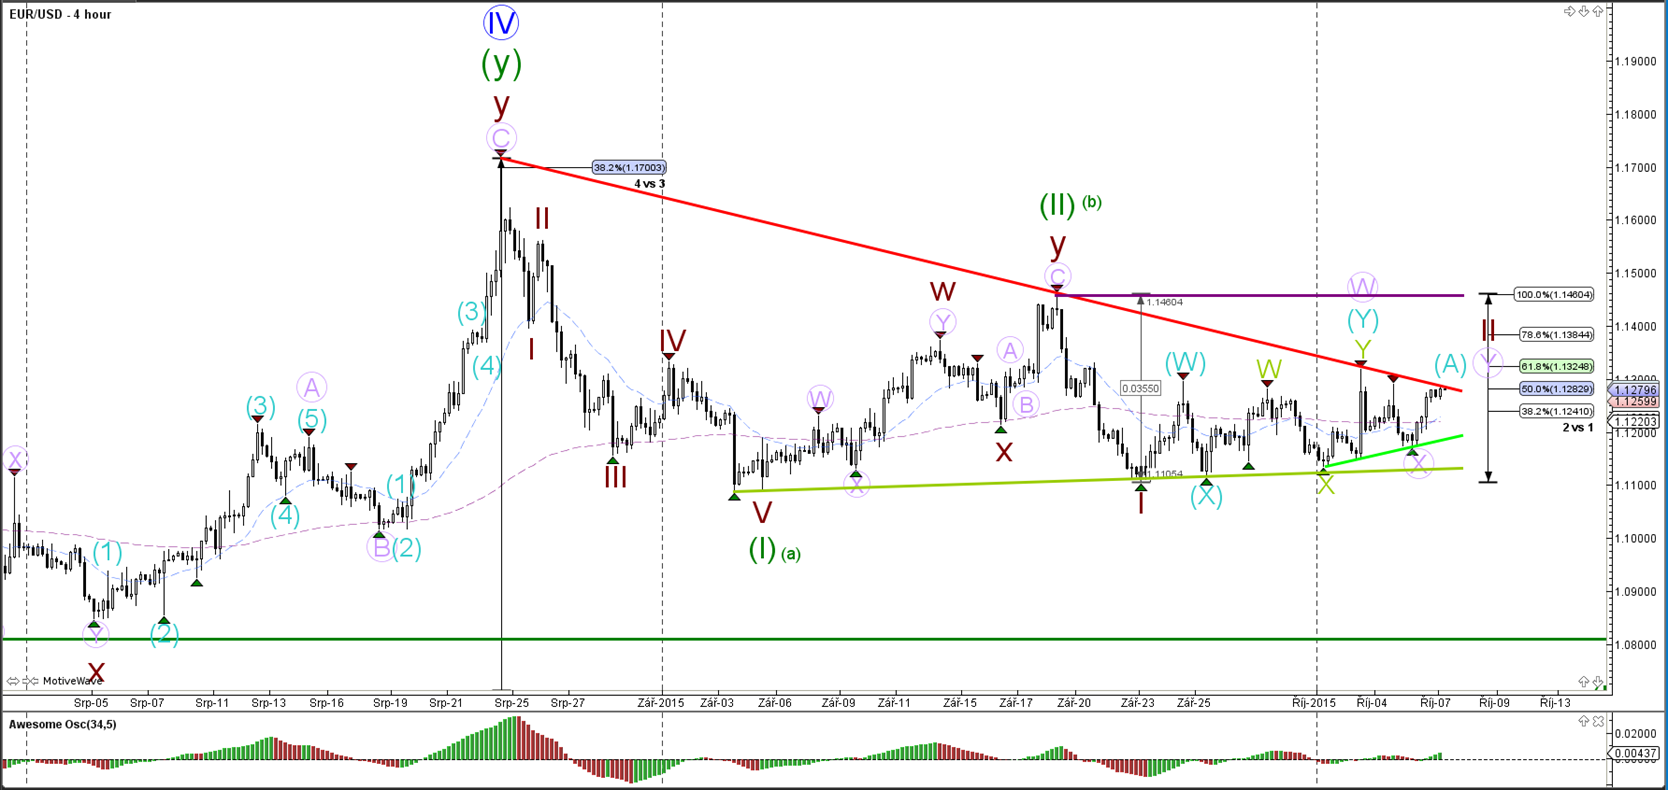
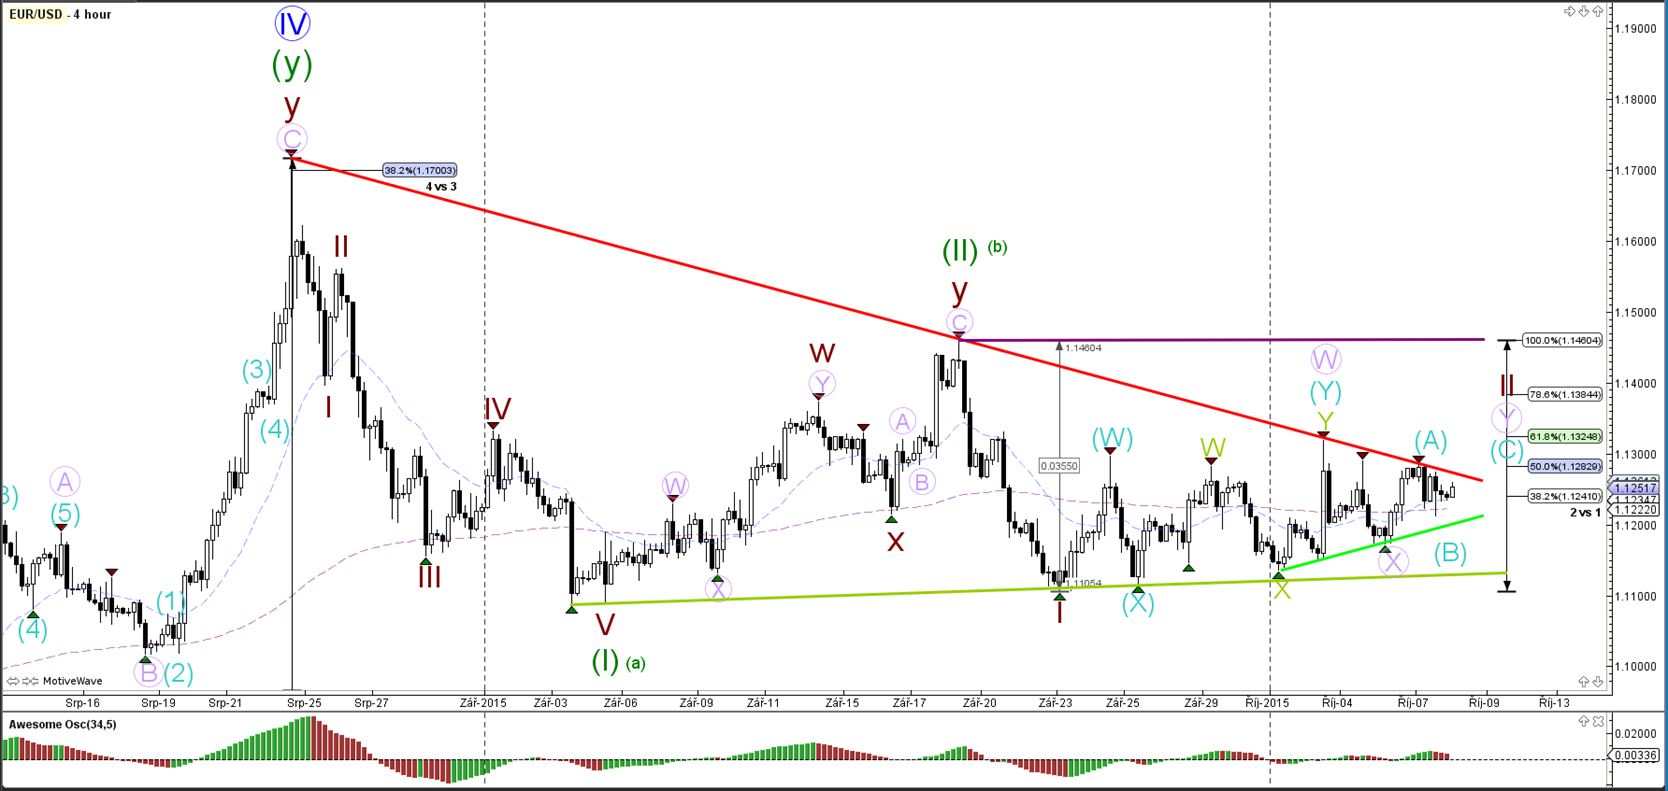
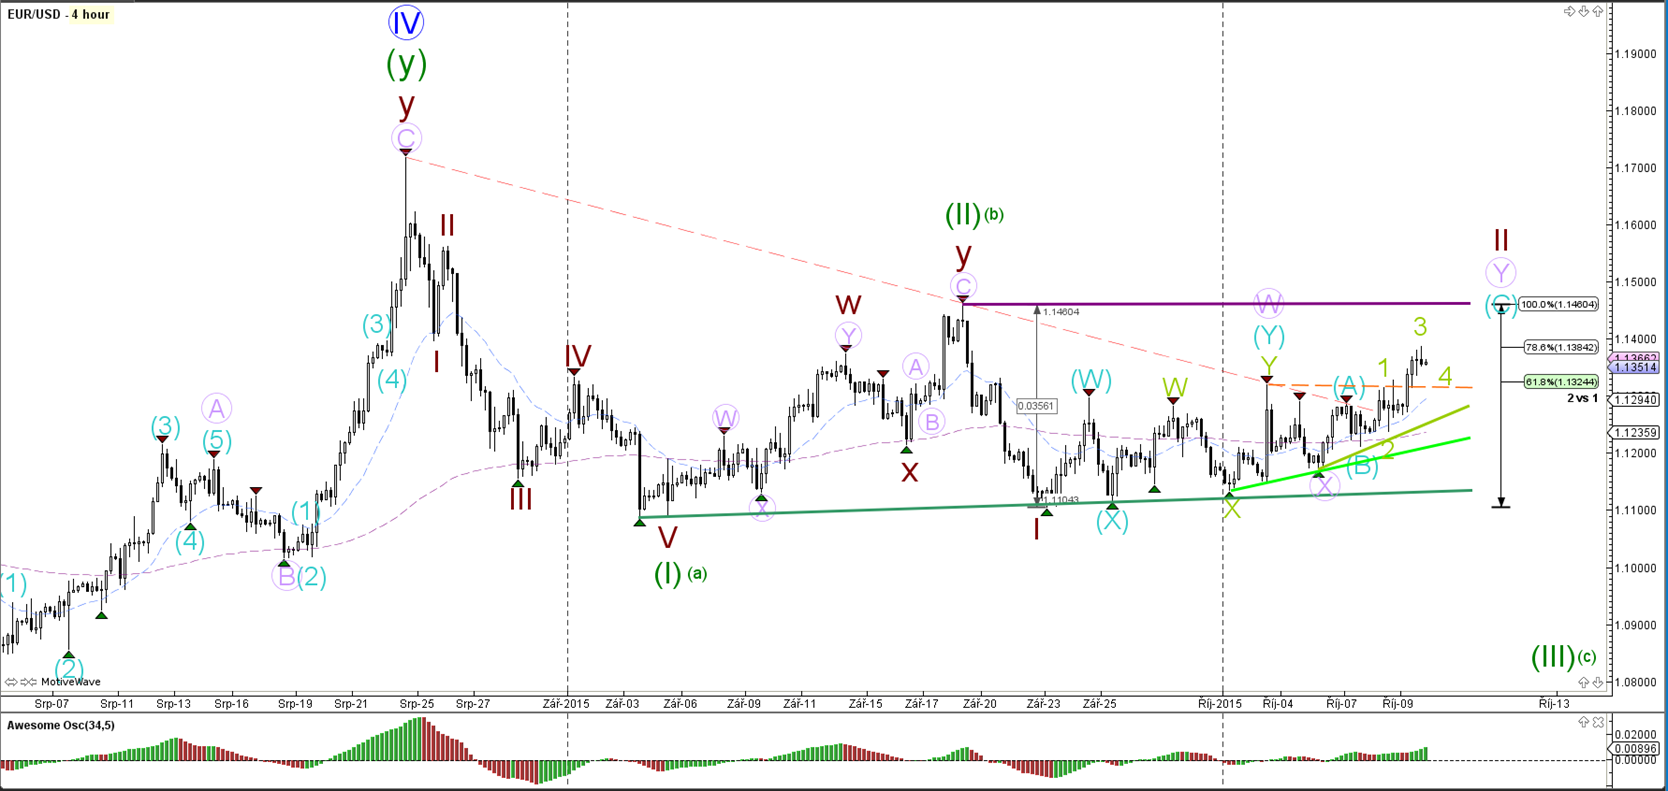
The EUR/USD is pulling back again within the wave 2 (brown) and has a potential of moving towards the 61.8% or the 78.6%. A break above the top (100%) invalidates the 1-2 development whereas a break below support (green) could initiate the start of wave 3 or C (green).

1 hour
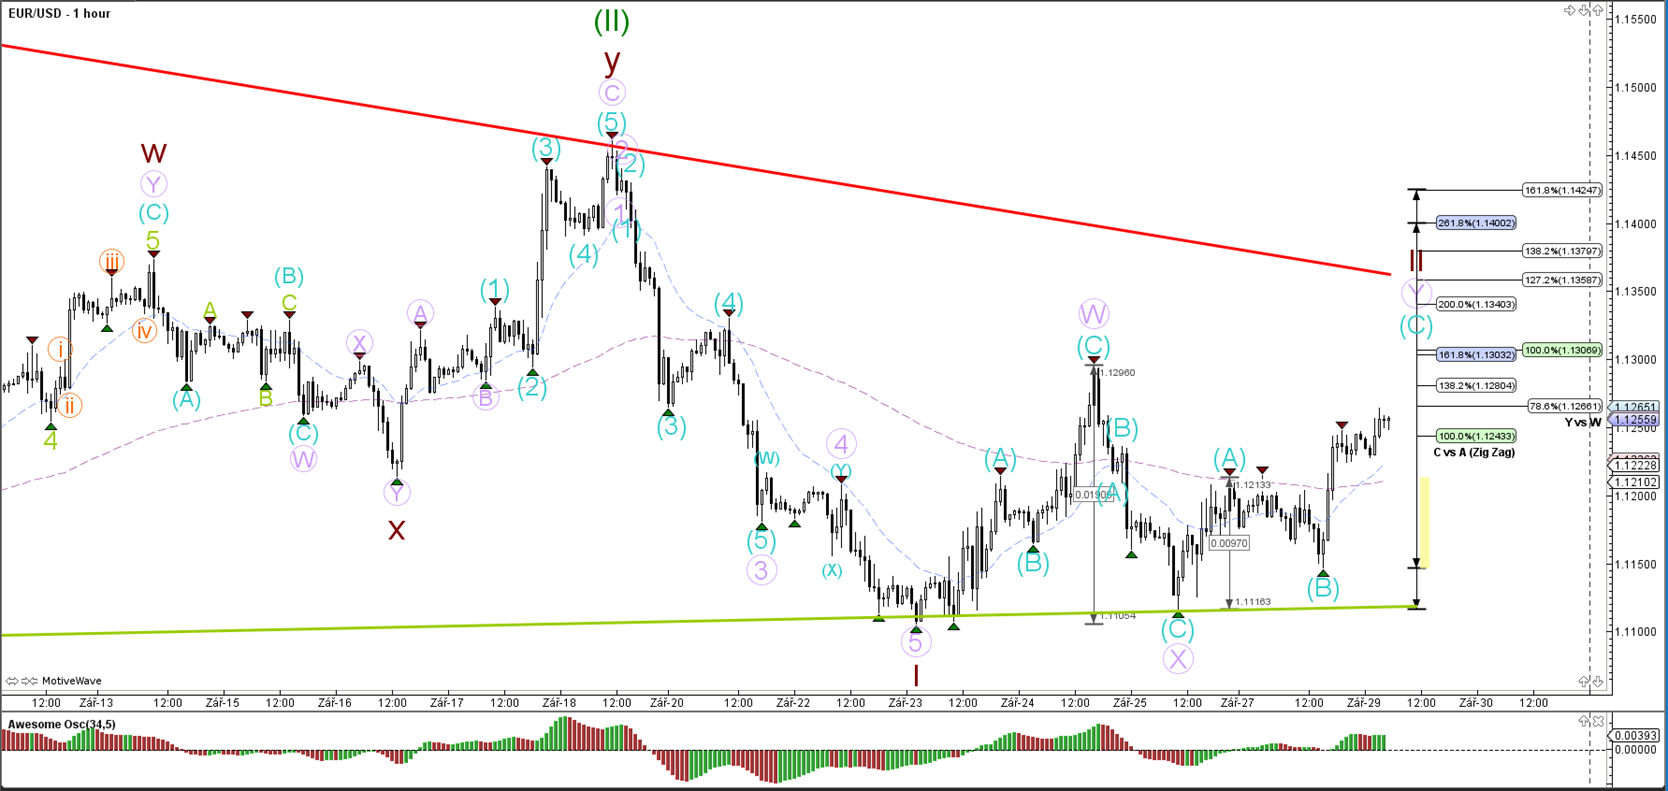


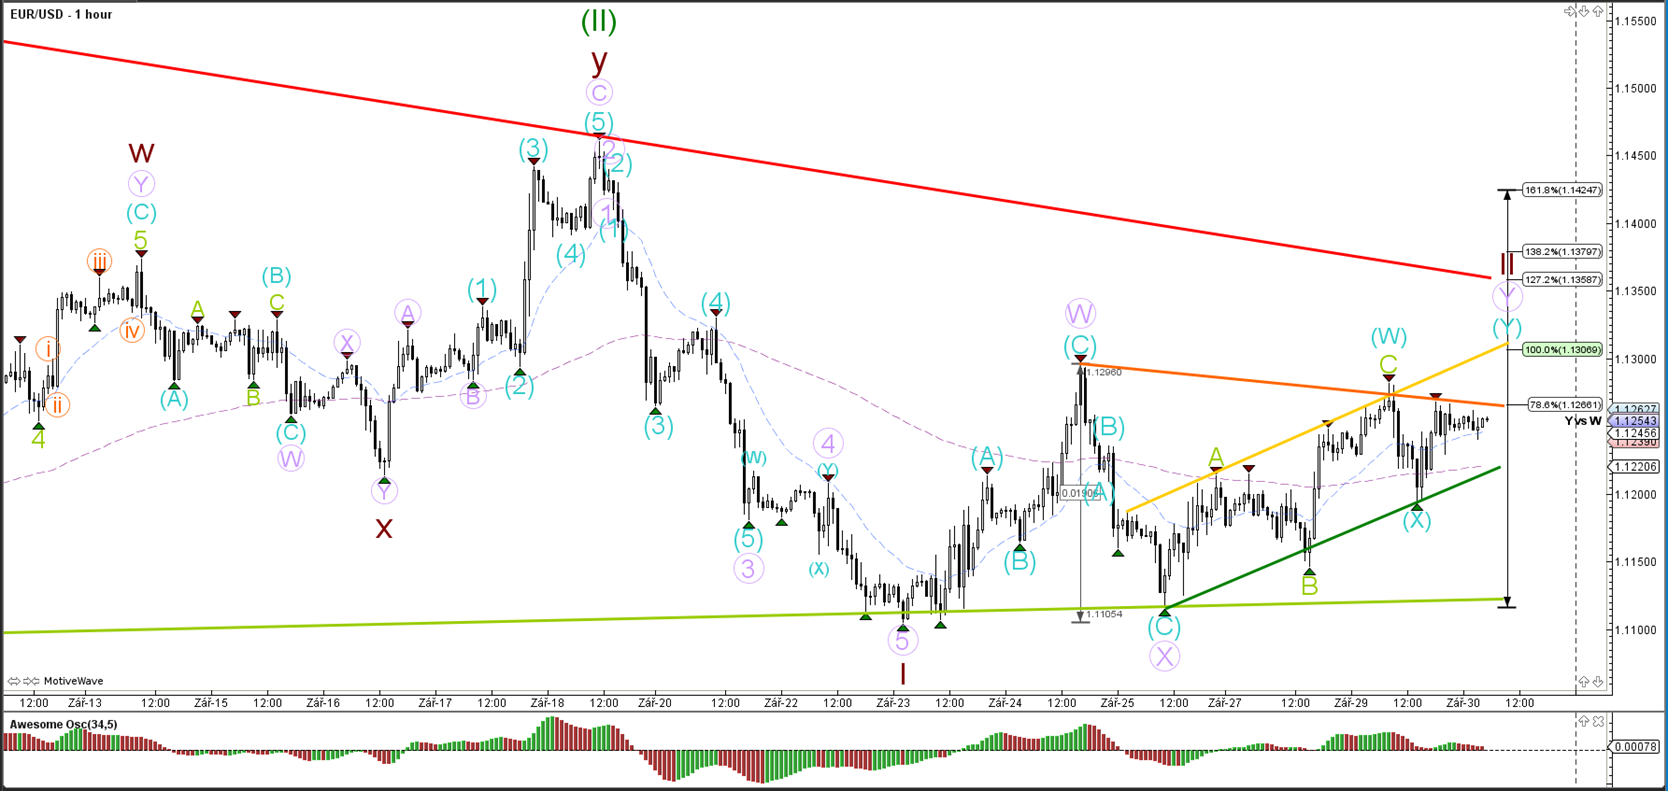
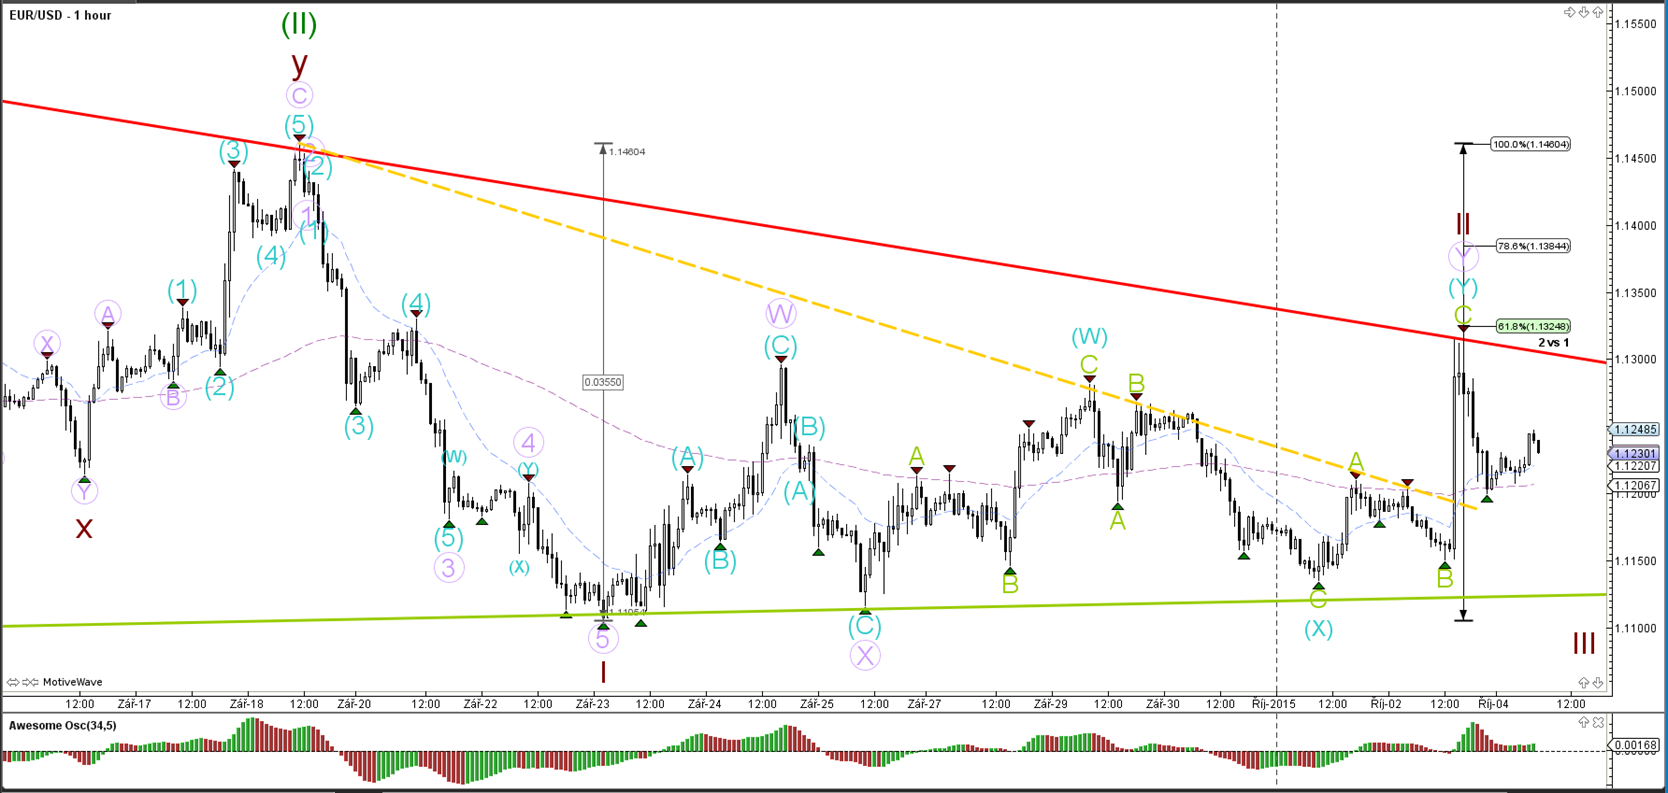
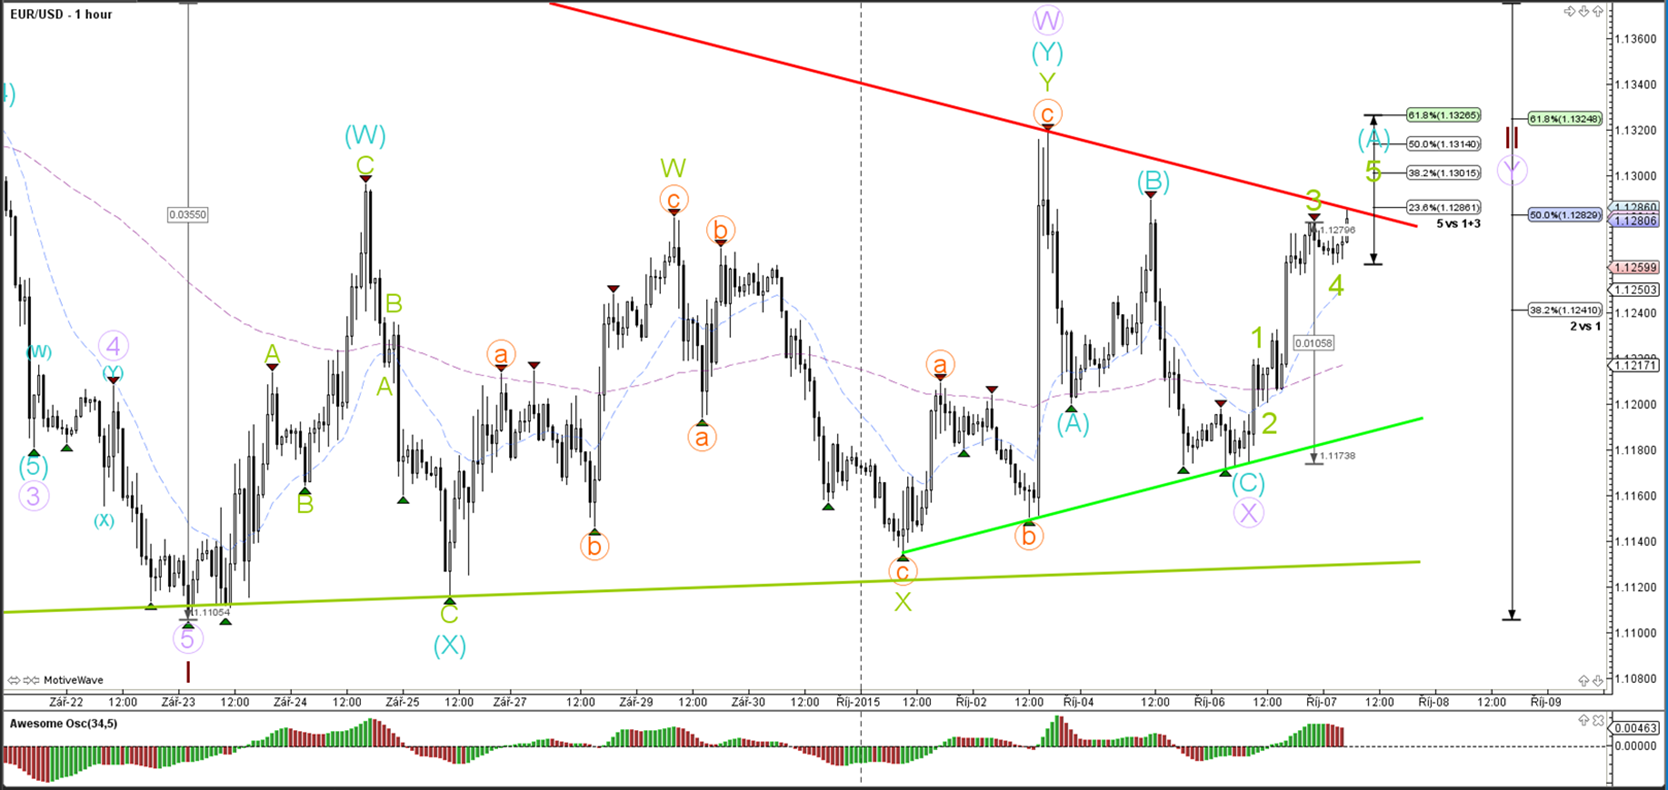
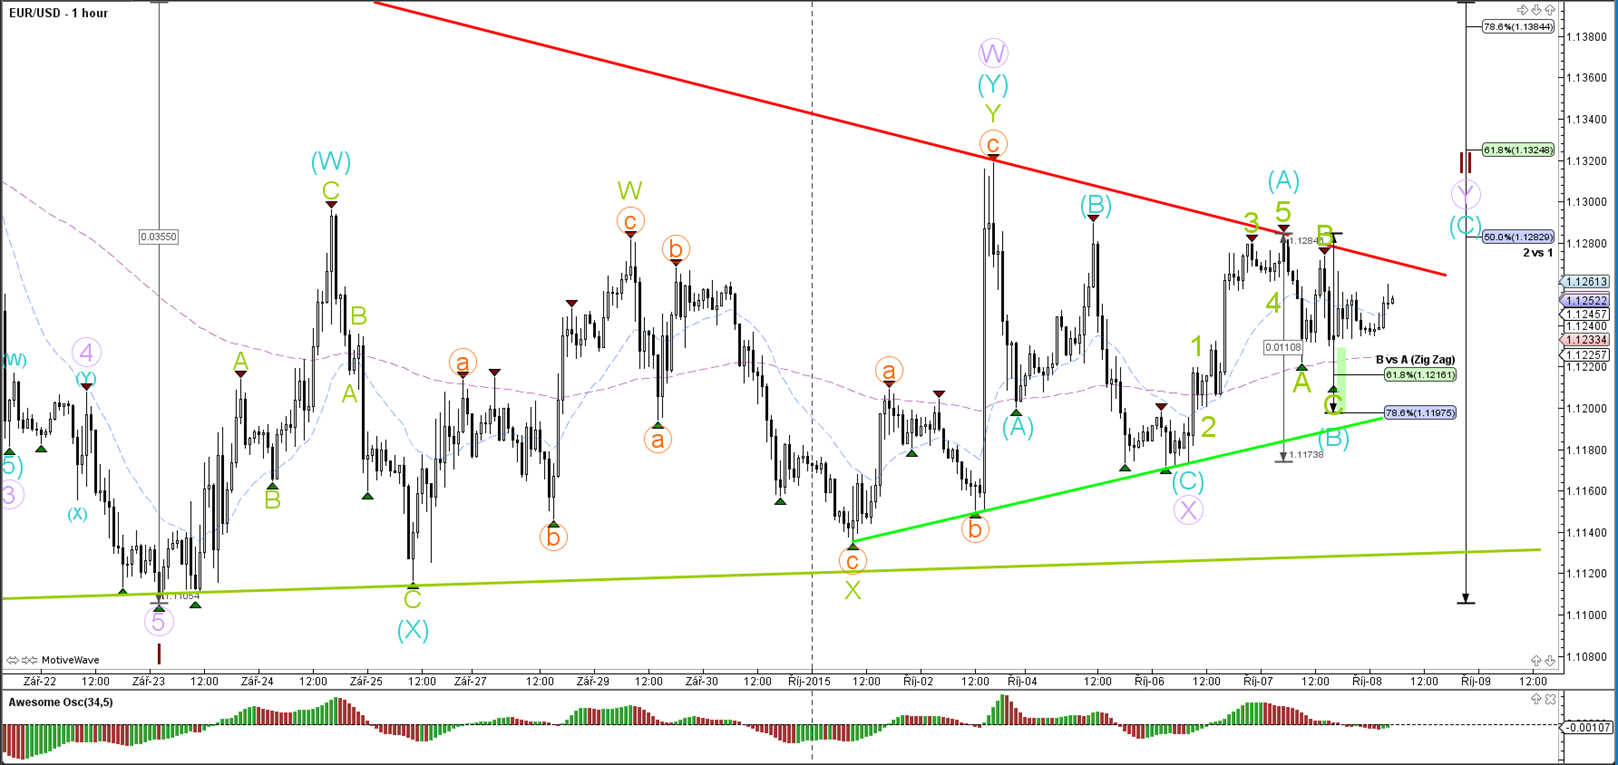
The EUR/USD made a bullish bounce at support (green) as part of the wave B (blue) turn around for a wave C (blue) rally.

GBP/USD

4 hour
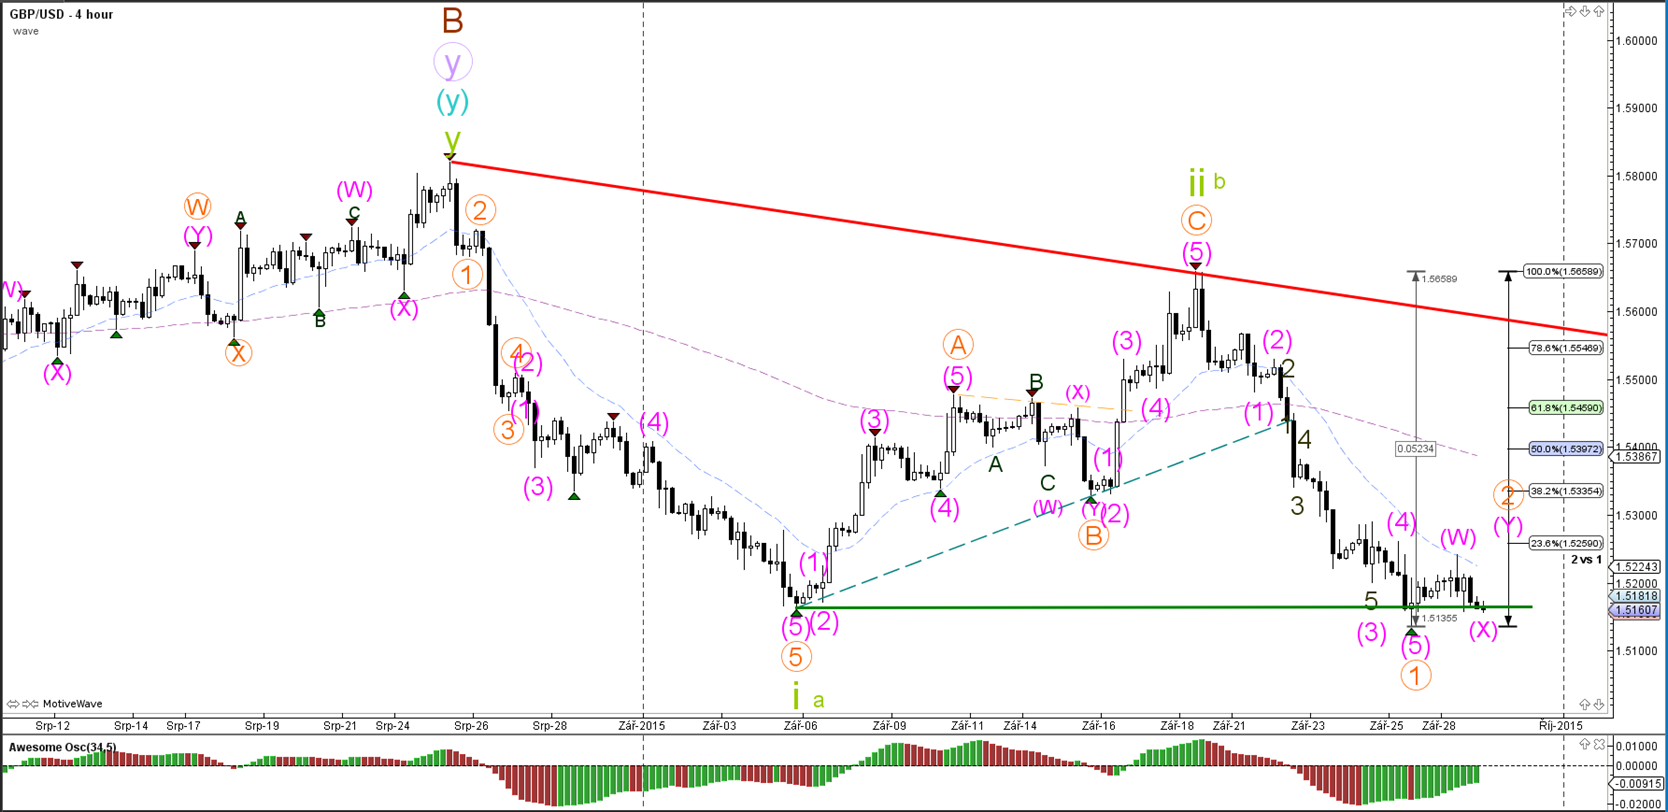


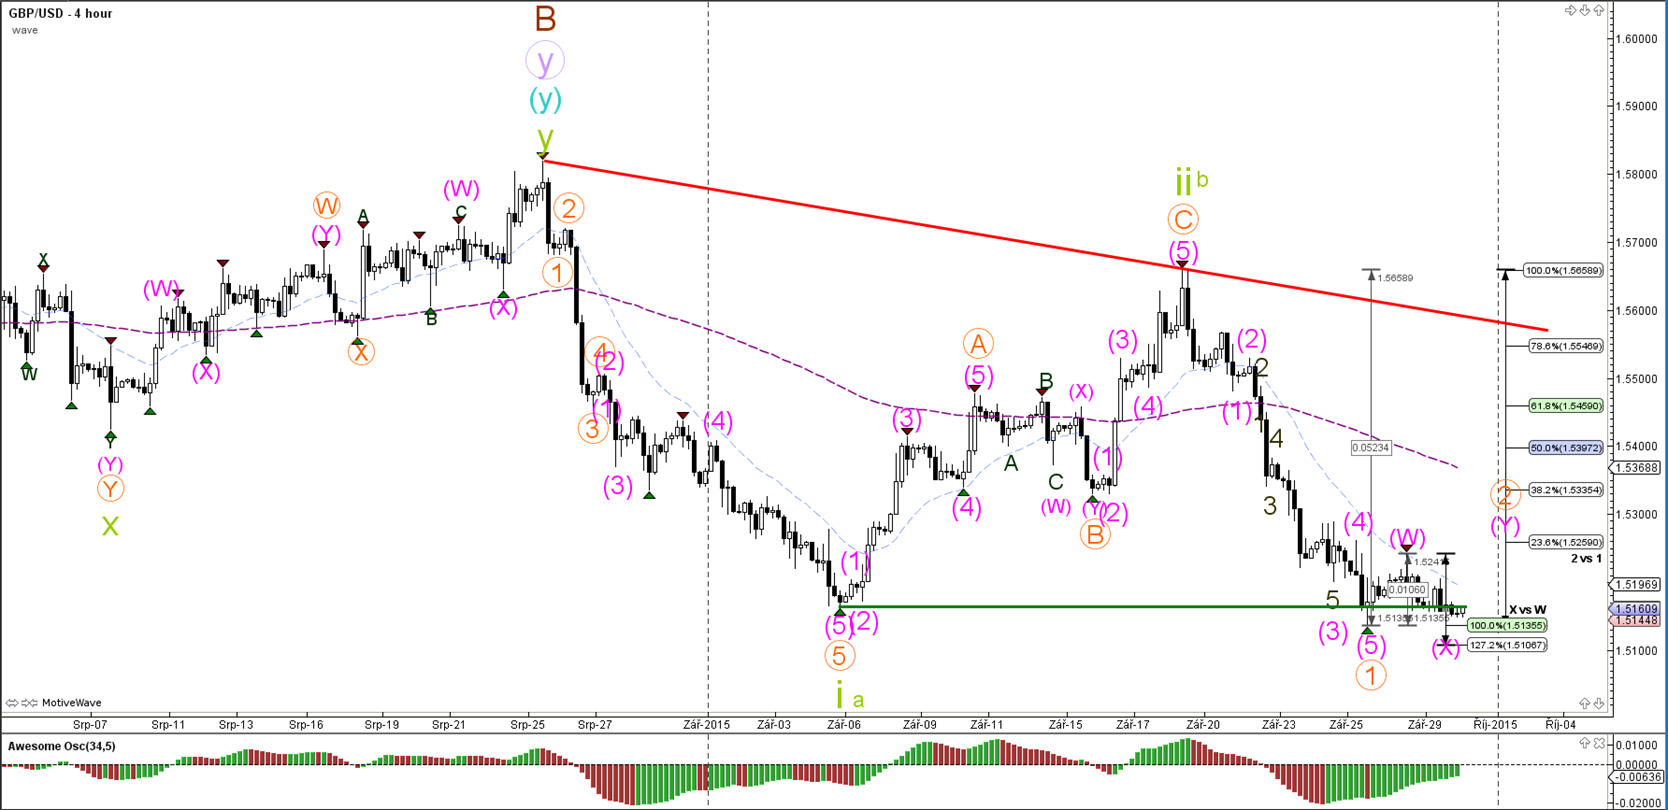
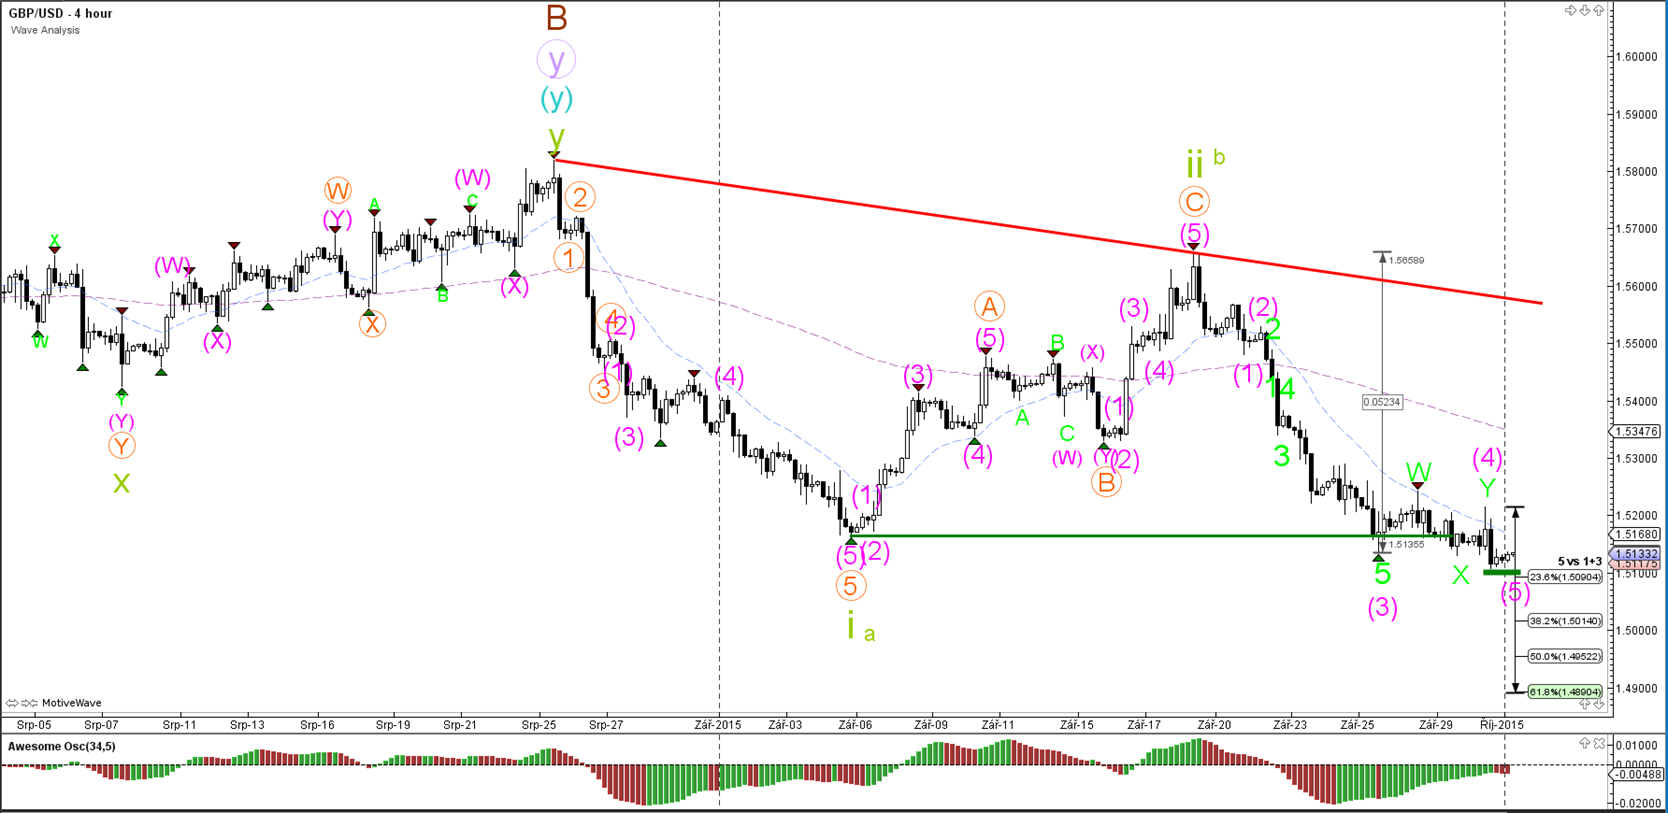
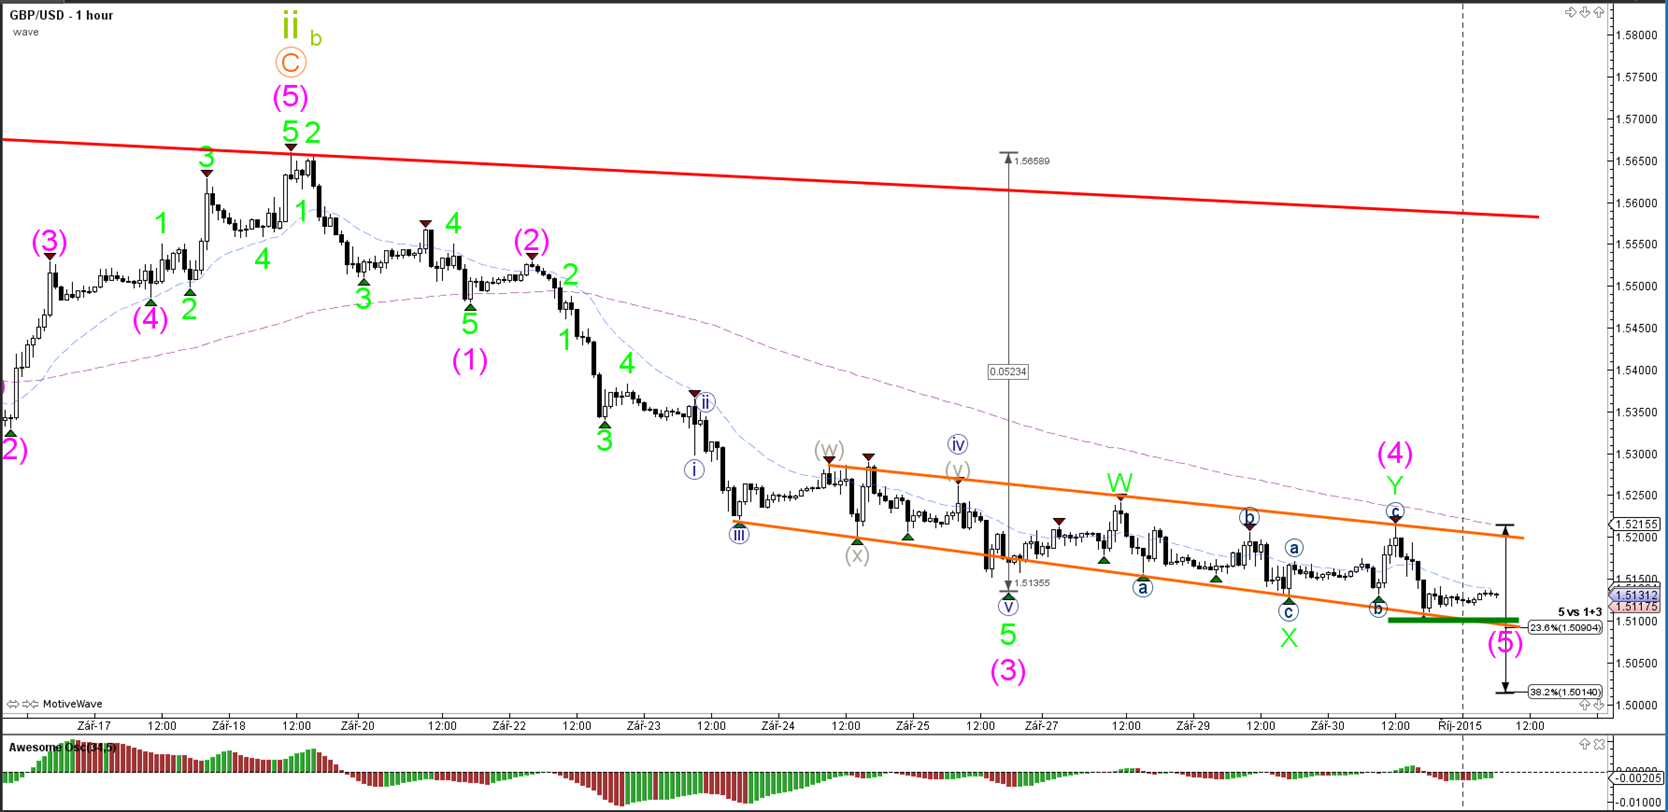
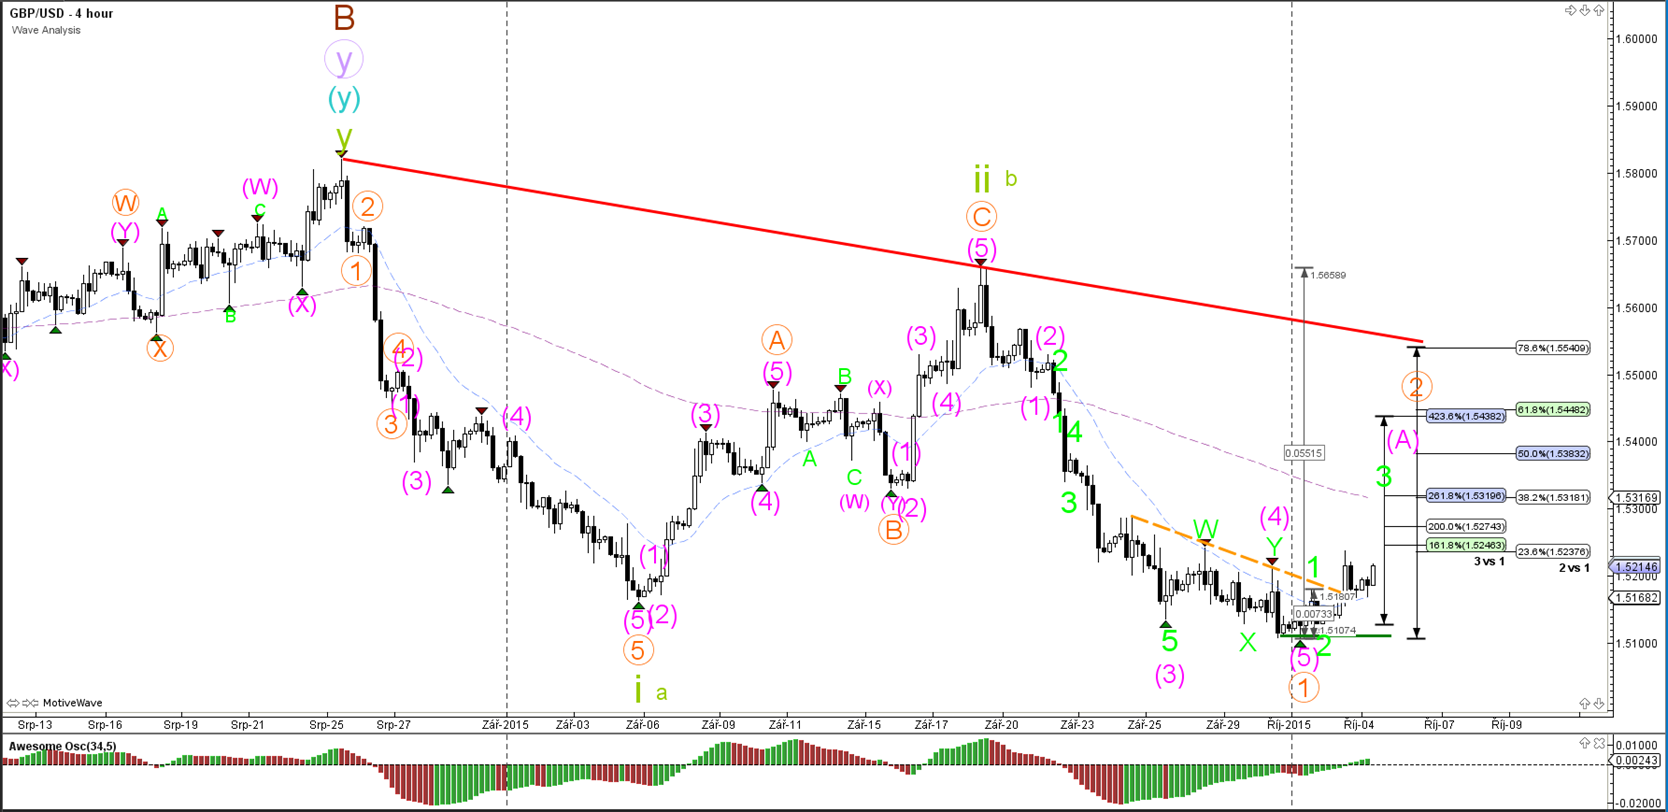
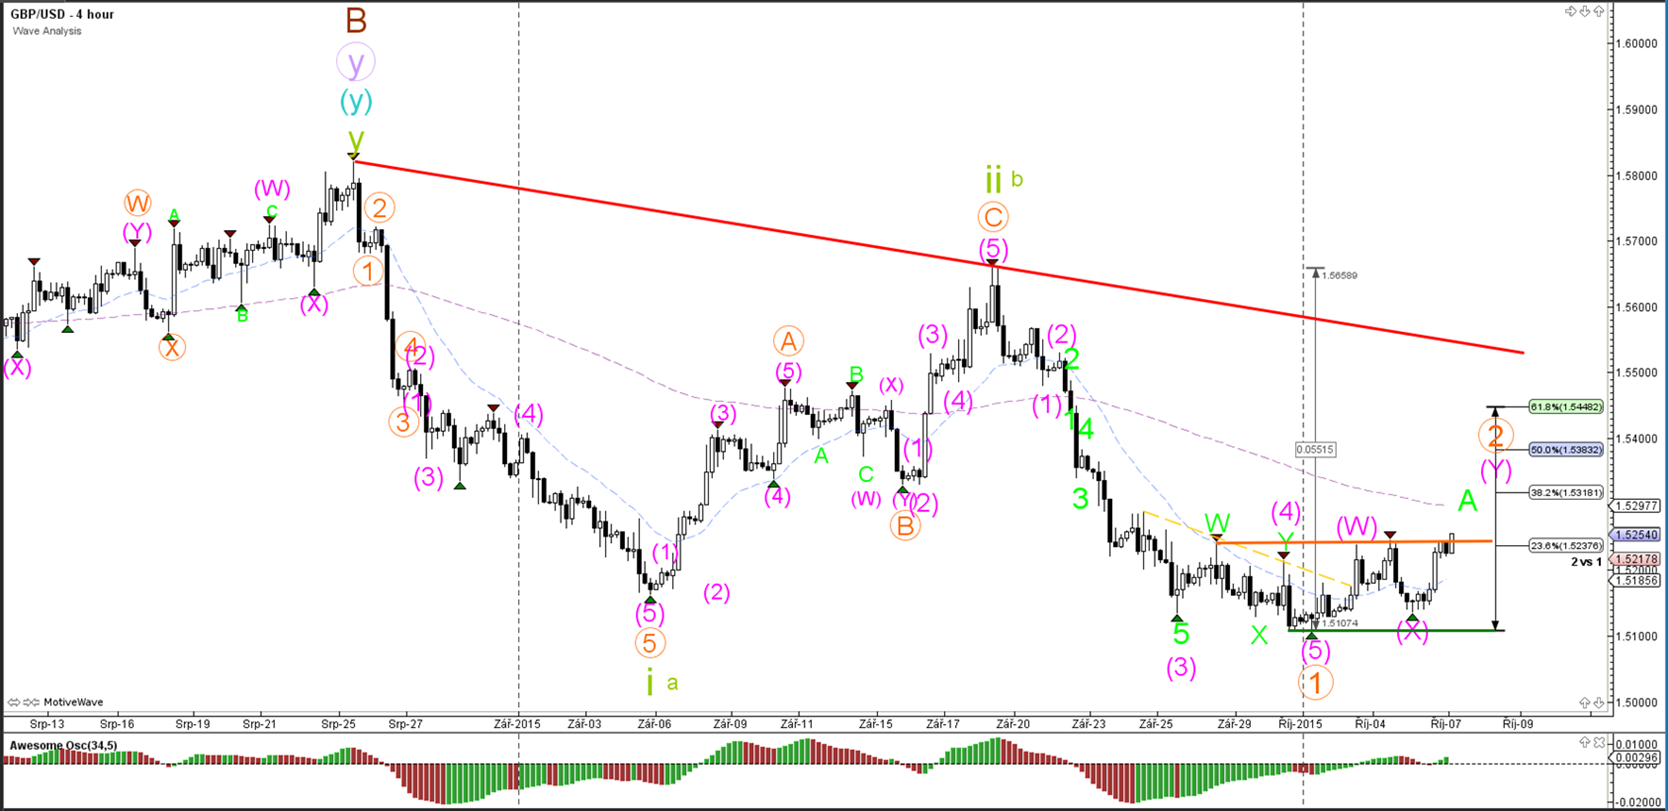
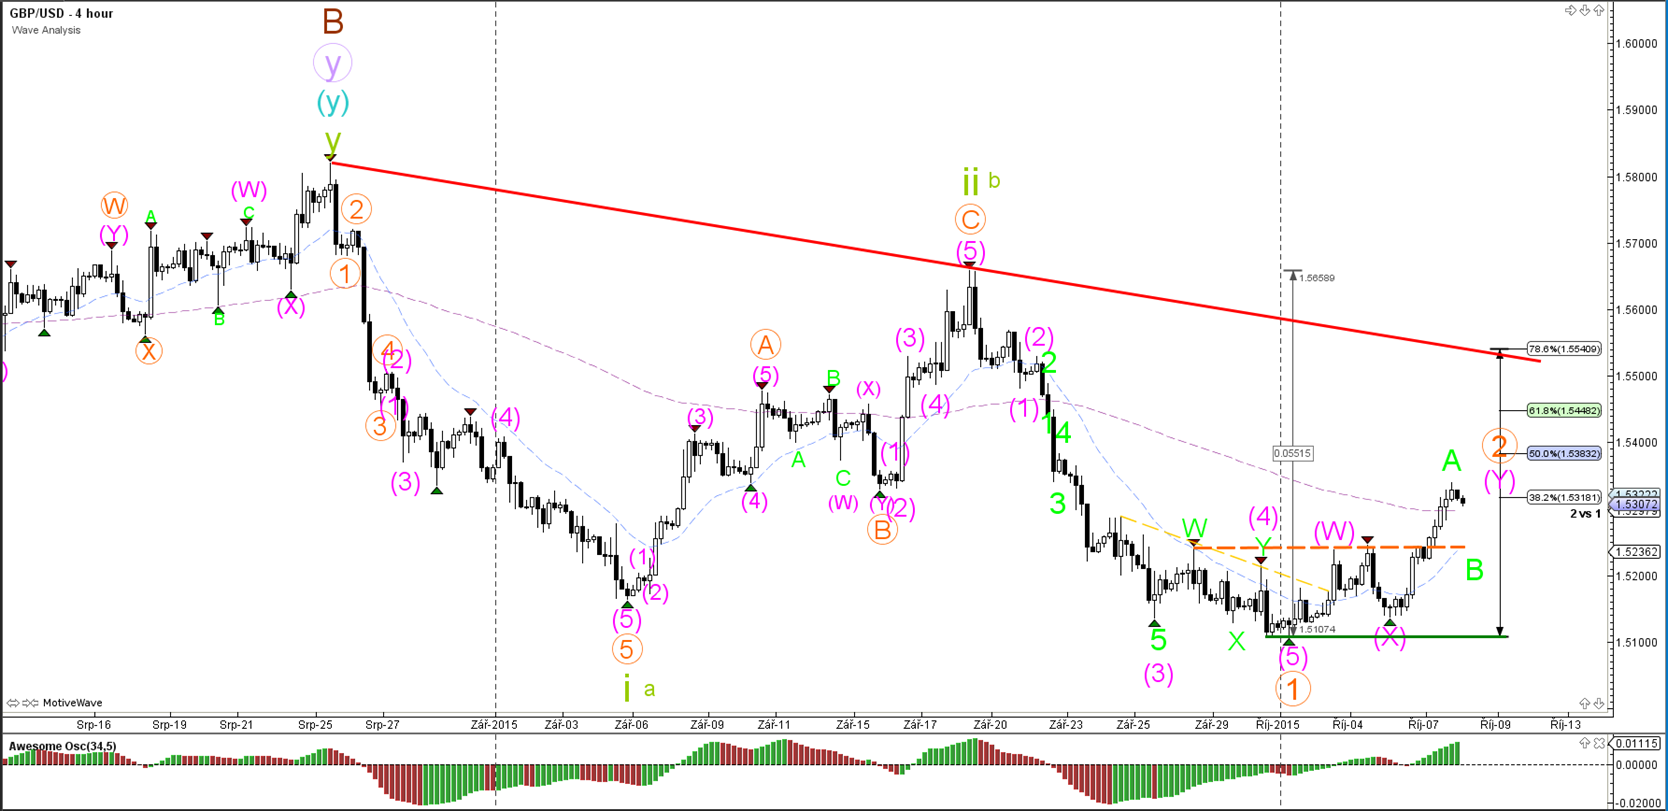
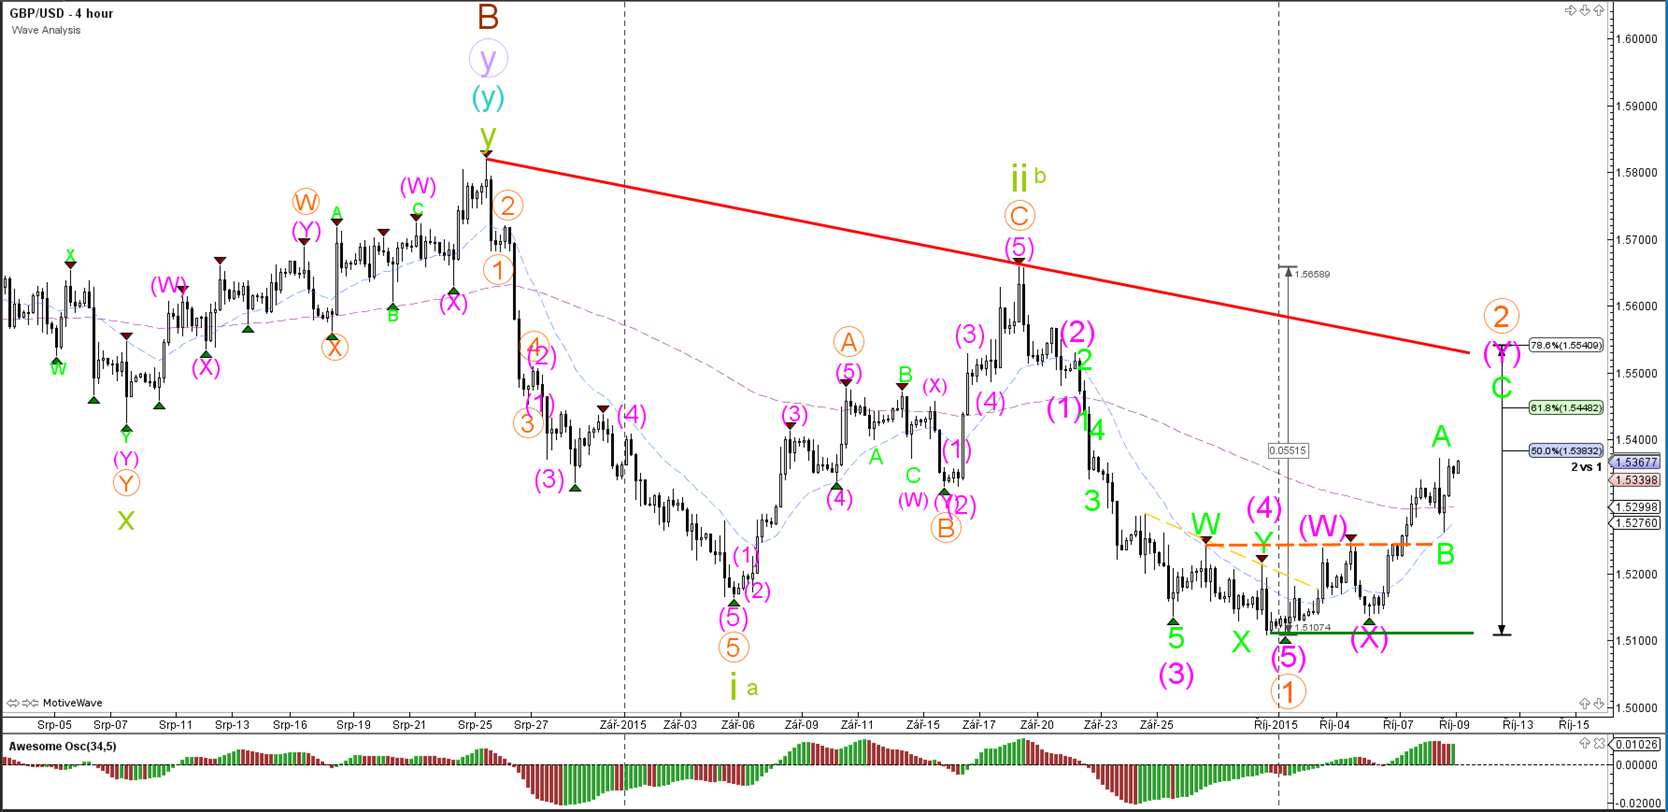
The GBP/USD is approaching the bottom support (green), which is a bounce or break spot. The current wave count is leaning towards a bounce as part of a WXY (pink) correction within wave 2 (orange).

1 hour
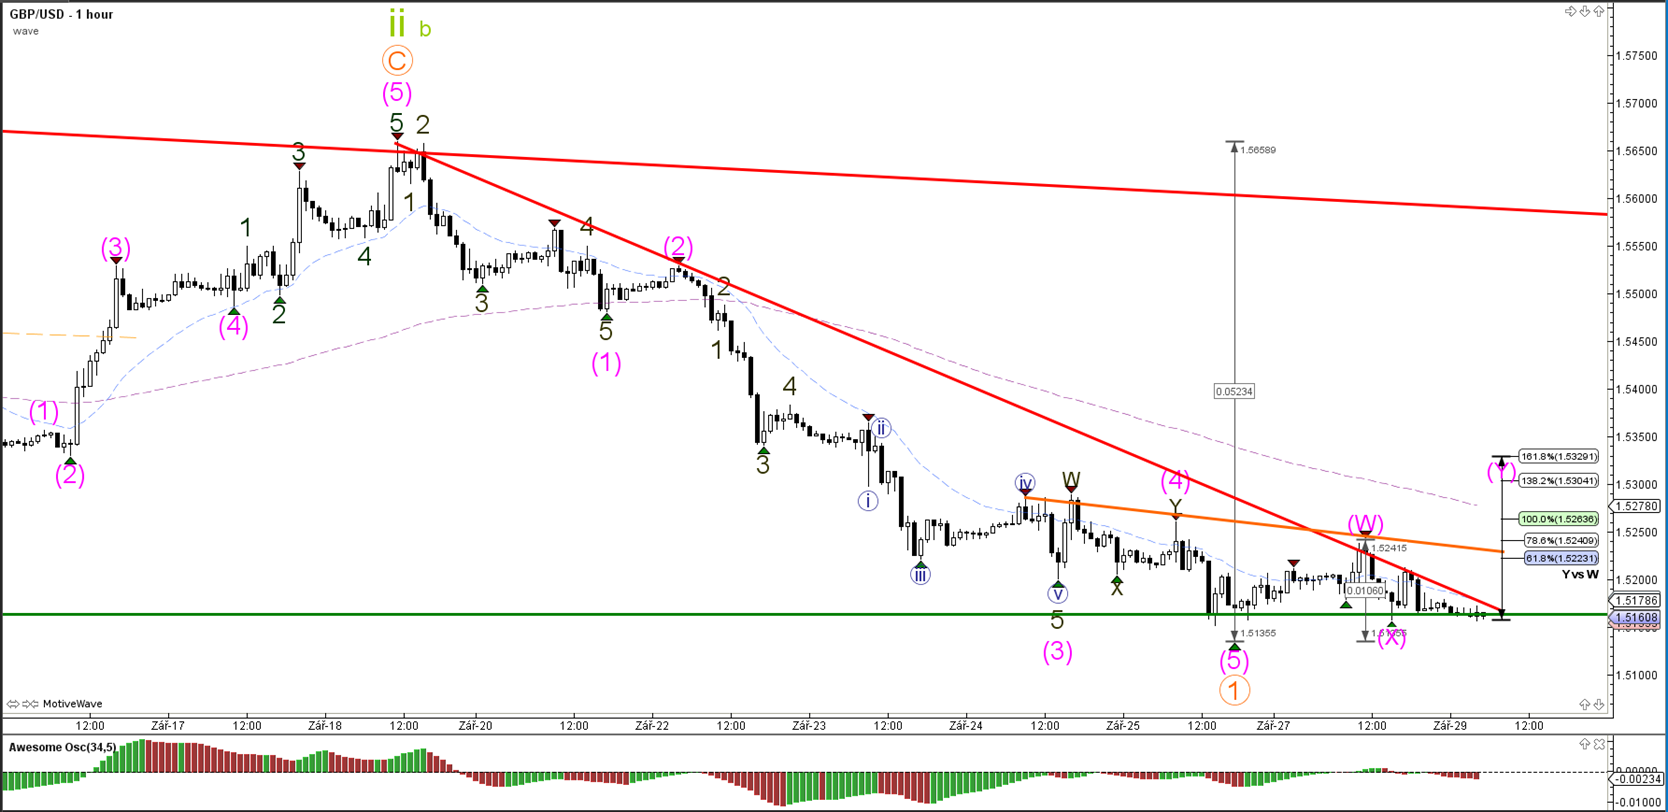


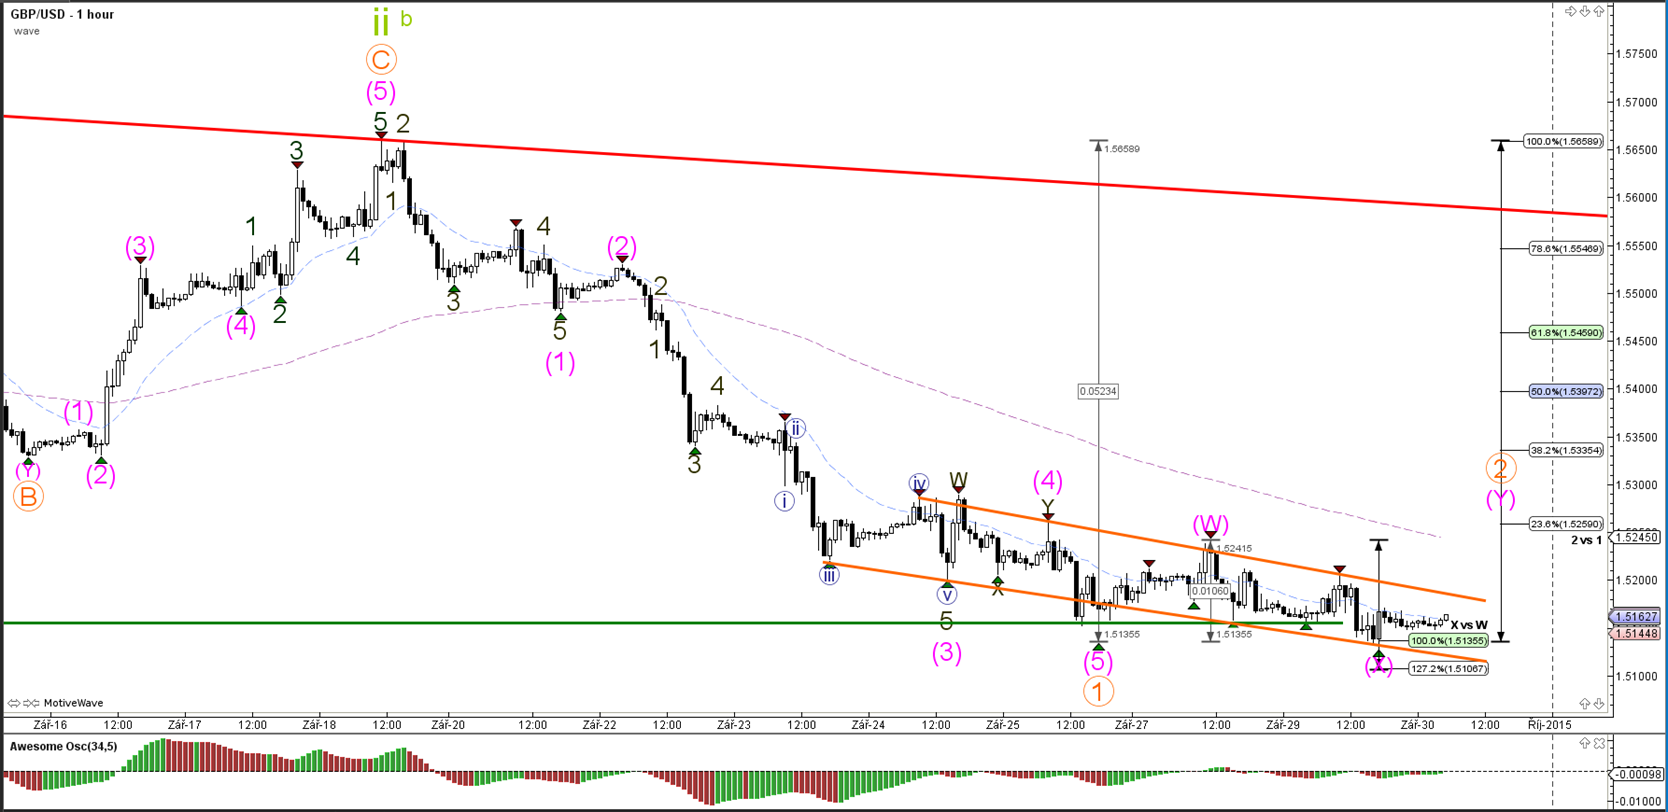
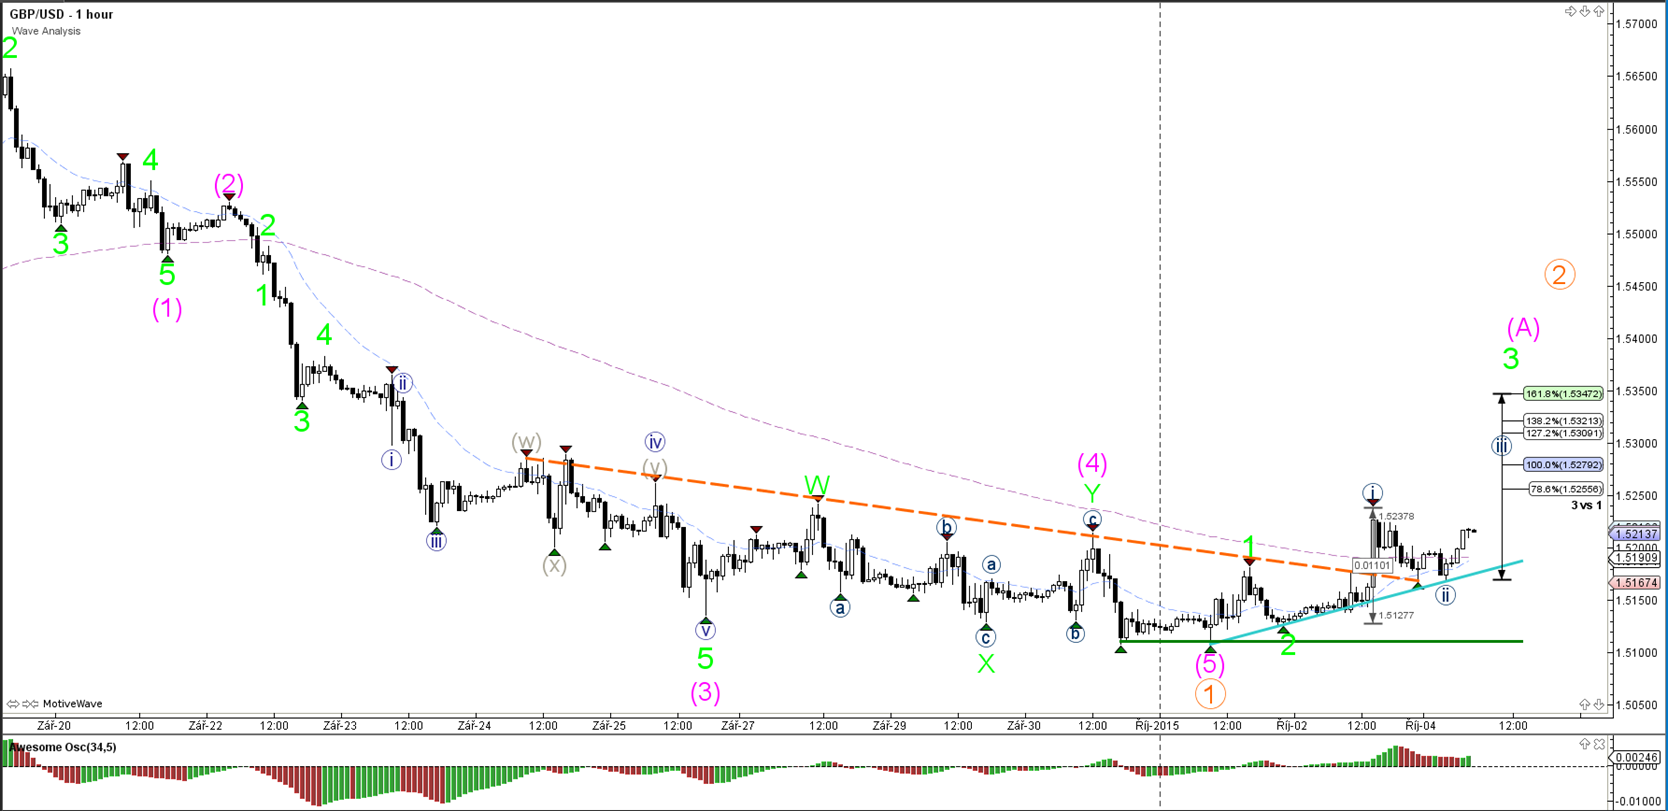
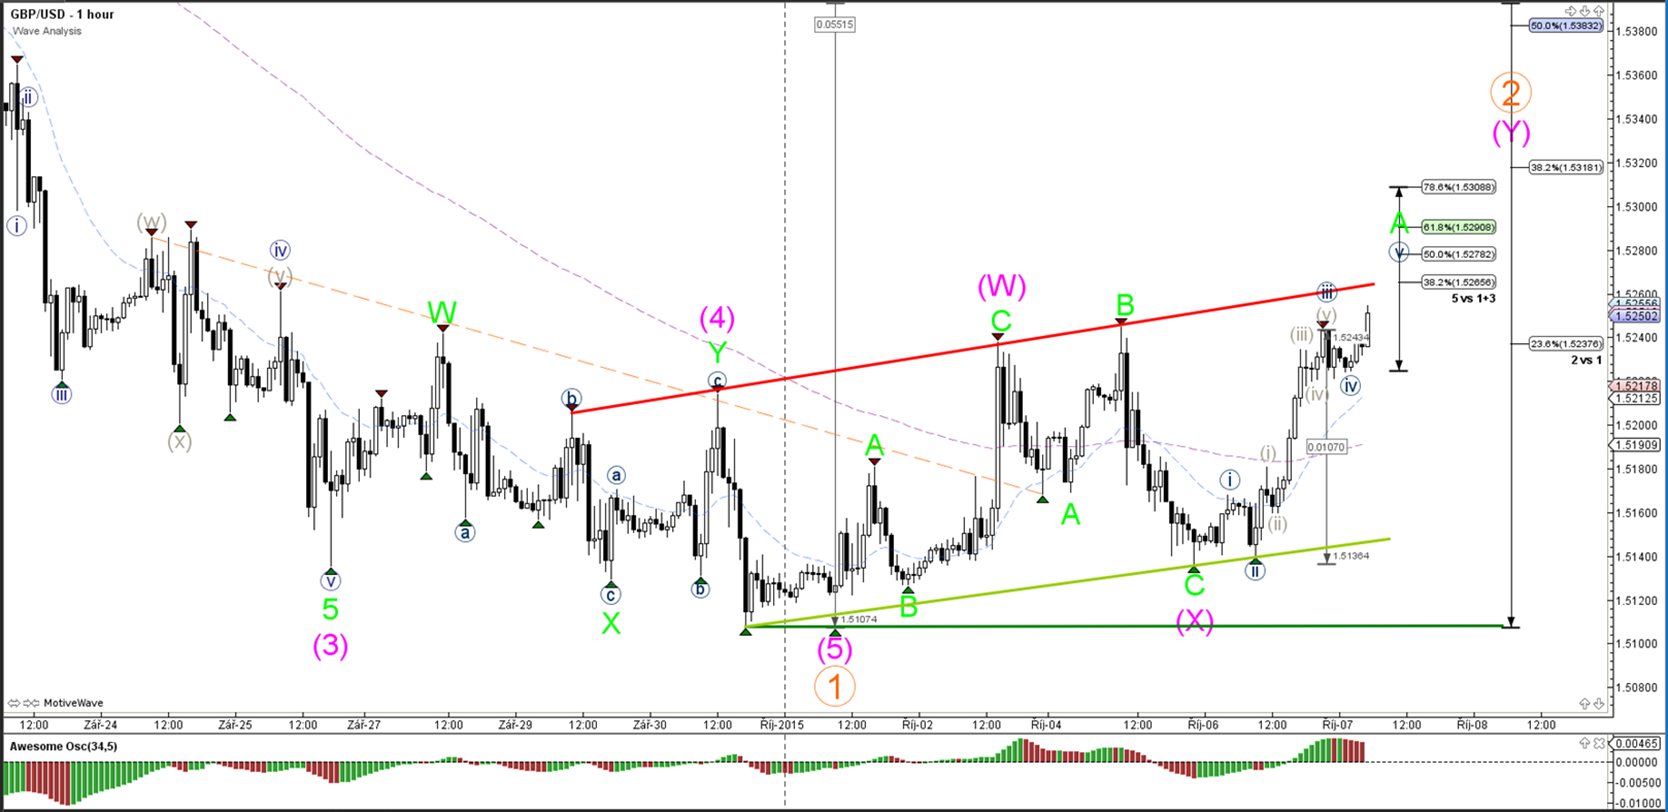
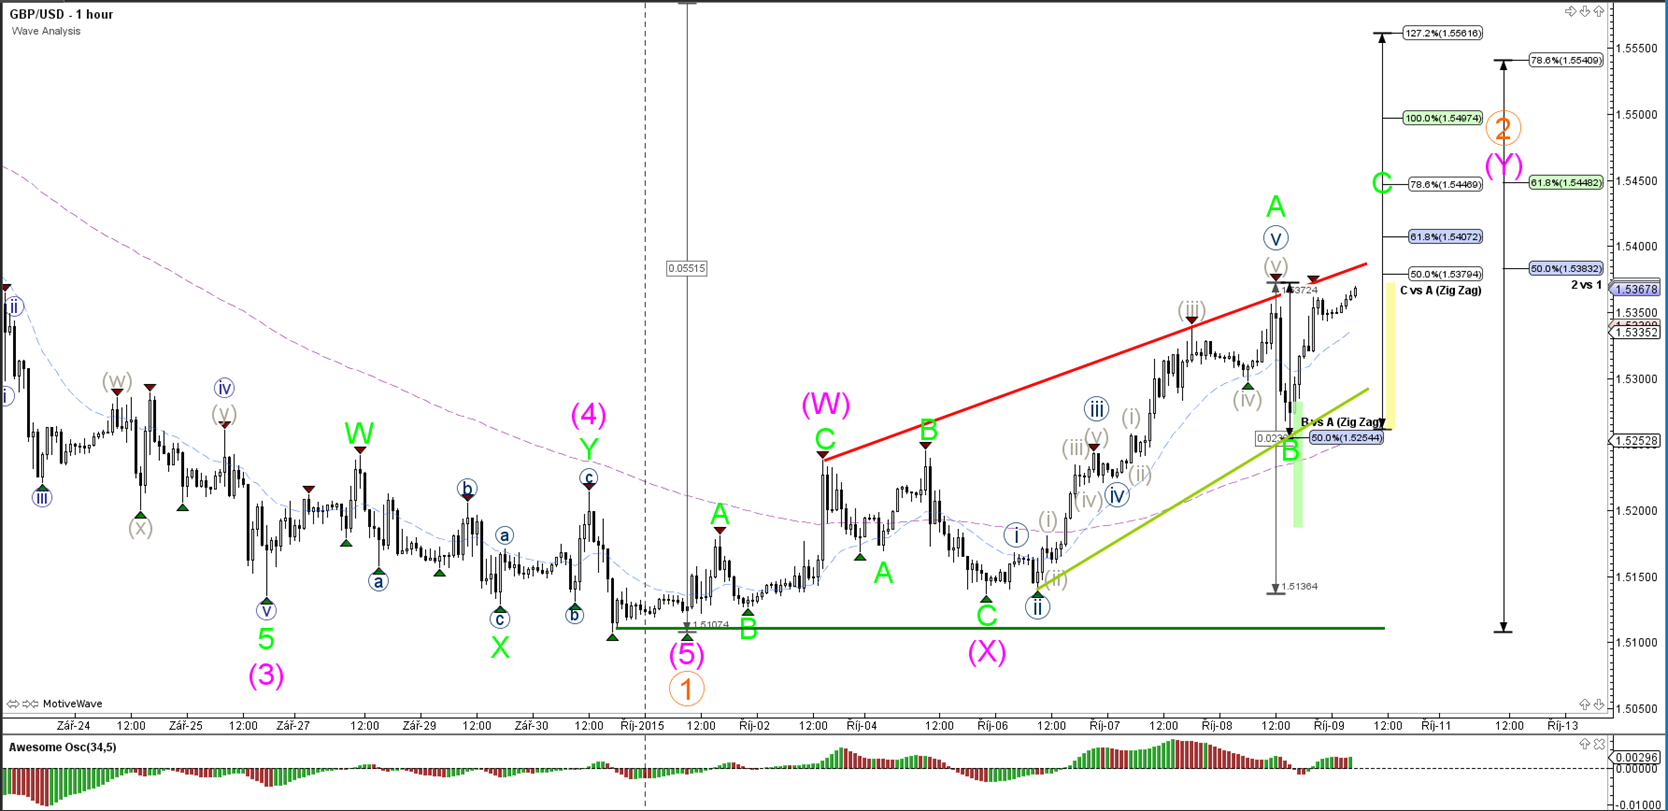
The GBP/USD is retesting the support level (green) for the 3rd time. A break below or above the lines could indicate the short-term direction.

USD/JPY

4 hour
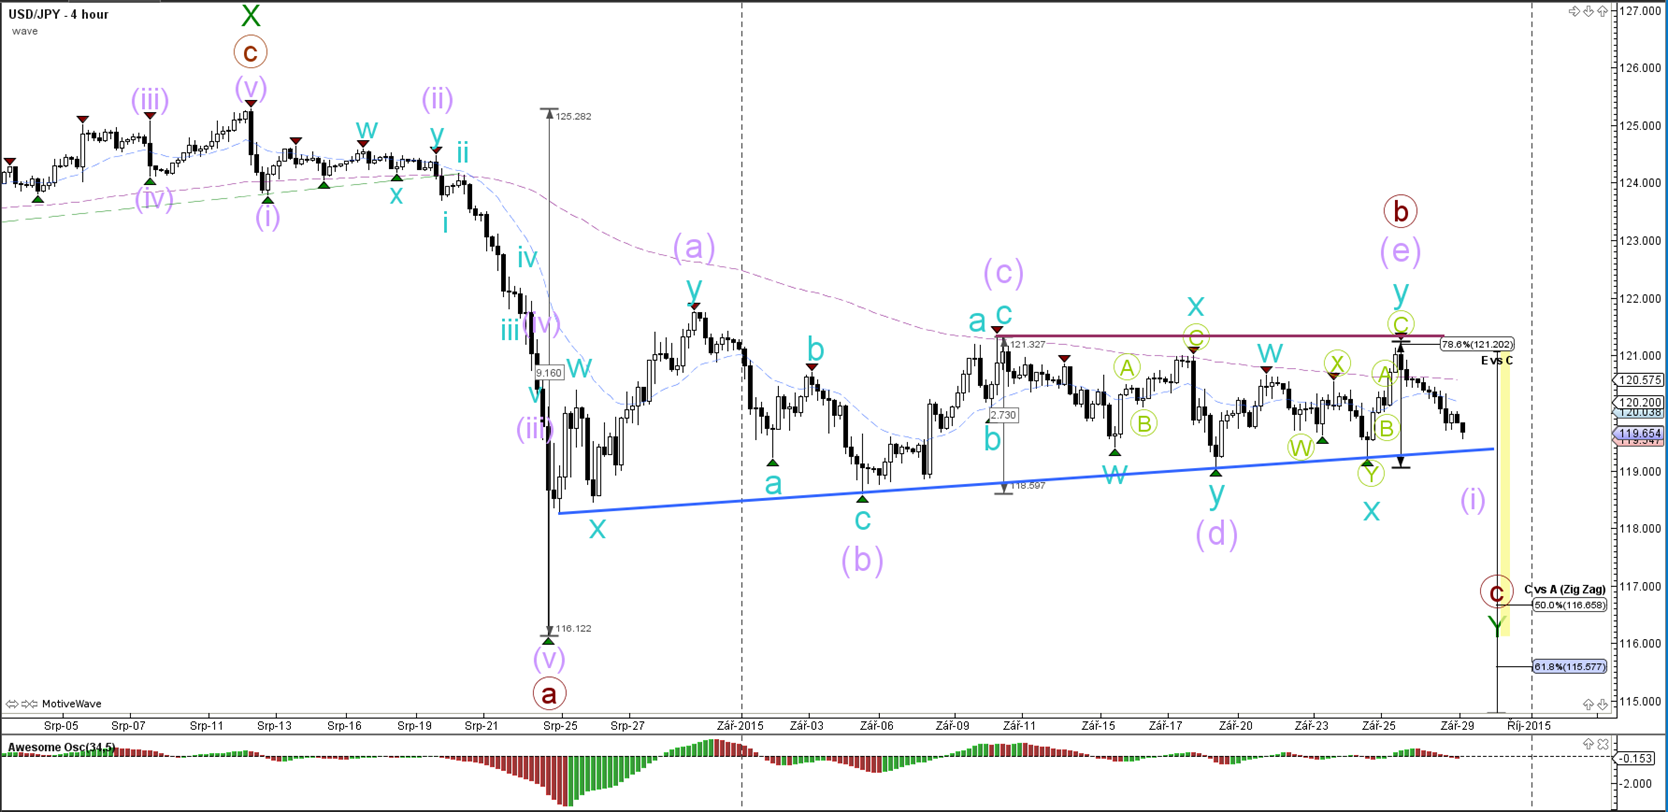


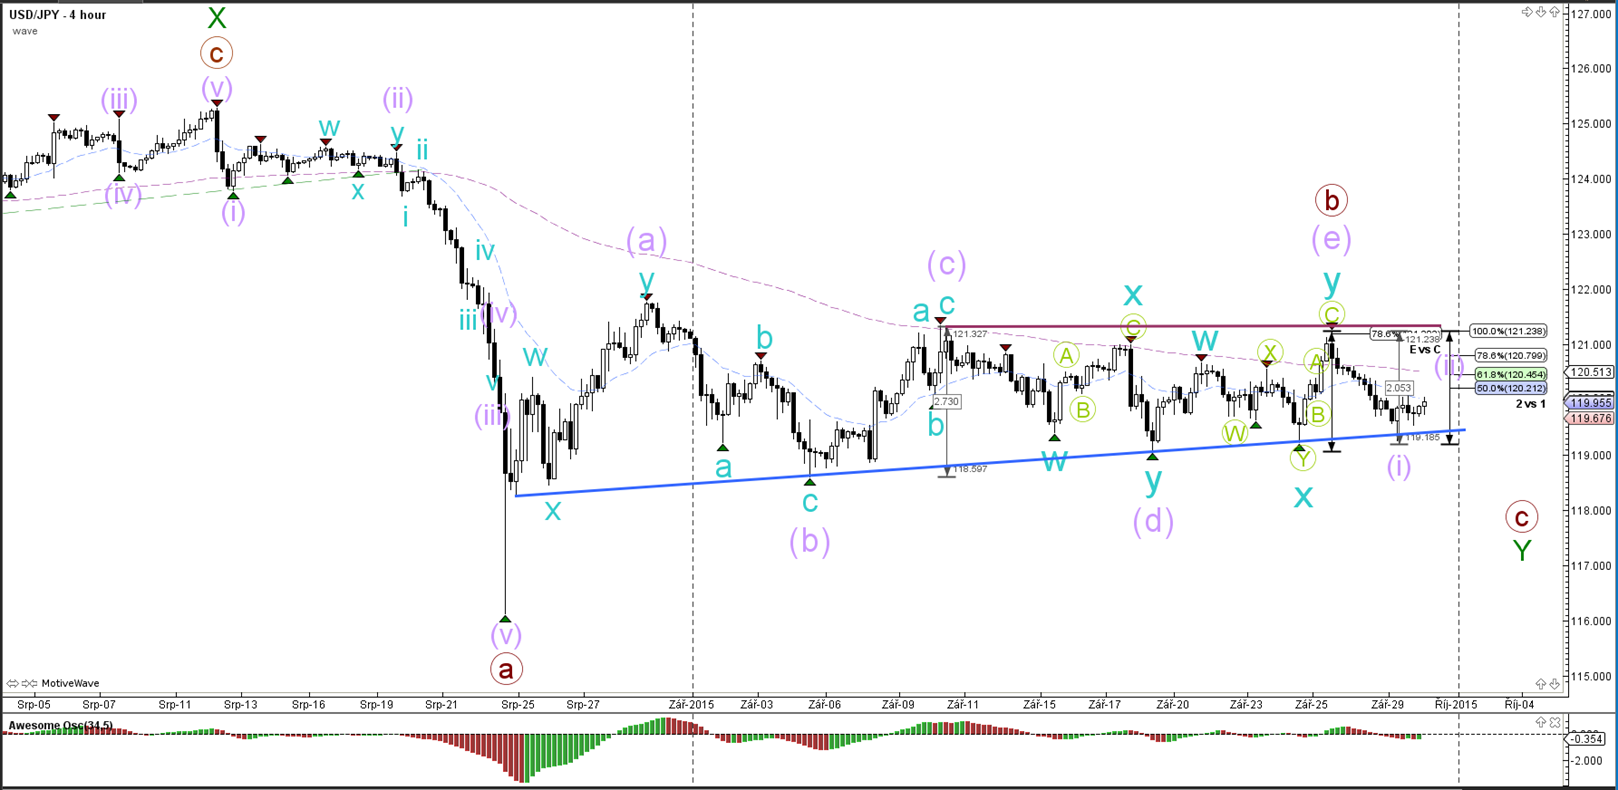
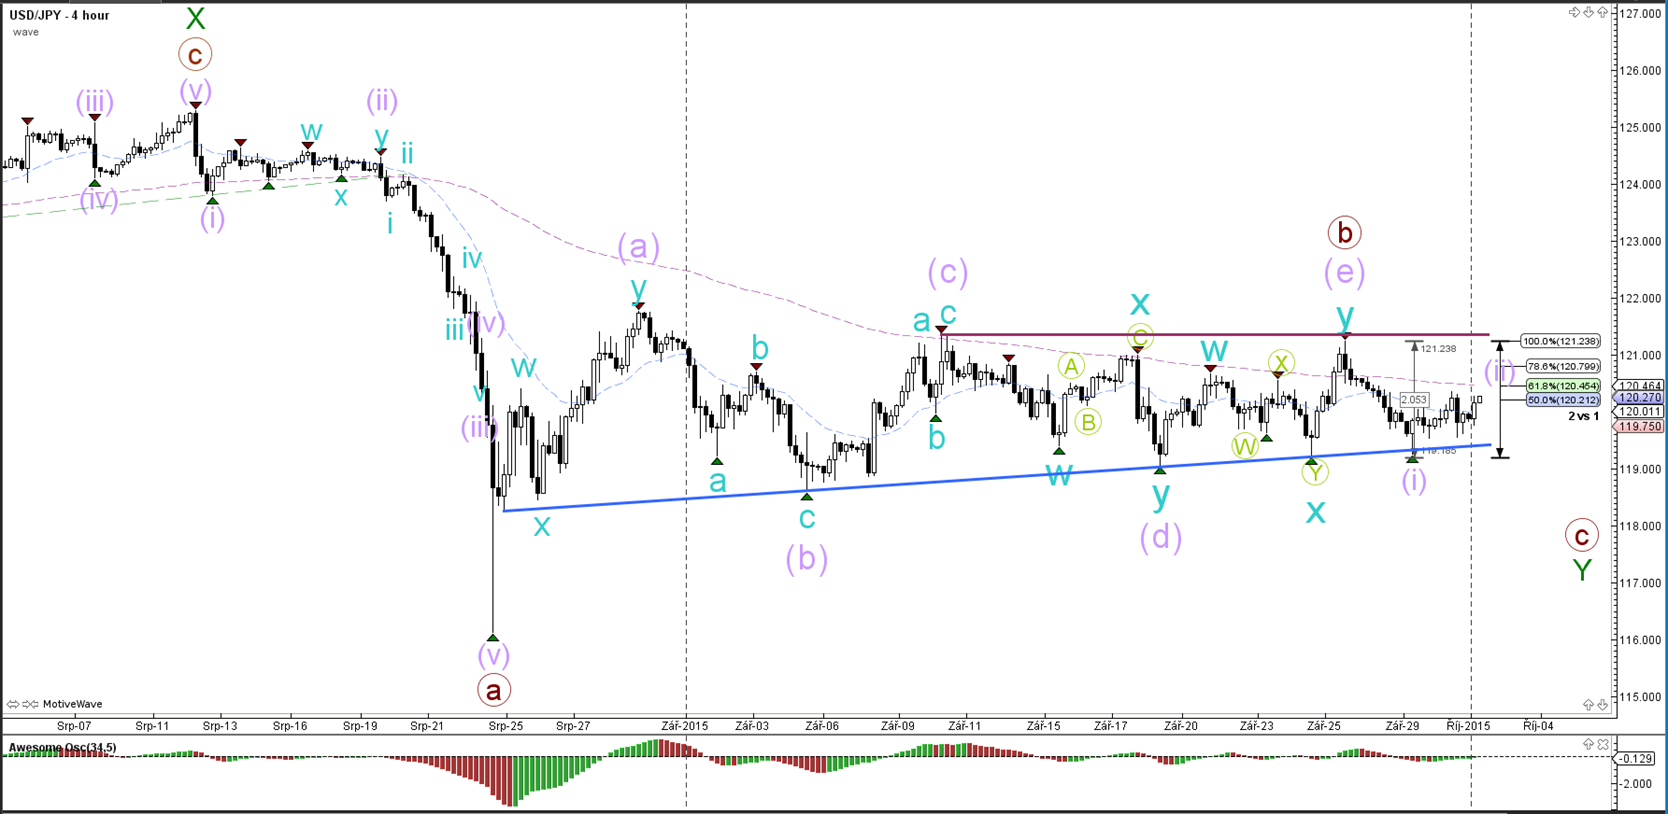
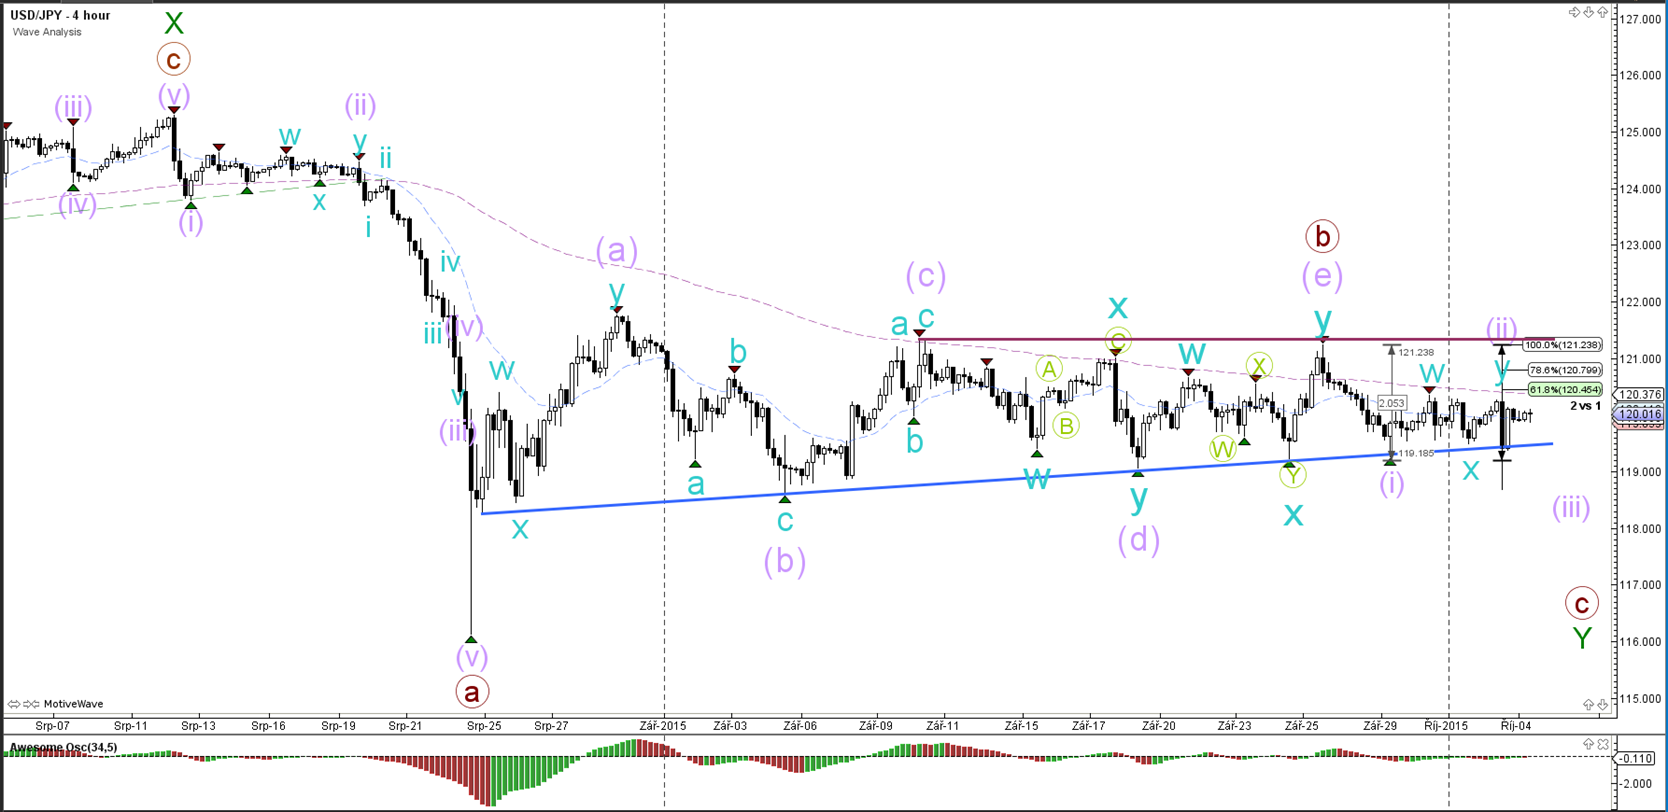
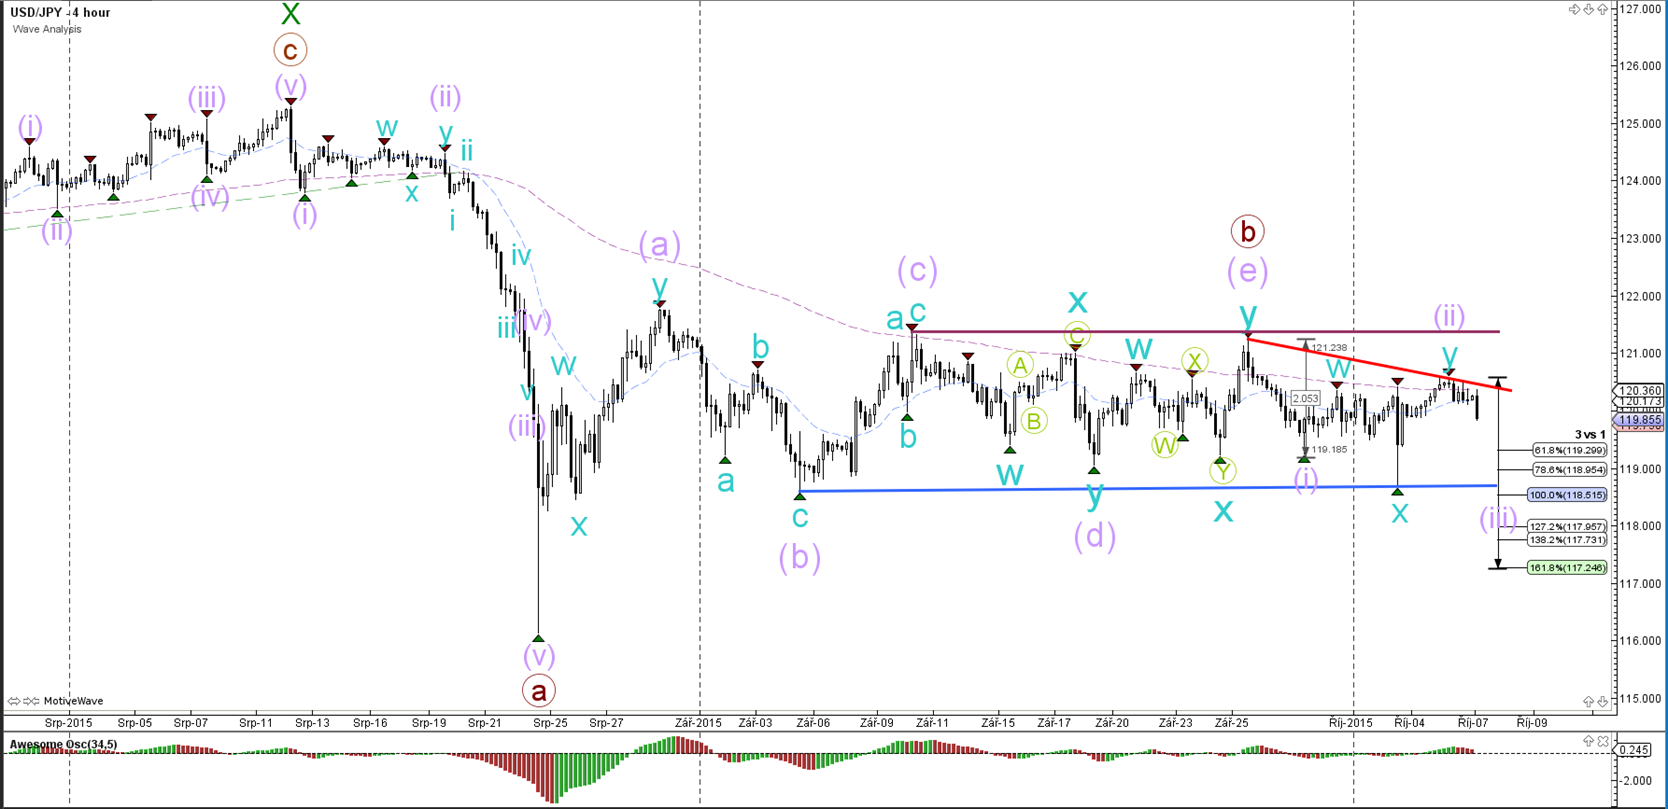
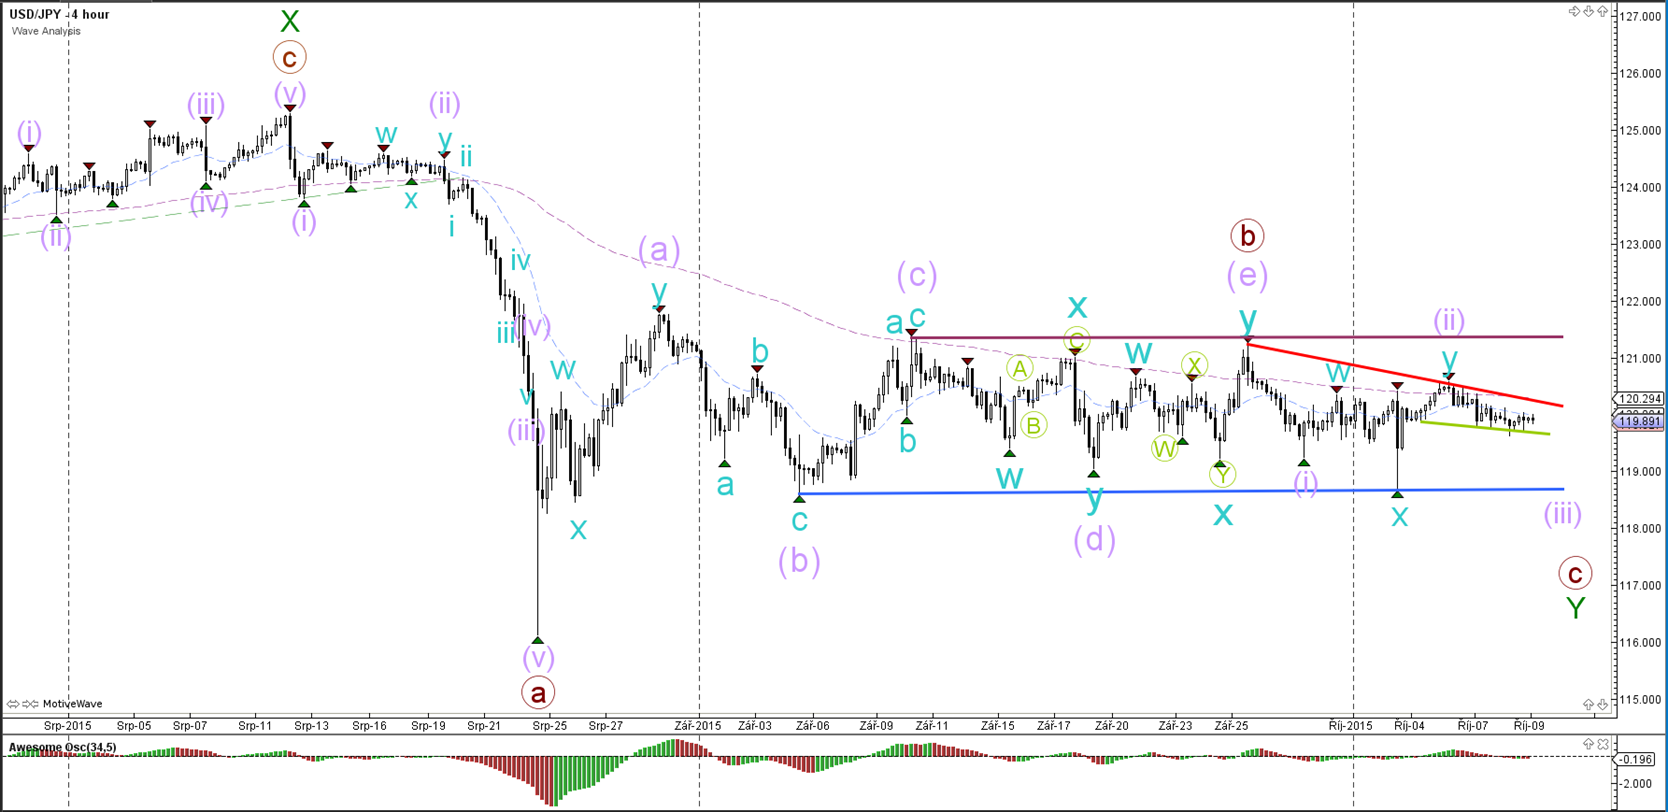
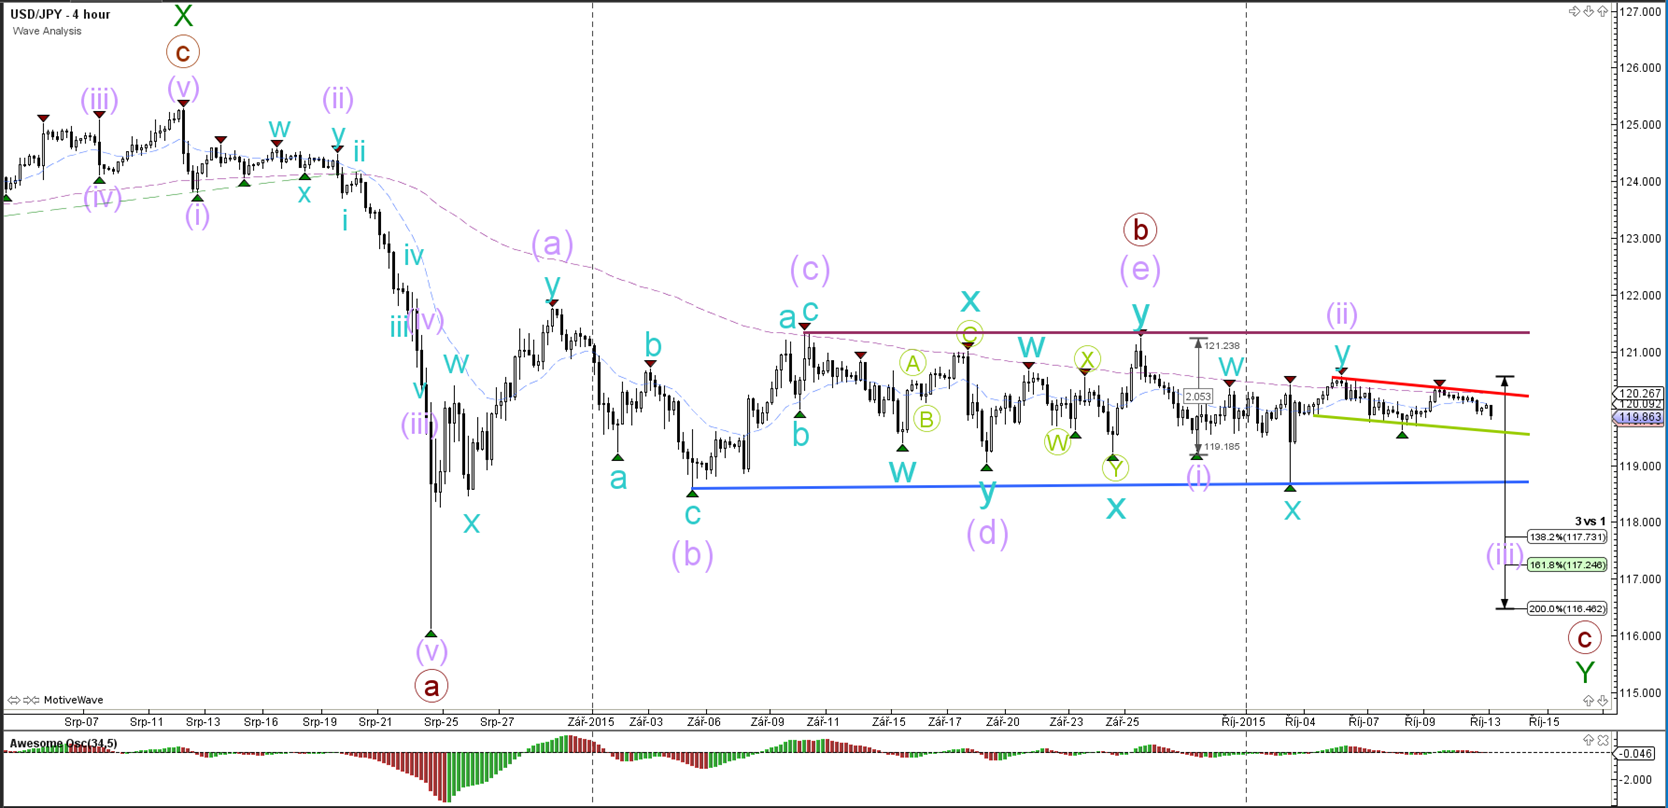
The USD/JPY has been moving down quickly since hitting the 78.6% Fibonacci level within the contracting triangle.


“Original analysis is provided by Admiral Markets
 
EUR/USD’s Bullish Correction within Bearish Wave 2

EUR/USD

4 hour


The EUR/USD is building a larger consolidation zone within the wave 2 (brown). The Fibonacci levels are resistance zones as part of wave 2 (brown) for a bearish continuation. A break above the top (100%) invalidates the 1-2 development whereas a break below support (green) could initiate the start of wave 3 or C (green).

1 hour


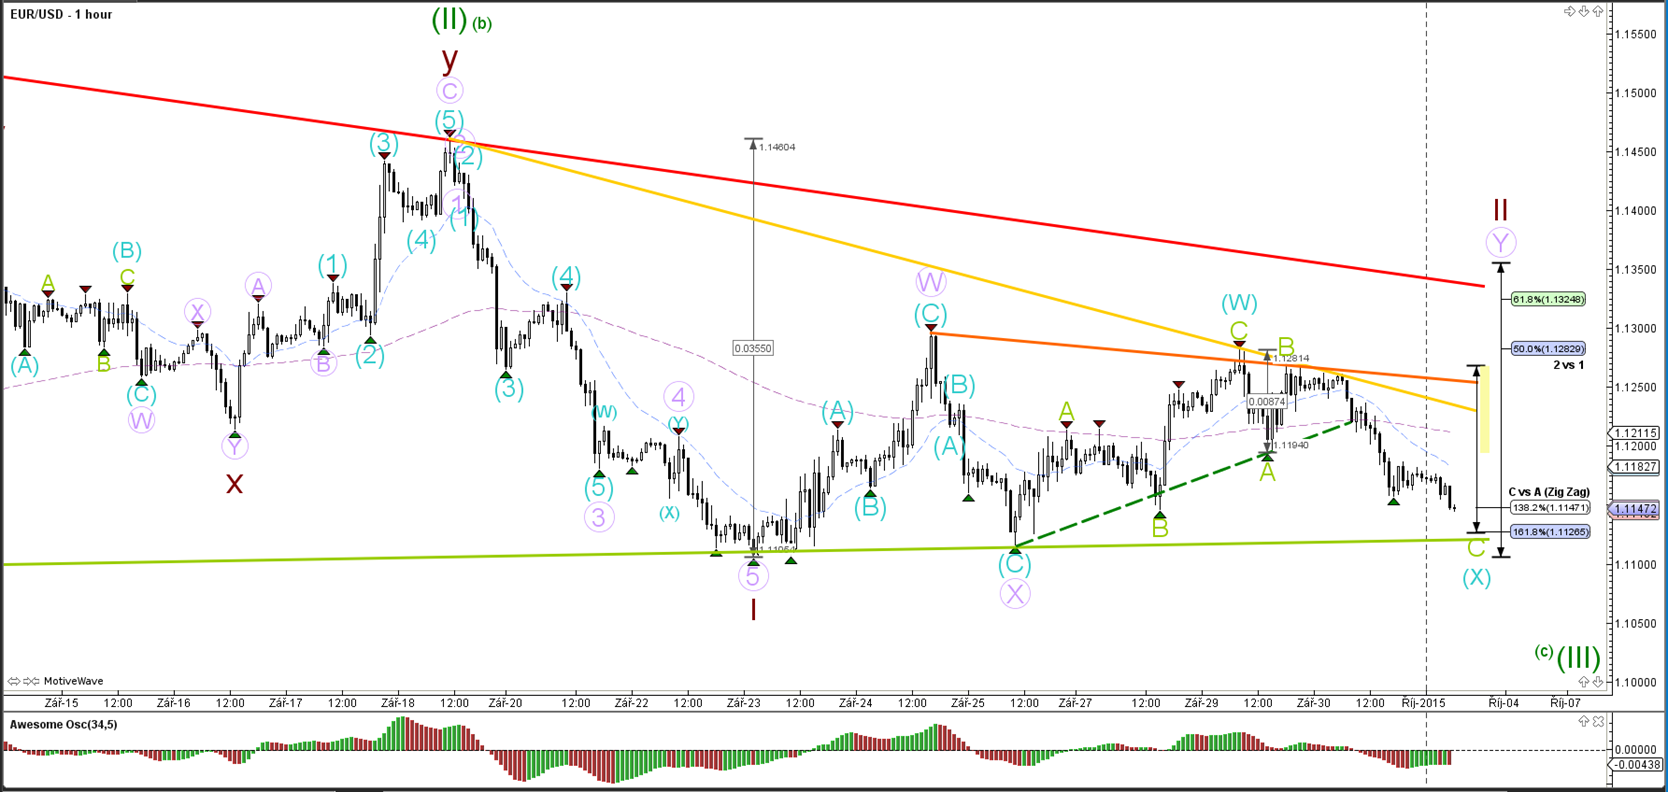
The EUR/USD showed a bearish movement yesterday from the 1.1275 resistance, which completed the bullish wave C(green movement). The EUR/USD is now in a bullish channel (green/yellow) with a potential to expand the correction via waves Y (blue/purple). A break below the support levels (green) could indicate the completion of wave 2 (green).

GBP/USD

4 hour


The GBP/USD has pushed slightly below the support level (green) but this price action has not invalidated the potential for a wave X (pink) as price stayed above the 138.2% (even above the 127.2%).

1 hour


The GBP/USD is in a bearish channel (orange lines). The direction of the breakout could give an indication of the short-term potential. A bullish break could start wave 2 (orange) whereas a bearish break below the 127.2/138.2% changes the wave count.

USD/JPY

4 hour


The current wave count of the USD/JPY contracting triangle is invalidated if price were to break above the C resistance point (purple trend line). A break below support could indicate the potential for a 3rd purple wave.


“Original analysis is provided by Admiral Markets
 
USD/JPY’s Massive Contracting Triangle Reaching Completion

EUR/USD

4 hour


A break below support (green) could initiate the start of wave 3 or C (green). For the moment I have the current bearish price movement marked as a wave X (blue) within wave 2 (brown), but a bearish break would change the wave count to a bearish impulse as part of wave 3/C (green).

1 hour


The EUR/USD could be making an ABC (green) zigzag correction within wave X (blue) but is vulnerable to change into a 123 when price pushes below the 161.8% Fib target and support tend line (green).

GBP/USD

4 hour


The GBP/USD is showing very choppy price action at the previous bottom (green). The choppiness could be part of a prolonged wave 4 (pink).

1 hour


The GBP/USD break below 1.51 and the bearish channel (orange) could indicate the potential for a breakout towards the Fibonacci targets and an extension of wave 5 (pink). A break above the channel could mean the completion of wave 5 (pink) at the recent bottom.

USD/JPY

4 hour


The bearish contracting triangle is invalidated if price breaks above the C (purple) resistance point (purple trend line). A break below support (blue) could indicate the potential for a 3rd wave (brown).


“Original analysis is provided by Admiral Markets
 
EUR/USD and GBP/USD Build Bullish Momentum

EUR/USD

4 hour


The EUR/USD bounced at the trend line (green) for a wave X (blue) and rallied during NFP up to the resistance trend line (red) and 61.8% Fibonacci target.

1 hour


The EUR/USD showed an ABC rally (green) and respected the Fib level neatly. If the wave 2 (brown) correction is completed, then this could indicate the start of wave 3 (brown). A break below the support (green) confirms that development.

GBP/USD

4 hour


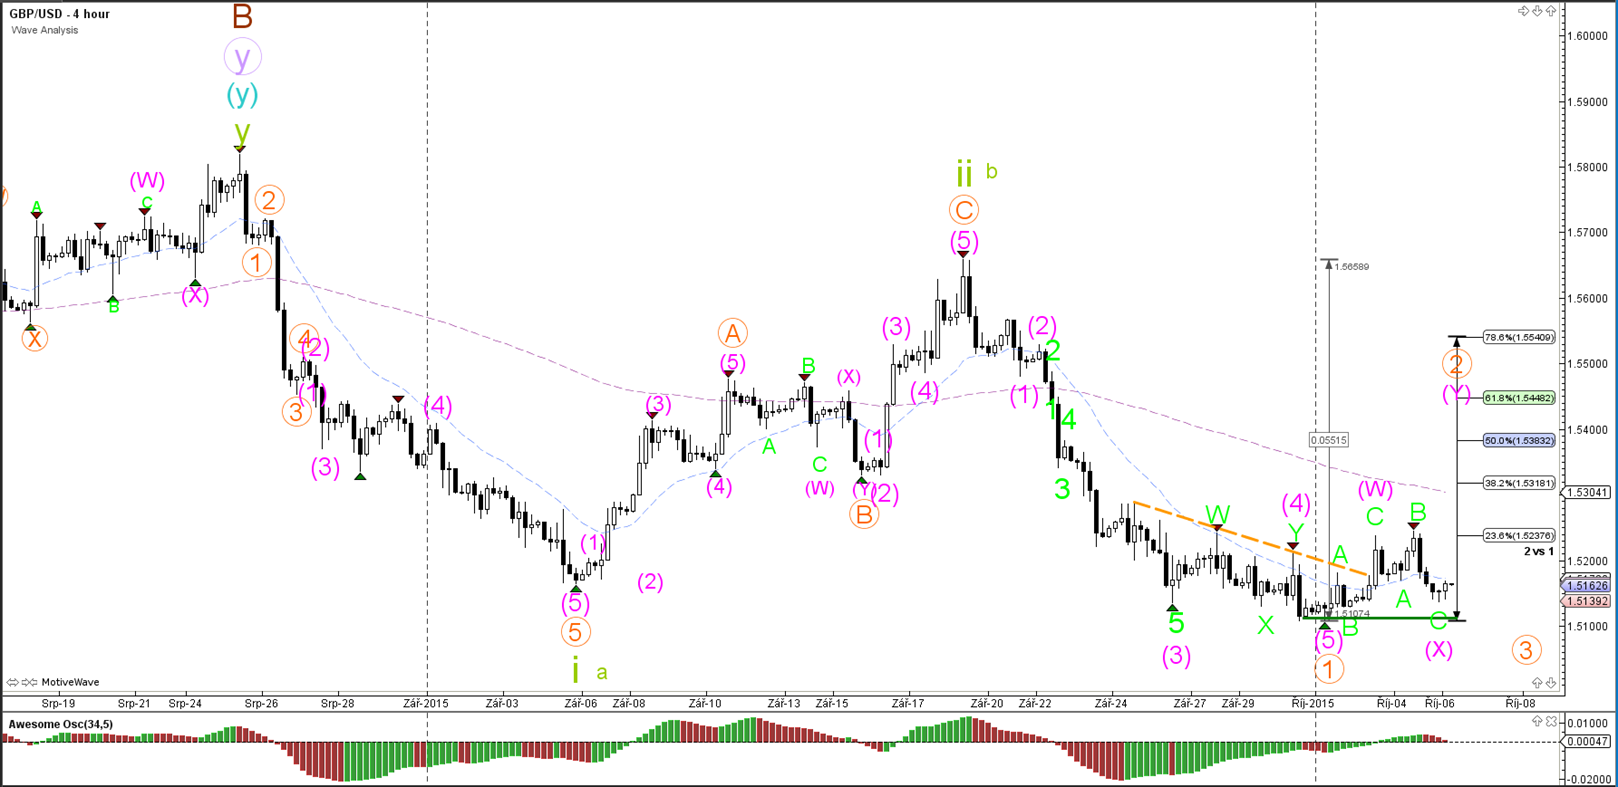
The GBP/USD broke above the resistance trend line (orange dotted) which could indicate the start of a wave 2 correction (orange).

1 hour


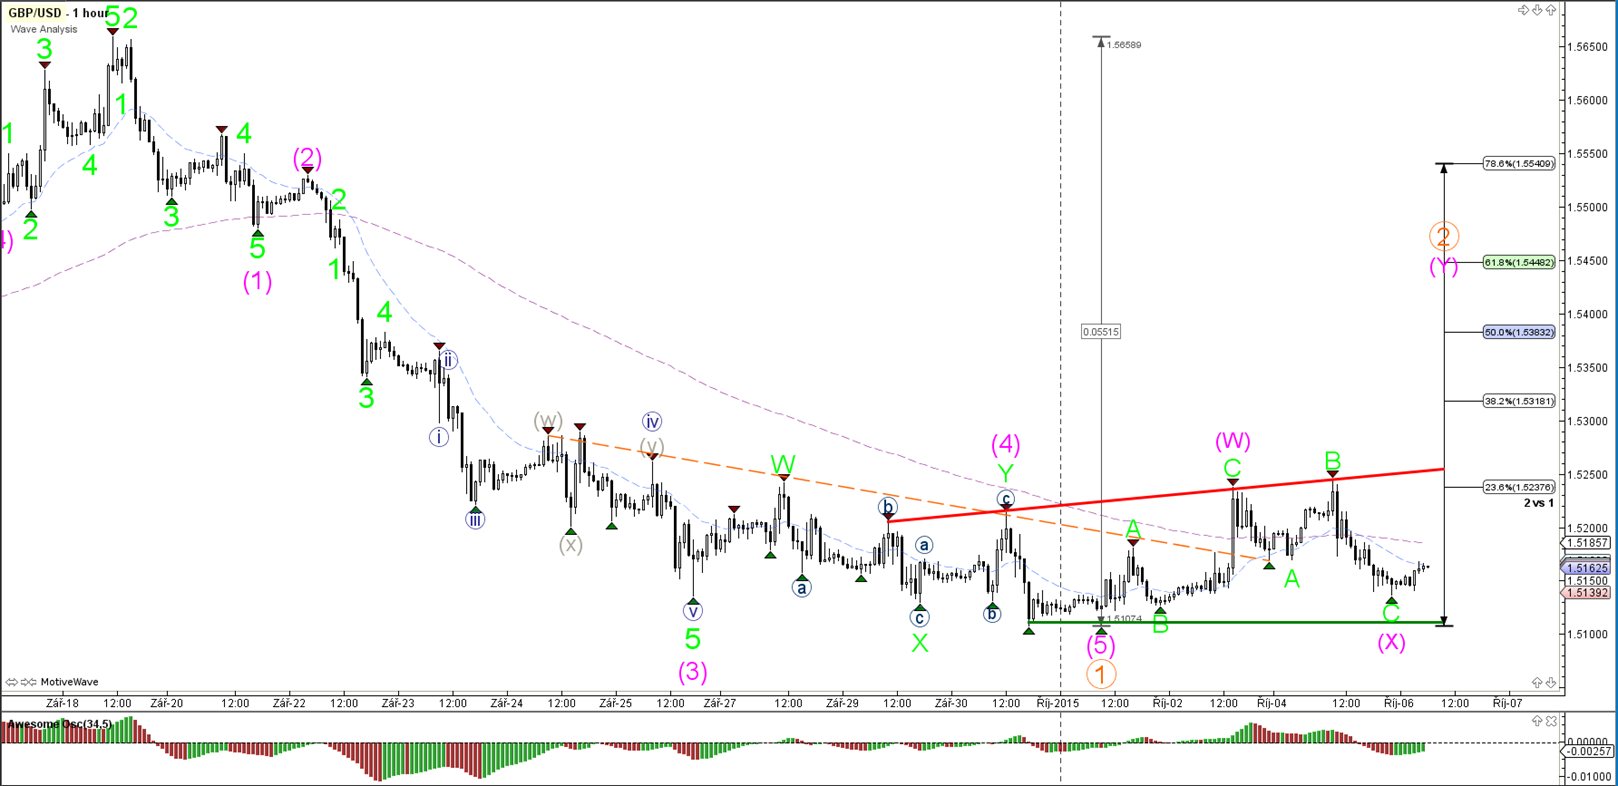
The wave count within the wave 2 (orange) will most likely turn out to be an impulsive ABC correction (pink). So far the waves could indicate two deeper wave 2 pullbacks (green/blue).

USD/JPY

4 hour


The USD/JPY broke the support trend line and bottom of the triangle (blue) during the NFP event but quickly reverted back into the triangle zone, which is making the breakout look questionable.


“Original analysis is provided by Admiral Markets
 
Triangle Formations Prove Robustness in Forex Majors

EUR/USD

4 hour


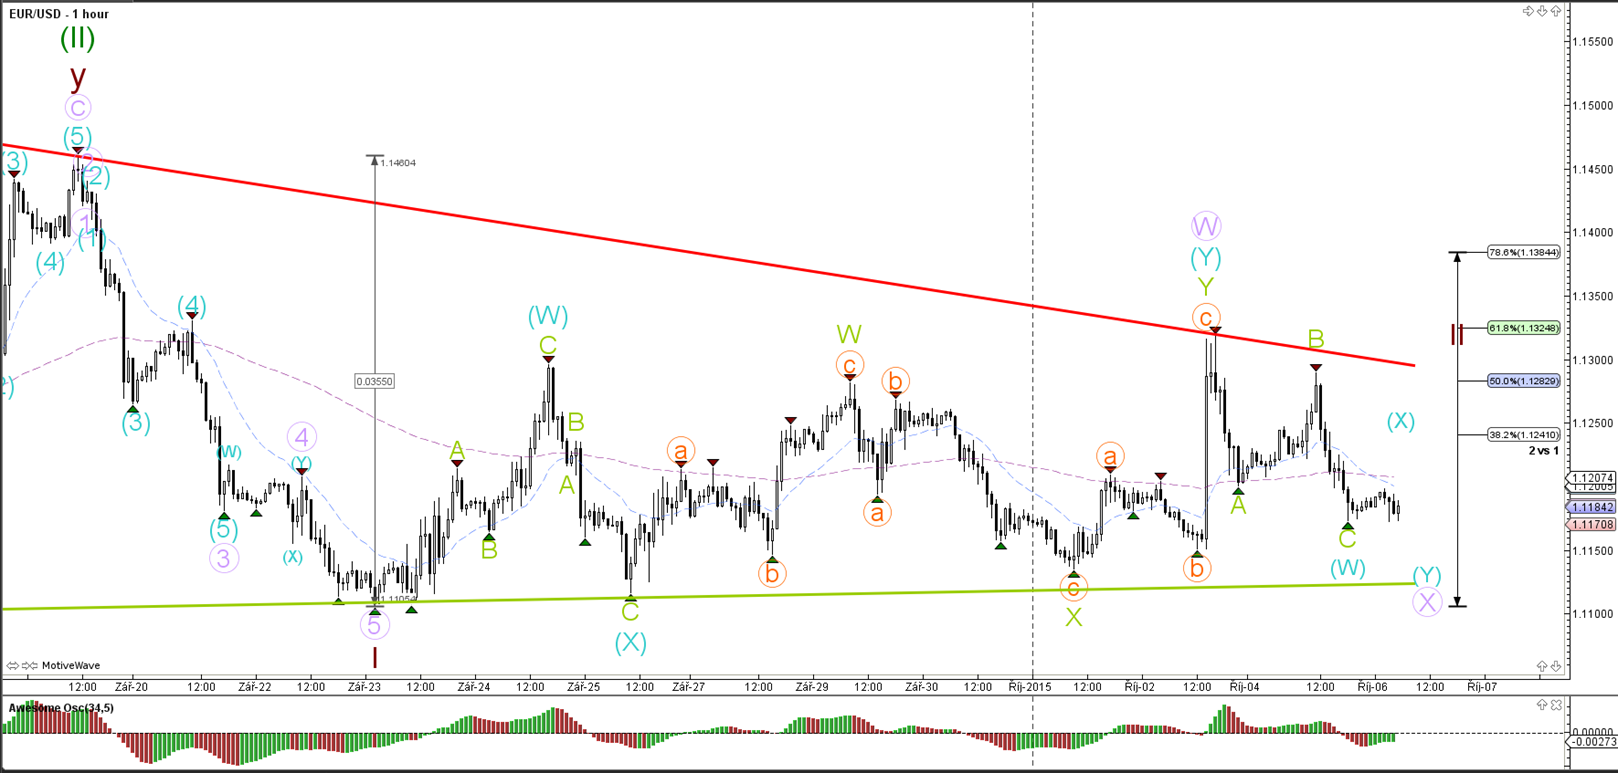
The EUR/USD is expanding the wave 2 (brown) correction unless price is able to break away from the current average and sideways zone.

1 hour


The EUR/USD price action remains stuck in between support (green) and resistance (red) trend lines, which is now becoming a contracting triangle. A break below support is needed before wave 2 (brown) could be considered completed.

GBP/USD

4 hour


The GBP/USD has respected the 23.6% Fibonacci level but this retracement is very shallow and typically pullbacks go deeper.

1 hour


Price did not see a bullish impulse develop and retraced back to support (green). The bearish price action is most likely an ABC (light green) development unless price breaks below the bottom (green).

USD/JPY

4 hour


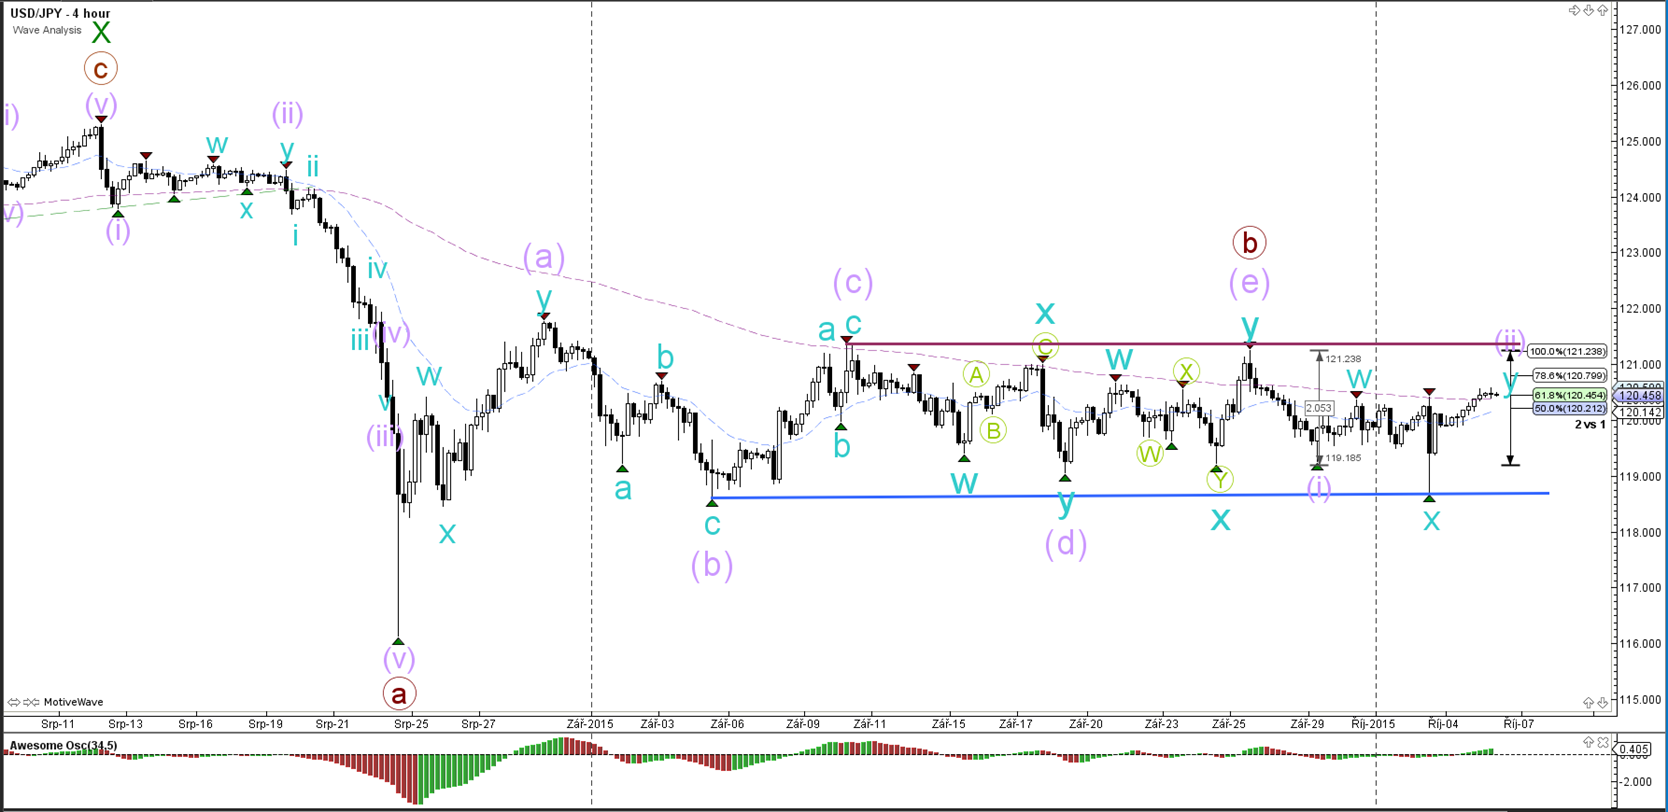
The USD/JPY price action remains in the sideways zone that is marked by support (blue) and resistance (purple).


“Original analysis is provided by Admiral Markets
 
EURUSD & GBPUSD Bullish Rally at Resistance Zone

EUR/USD

4 hour


The EUR/USD bounced at the support trend line (greens) and has reached again the resistance trend line (red). Price still seems to be correcting within a wave 2 (brown), which is invalidated if price breaks above the 100% (purple) line.

1 hour


A break above the resistance trend line (red) could be part of an ABC (blue) within wave Y (purple) of wave 2.

GBP/USD

4 hour


The GBP/USD could be breaking the resistance level (orange) of the sideways range. Waves 2 typically tend to be deep retracements on average which means price could retrace back to 50%, 61.8%, 78.6% and trend line (red).

1 hour


The GBP/USD showed strong bullish price action yesterday after it bounced at the support trend line (green). Price action seems to be unfolding in 5 waves which could be part of a larger wave A (green) as price rallies to correct wave 2 (orange).

USD/JPY

4 hour


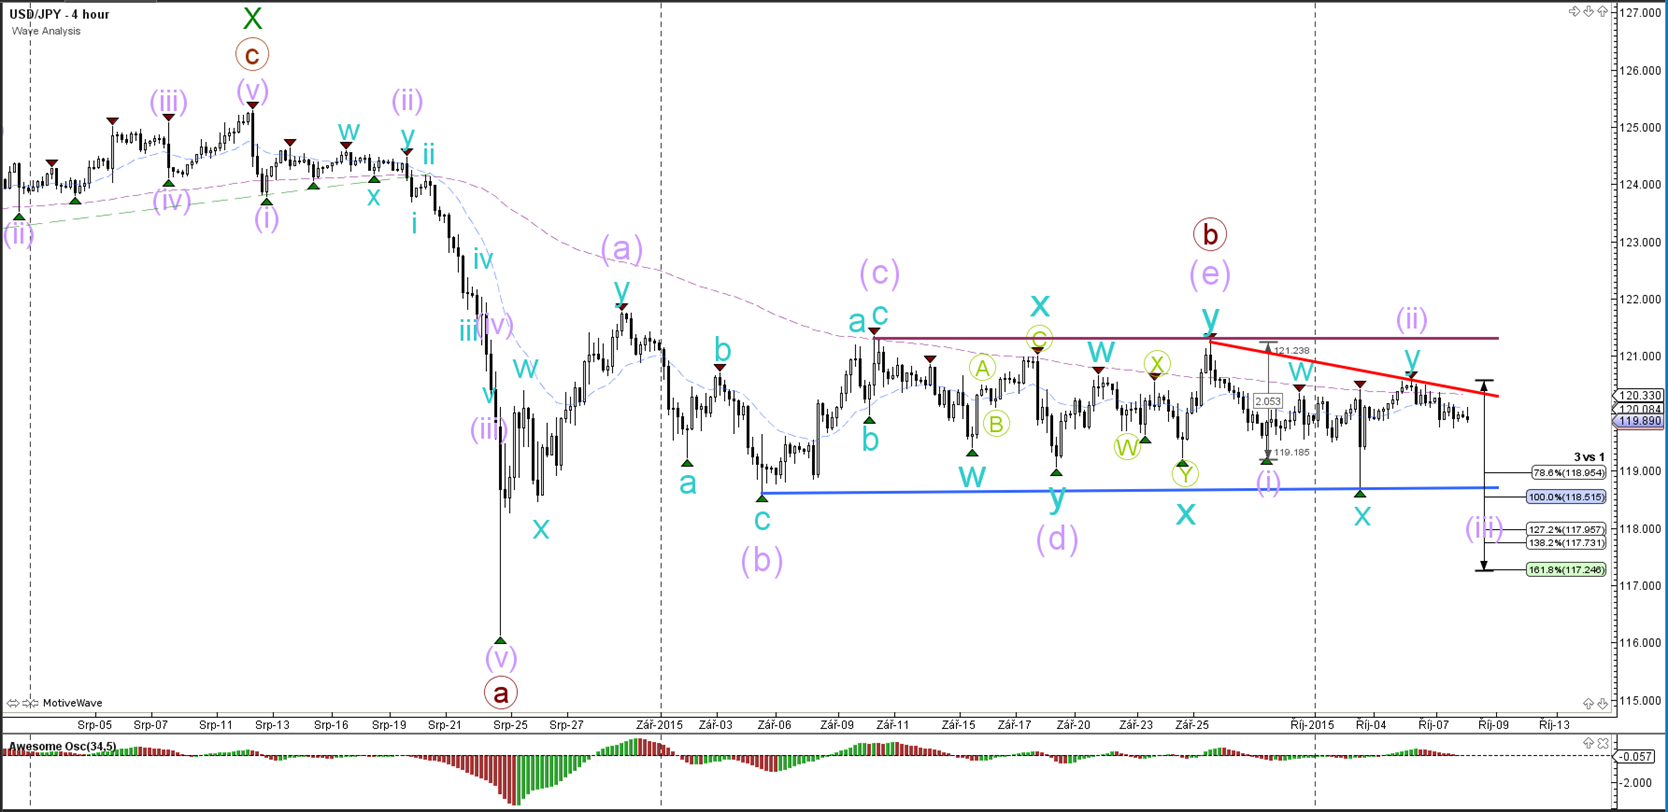
The USD/JPY seems to have made a bearish turn as part of a potential deep wave 2 (purple). Price will need to break below the range before a bigger wave 3 (purple) thrust becomes more likely.


“Original analysis is provided by Admiral Markets
 
GBPUSD Breaks Consolidation Zone and Moves to Fib Levels

EUR/USD

4 hour


The EUR/USD stayed in between the support (green) and resistance (red) trend lines and showed an overall choppy trading day yesterday. The choppiness could be explained by a wave B correction (blue) within a larger ABC (blue).

1 hour


A break above the resistance trend line (red) could be part of an ABC (blue) within wave Y (purple) of wave 2. A break of support invalidates the ABC structure.

GBP/USD

4 hour


The GBP/USD broke above the consolidation zone (dotted orange) and moved up to and respected the 38.2% Fibonacci retracement level. Considering the strong bullish momentum, the price action could be part of a larger ABC (green) within wave 2 (orange) and bring the correction up to a deeper Fibonacci retracement.

1 hour


The GBP/USD broke the resistance trend line (dotted red) in a strong and powerful wave 5 (blue).

USD/JPY

4 hour


The USD/JPY bearish turn has been a slow mover so far. Price still will need to break below the range before a bigger wave 3 (purple) thrust becomes more likely. A break of the top of the range (purple line) invalidates the current wave count with B (brown) and 1-2 (purple).


“Original analysis is provided by Admiral Markets
 
GBPUSD Zigzag and EURUSD Range within Waves 2

EUR/USD

4 hour


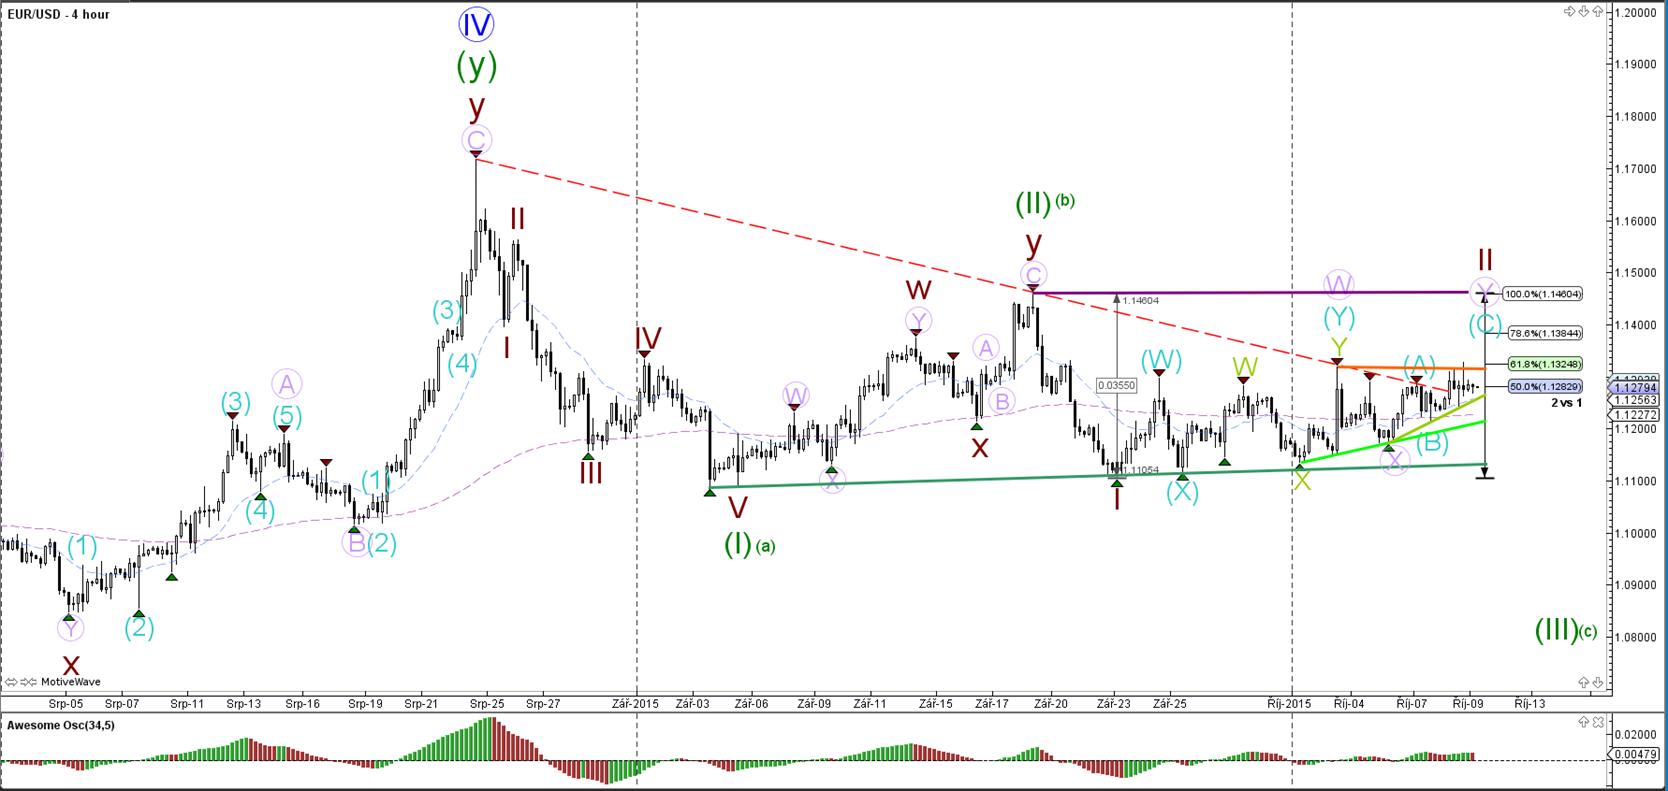
The EUR/USD broke the resistance trend line (dotted red) with a lot of hesitation. Price is still respecting the heavy resistance layer at around 1.1325 which is the 61.8% Fibonacci retracement level of wave 2 (brown). A break of the various support levels (greens) would confirm the completion of the wave Y (purple) correction and wave 2 (brown).

1 hour


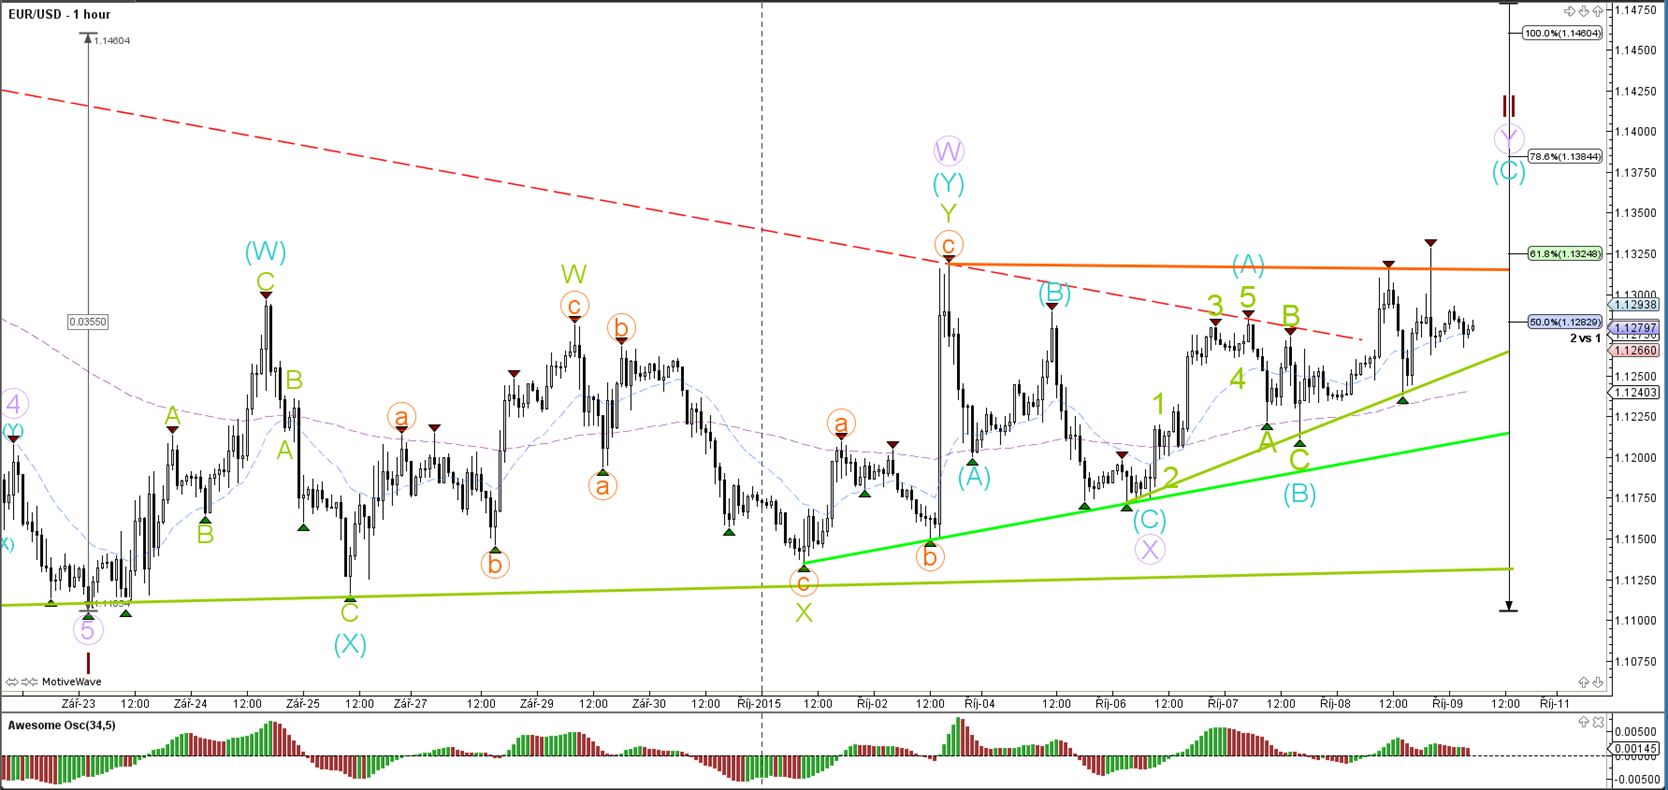
Yesterday's price action has been choppy as price respected both the support and resistance levels. A bullish breakout could see price retrace deep towards the 78.6% Fibonacci level. A bearish breakout could at first be choppy as price hits other support levels but could be the start of a potential wave 1-2 development within wave 3 or C (green on 4 hour chart).

GBP/USD

4 hour


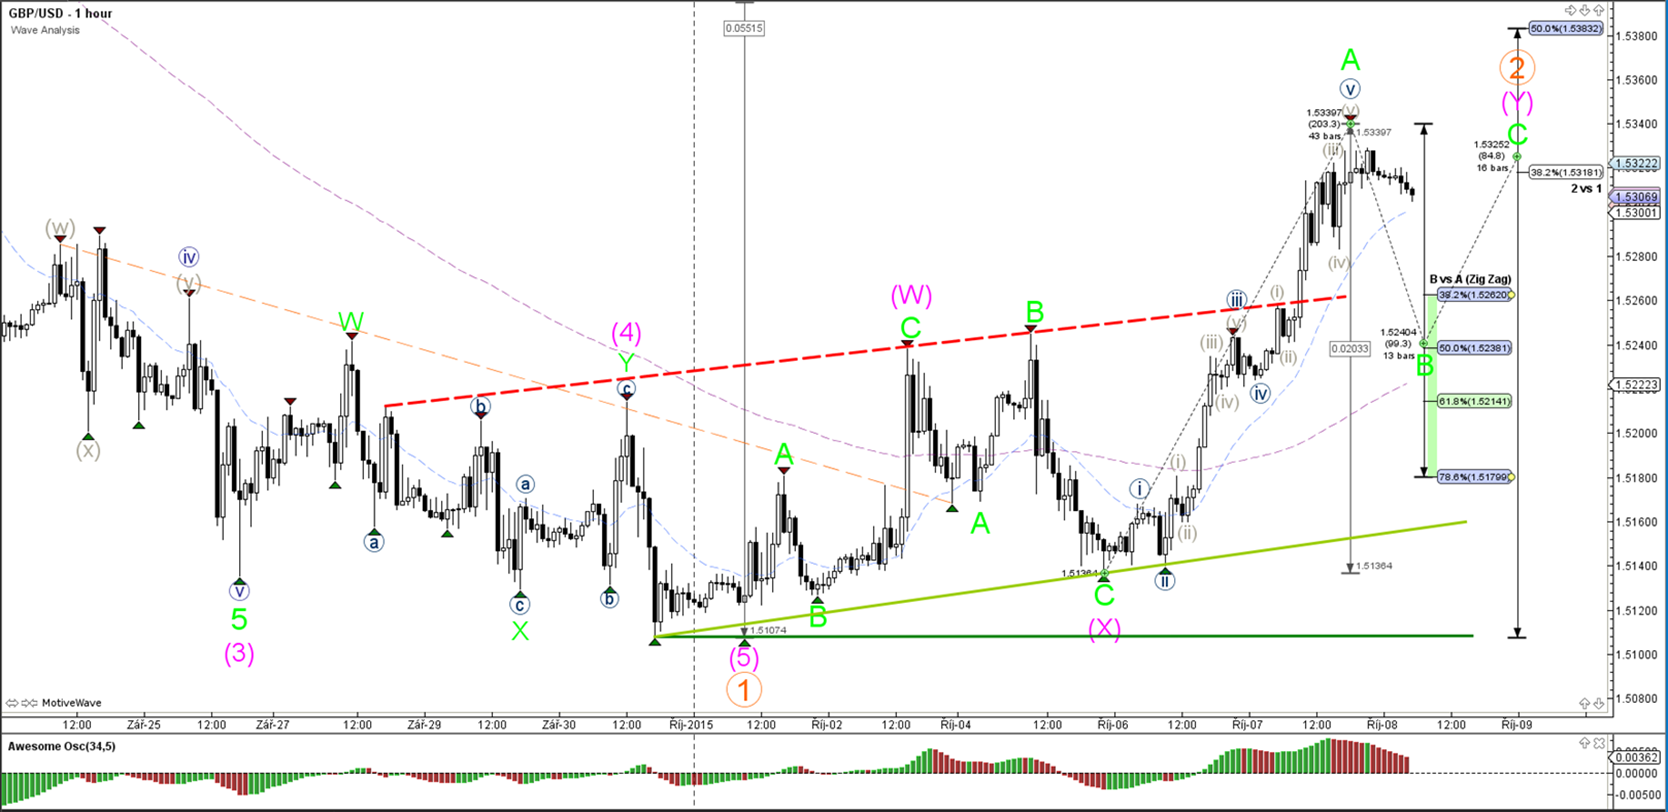
The GBP/USD respected and stopped at the 50% Fibonacci level of wave 2 (orange) but it seems that price was only making a pause before continuing higher. Price is developing a bullish ABC (green) zigzag formation.

1 hour


The GBP/USD made a deep pullback to the 50% Fibonacci retracement level as part of a wave B (green) and price seems now to be heading towards the wave C (green) Fibonacci target levels.

USD/JPY

4 hour


The USD/JPY remains anchored in a consolidation (red/green) within a sideways range (purple/blue). The indecision is dominating the chart but the wave count is favoring a bearish structure with a wave B and C (brown).


“Original analysis is provided by Admiral Markets
 
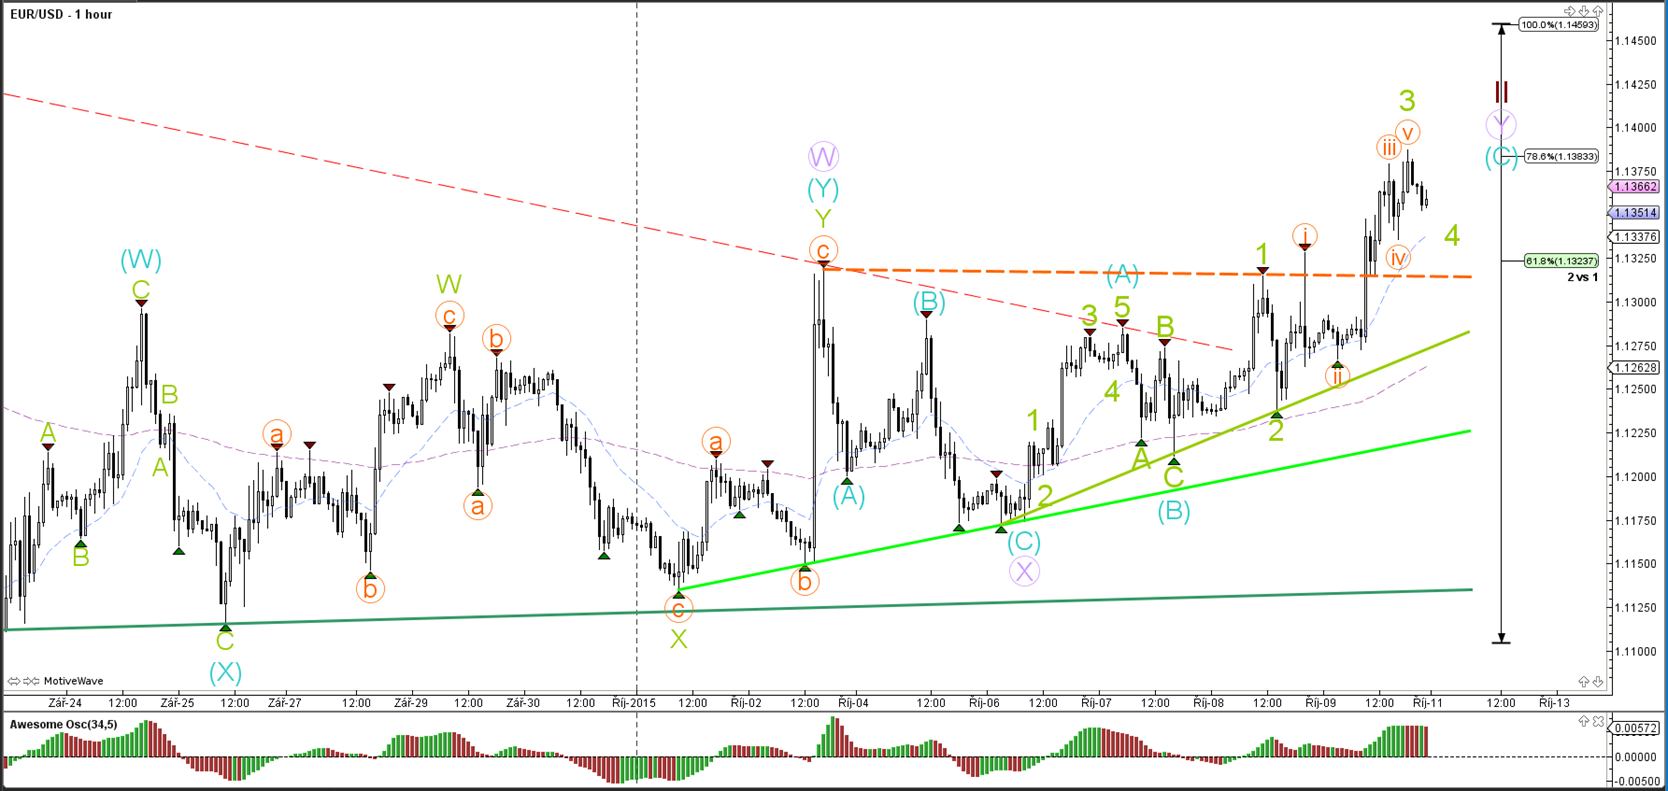
EUR/USD Breaks Resistance and Accelerates to 78.6% Fibonacci

EUR/USD

4 hour


The EUR/USD respected the 78.6% Fibonacci level after price broke the resistance at around 1.1325. The invalidation level of the wave 1-2 (brown) is the purple line. A break below support most likely confirms the development of the wave 3 or C (green).

1 hour


The latest bullish price action could have completed wave C (blue) or there could more upside remaining as price makes a wave 3 and 4 (green) within C.

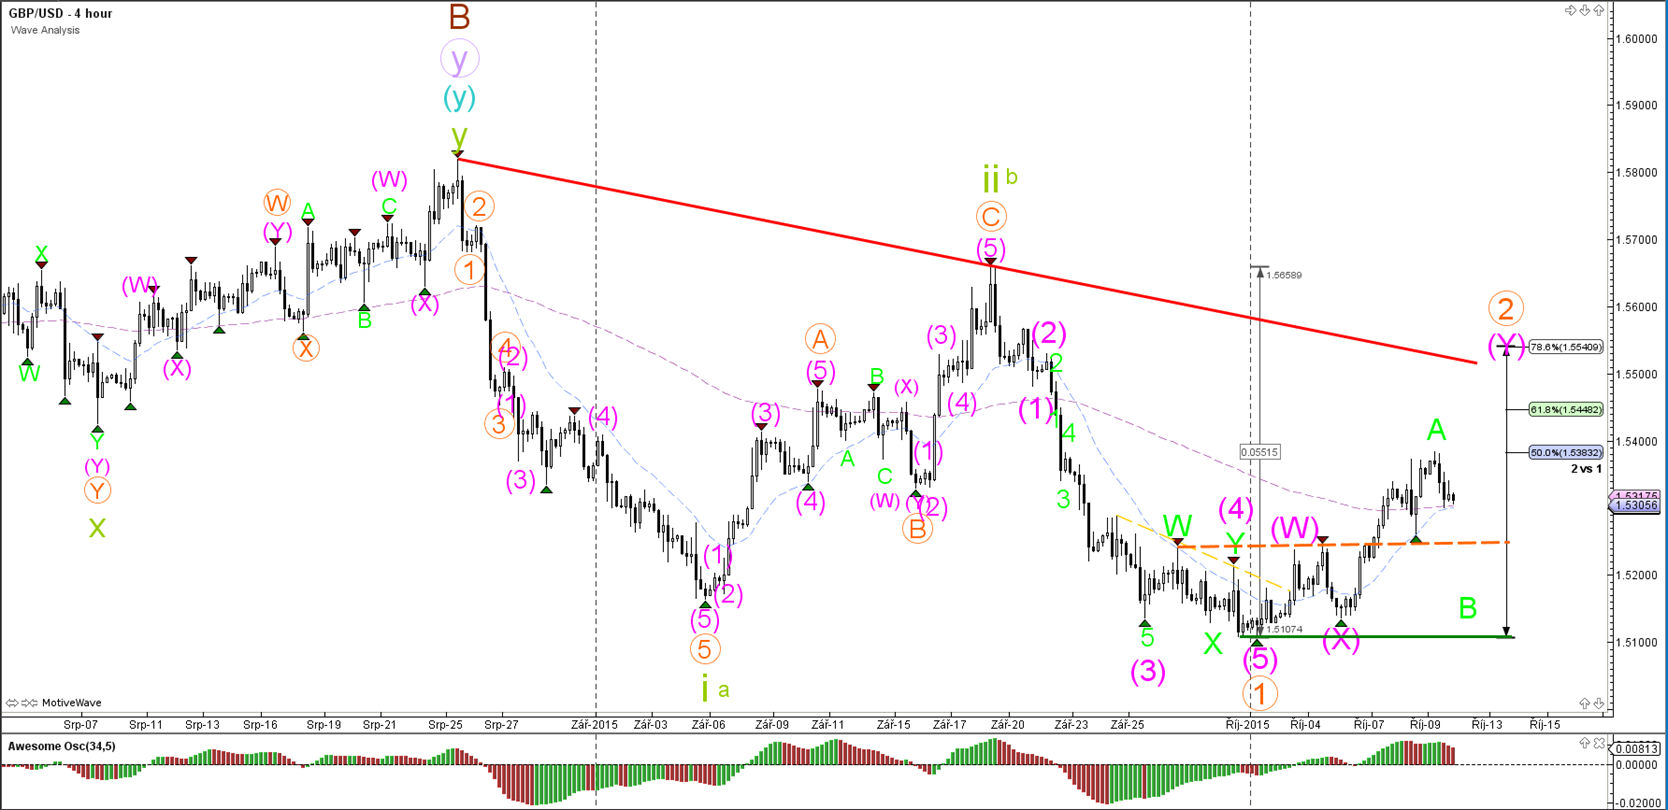
GBP/USD

4 hour


The GBP/USD is currently showing a bullish retracement as part of the wave 2 (orange). Price stopped at the 50% Fibonacci retracement level but could go to a higher Fib if price does continue with an ABC zigzag (green).

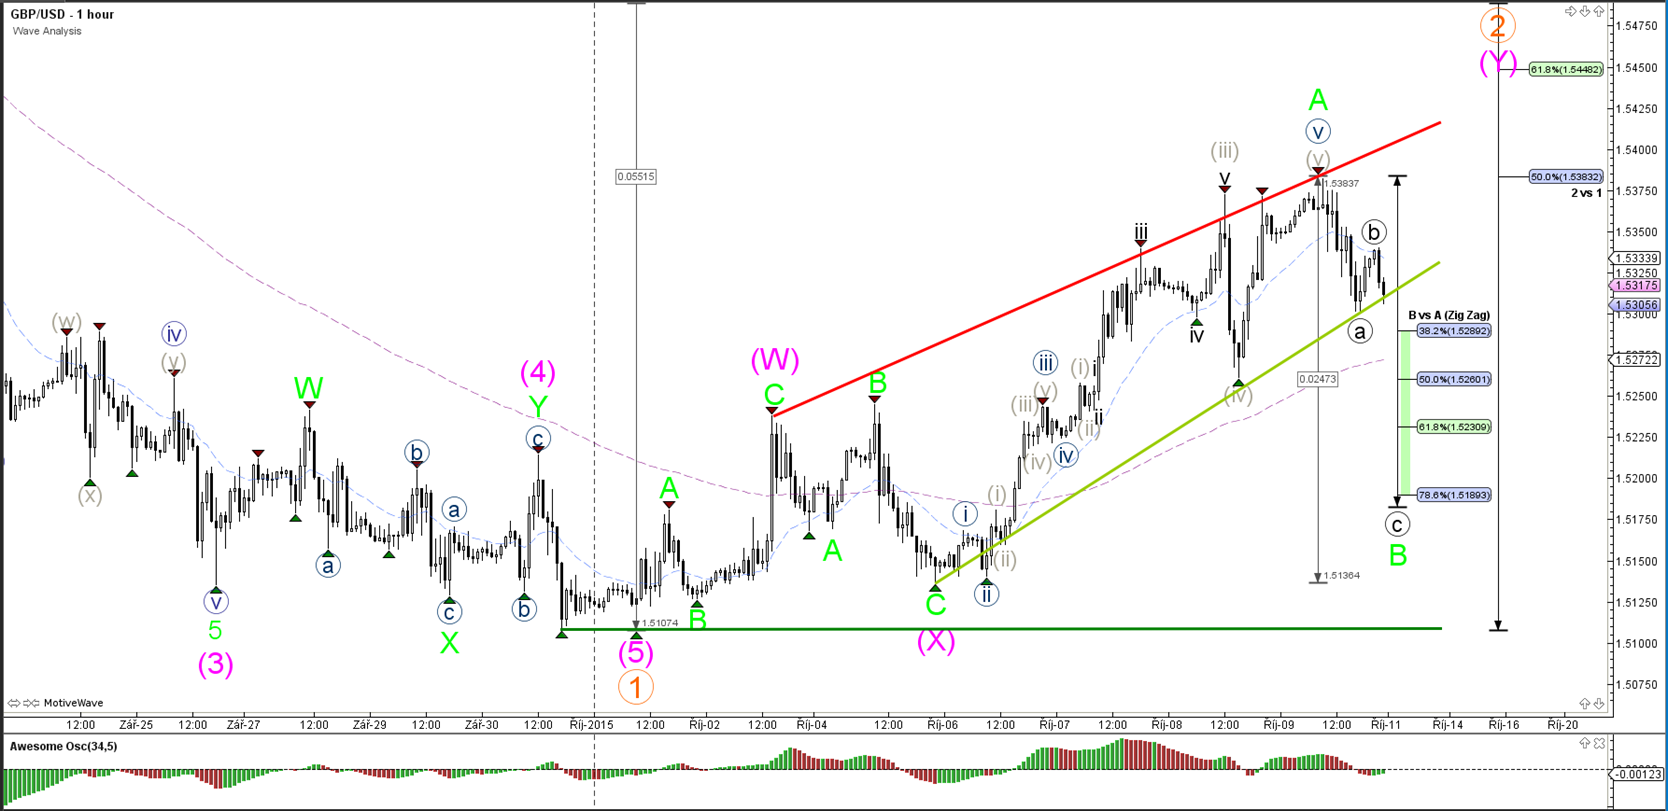
1 hour


The GBP/USD seems to be building a bearish ABC correction (blue) within the wave B (green).

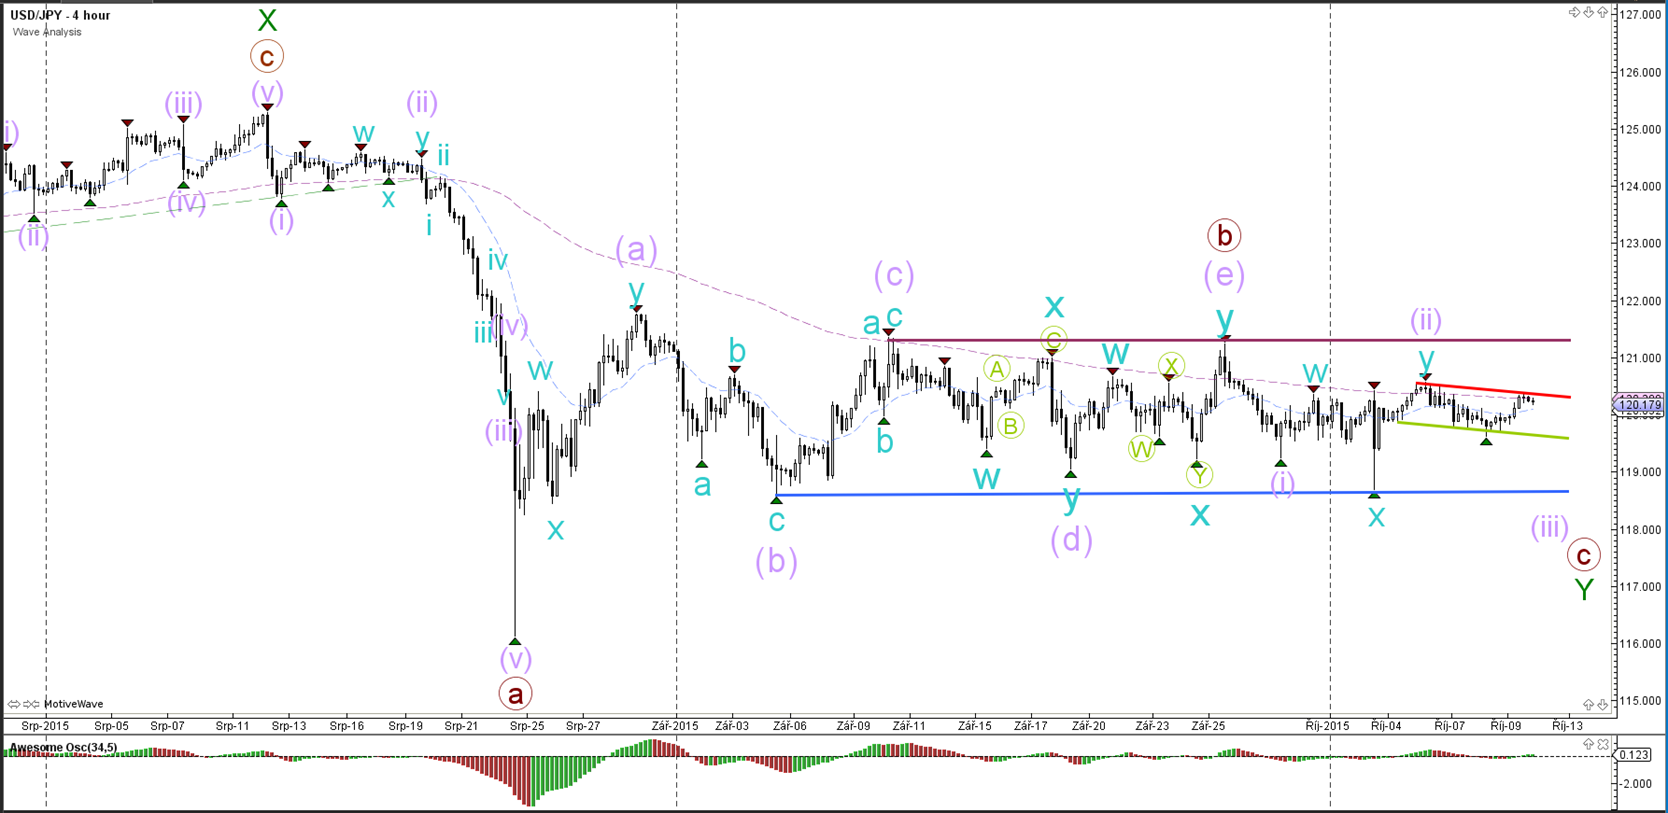
USD/JPY

4 hour


The USD/JPY remains secured in a consolidation (red/green) within a sideways range (purple/blue). The wave count is favoring a bearish structure with a wave B and C (brown) due to strong bearish momentum in August (wave A).


“Original analysis is provided by Admiral Markets
 
EUR/USD Jammed Between Resistance Fibs & Support Lines

EUR/USD

4 hour


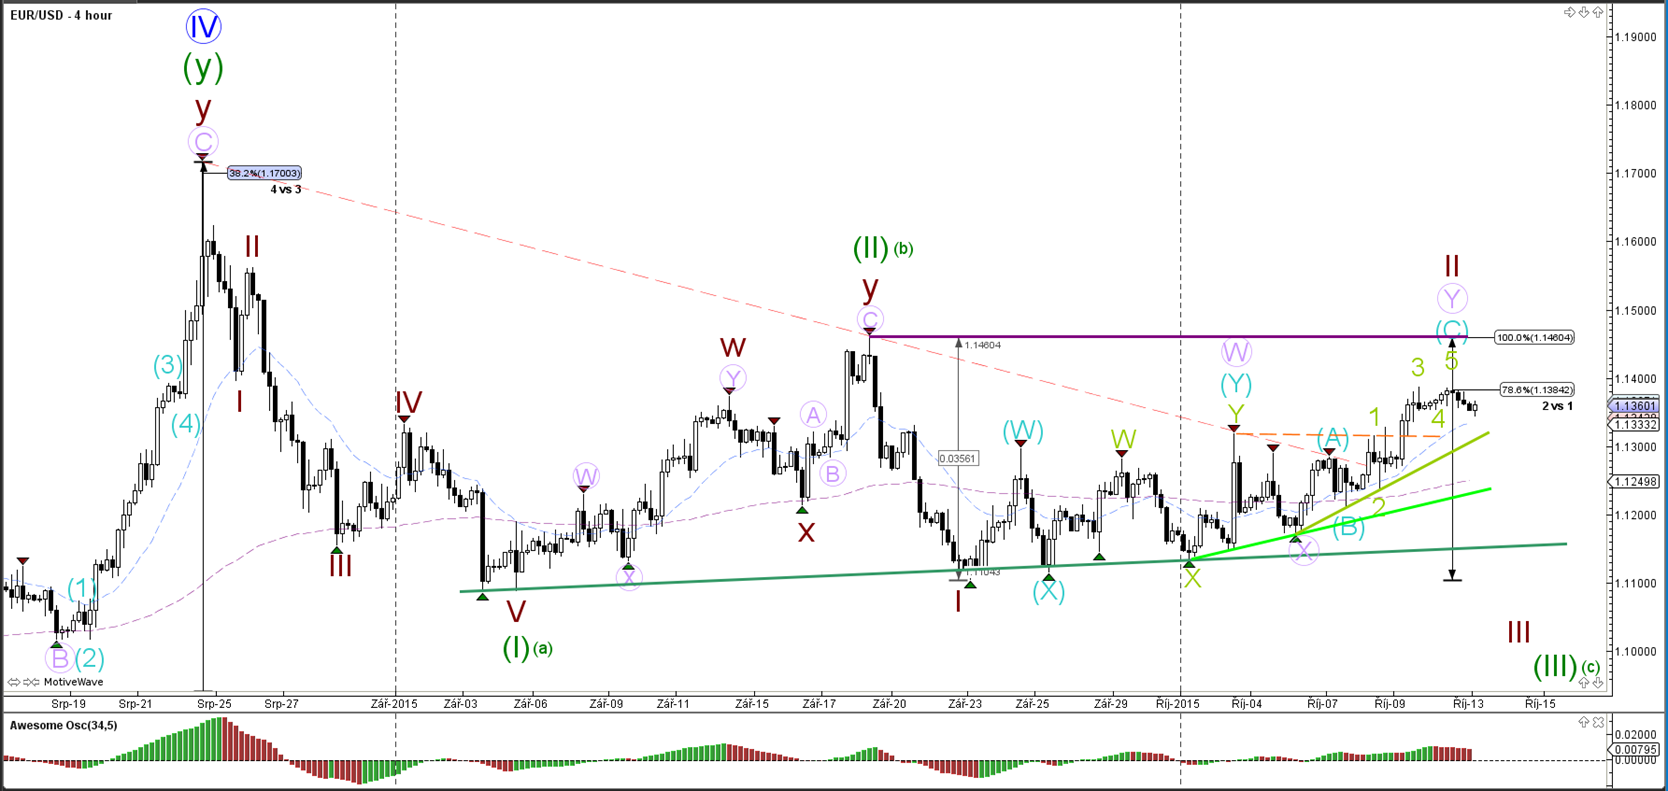
Whether the EUR/USD is indeed in a wave 1-2 (brown) depends if price will make a bearish turn prior to breaking the top (purple line / 100% Fib). A break of the various support levels (green) could initiate the start of the wave 3 or C (green).

1 hour


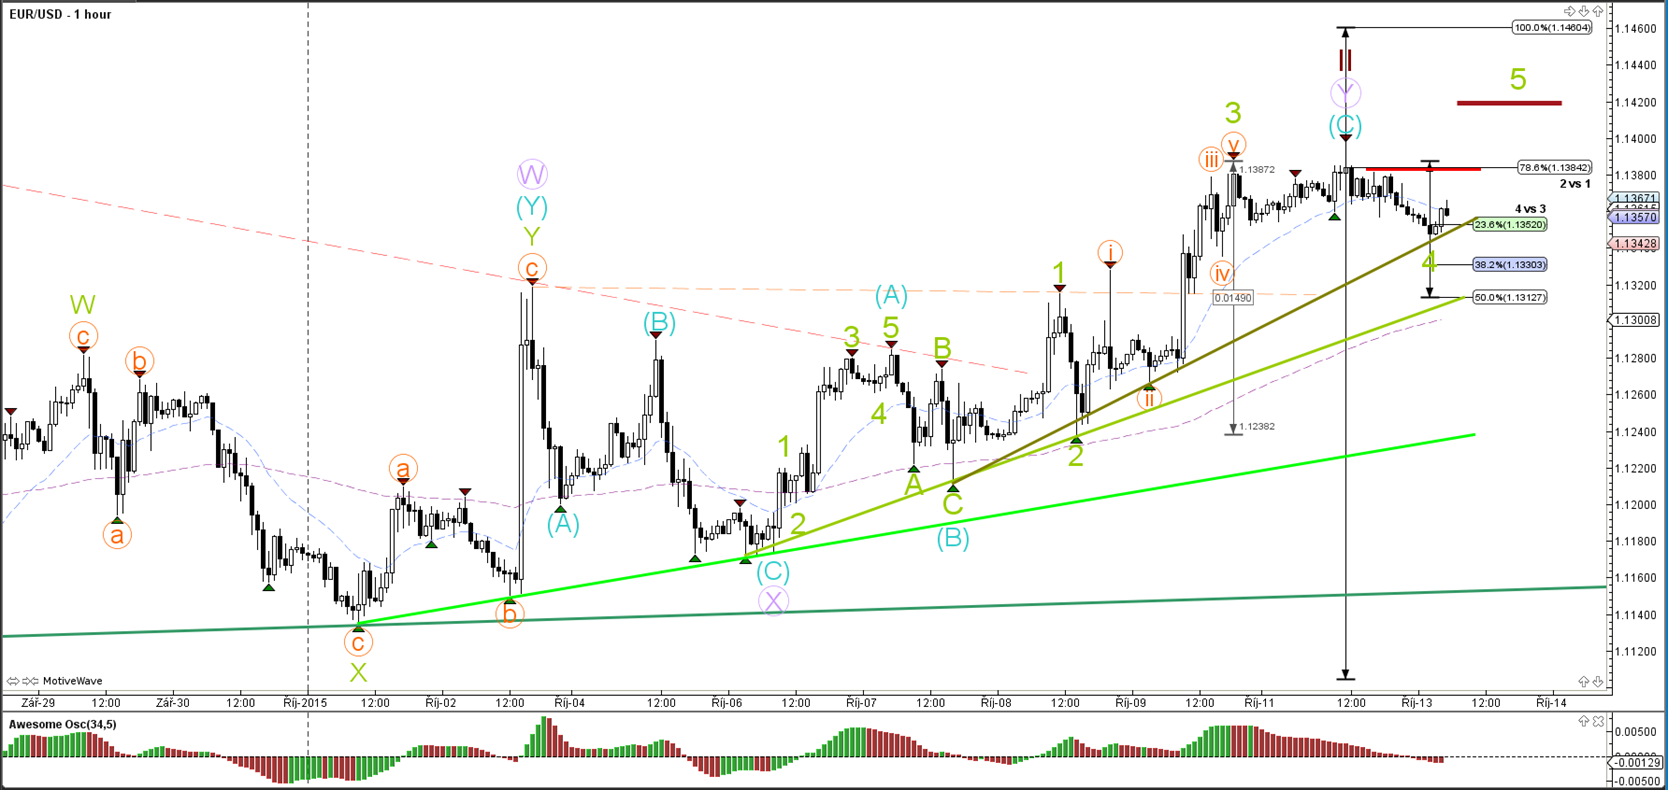
A break above the local resistance (red) and 78.6% Fibonacci level could see price move up to complete wave 5 (green) at for instance 1.1420-25. A break below the support Fibonacci levels (4vs3) and 2 of the trend lines could indicate that wave 5 (green) has most likely been completed (as shown in the 4 hour chart).

GBP/USD

4 hour


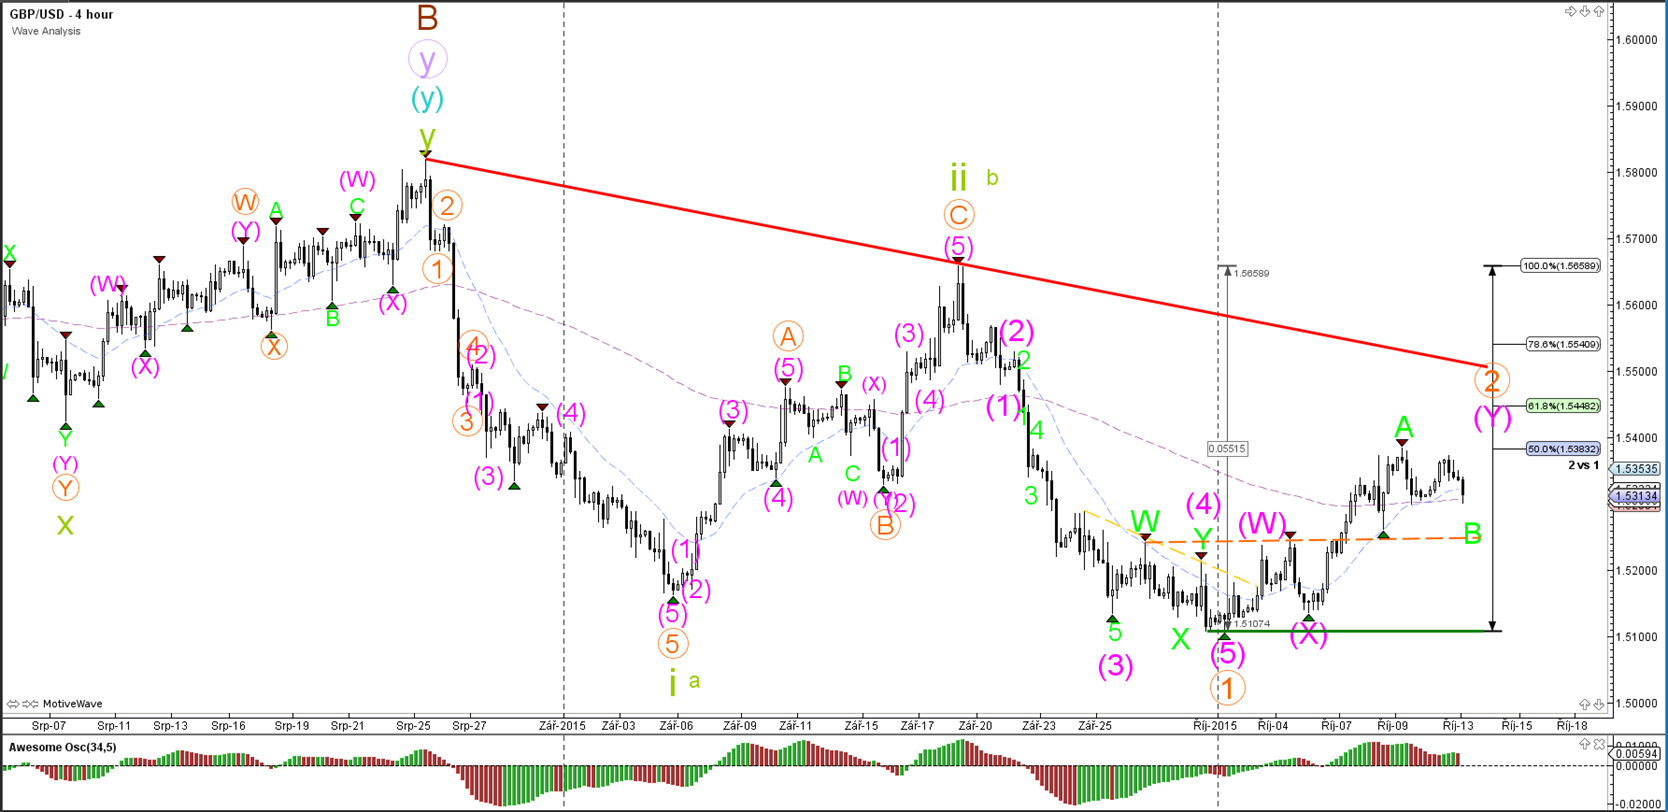
The GBP/USD has made a bearish turn at the 50% Fibonacci retracement level but the upside price action has more momentum and hence I have labeled the waves as ABC (green) within wave 2 (orange). Price has potential space towards the 61.8% or 78.6% Fibonacci levels.

1 hour


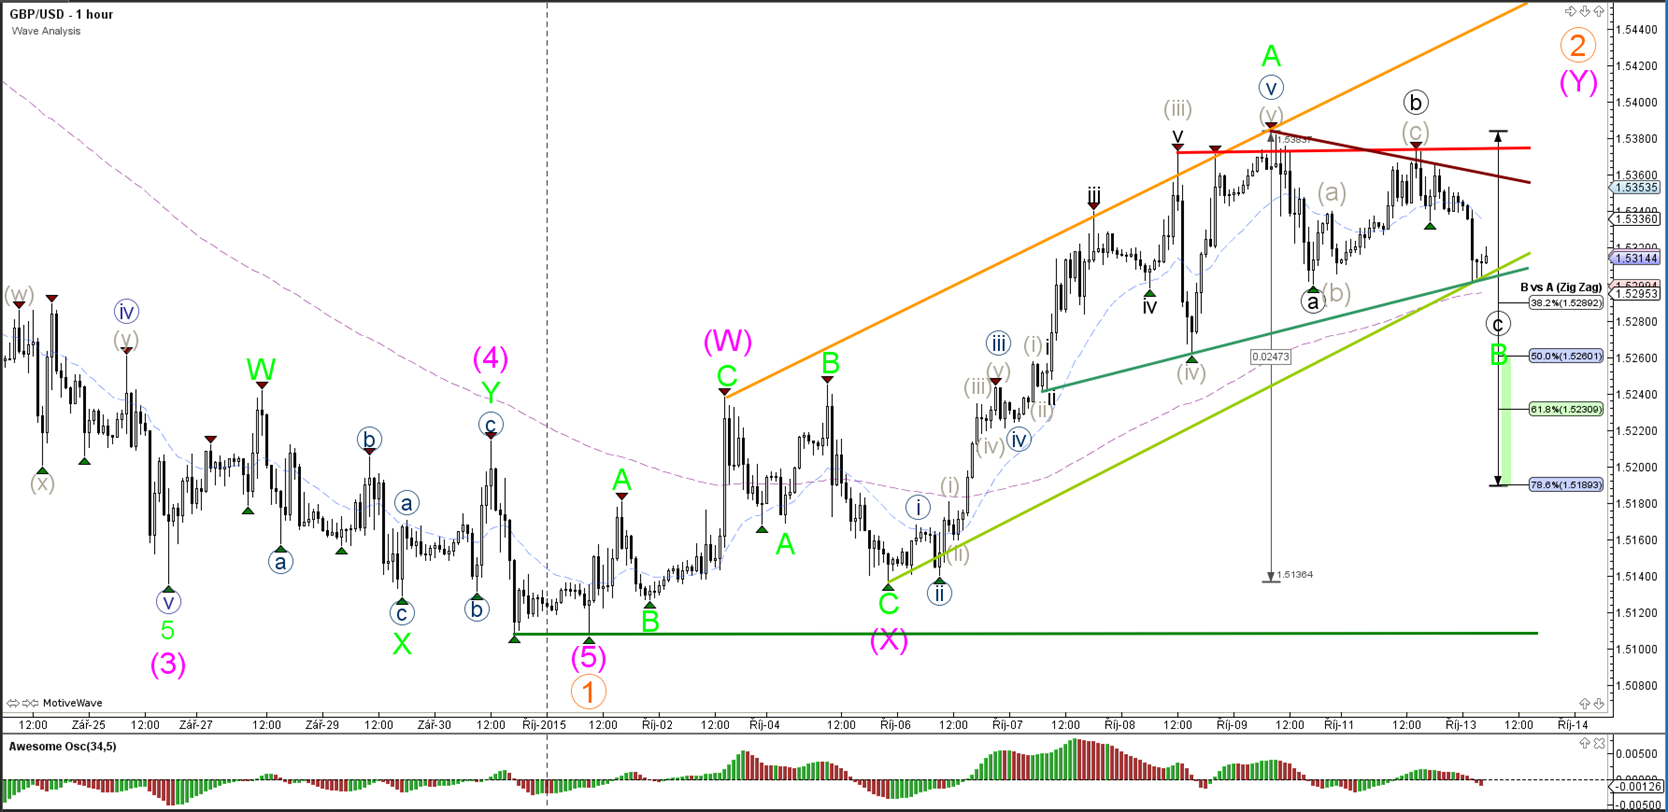
The GBP/USD made a deeper wave B (blue) yesterday before falling back down as part of a larger ABC (blue) correction. The zigzag seems to be part of a wave B (green) correction within wave 2 (orange).

USD/JPY

4 hour


The USD/JPY break below support (blue) could signal the start of wave 3 (purple) whereas a break above resistance (purple) invalidates the current bearish wave structure.


“Original analysis is provided by Admiral Markets
 
Back
Top