Admiral Markets
AdmiralMarkets.com Representative
- Messages
- 95
Technical Overview - AUDUSD and AUDCHF
AUDUSD

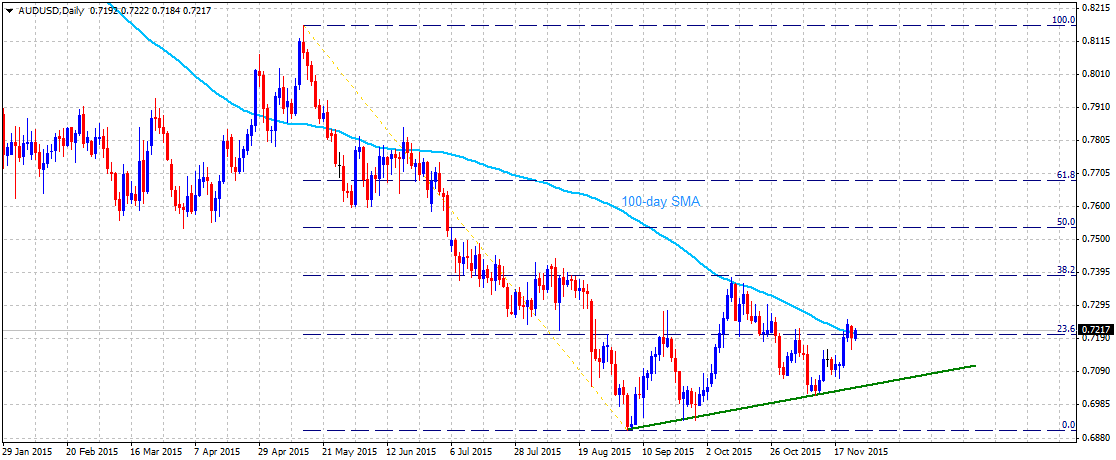
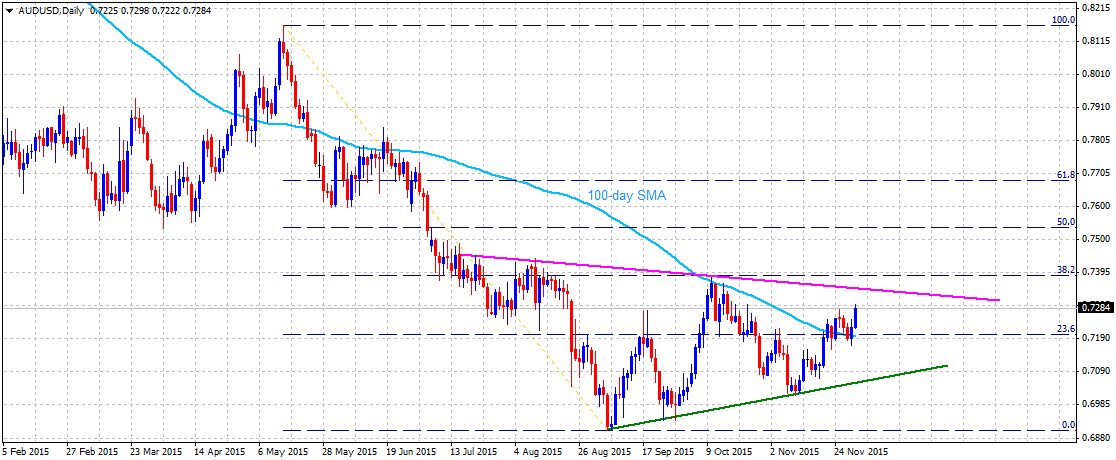
The pair's reversal from October highs, also marking 100-day SMA resistance, has managed to find support near 0.7000 psychological mark, representing a short-term ascending trend-line support extending from multi-year lows tested in September. The pair has subsequently moved above 0.7100 mark and is currently trading close to a short-term descending trend-line resistance near 0.7120-30 area. A decisive break-through this immediate resistance, also coinciding with 50-day SMA, is likely to assist the pair back towards testing the very important resistance near 0.7200-0.7220 area. Alternatively, failure to conquer this immediate resistance and a sustained weakens below 0.7000 important support now seems to increase the possibilities of further downward trajectory, initially towards 0.6930-20 horizontal support (nearing 0.6900 round figure mark) before heading lower towards testing sub-0.6800 mark support.
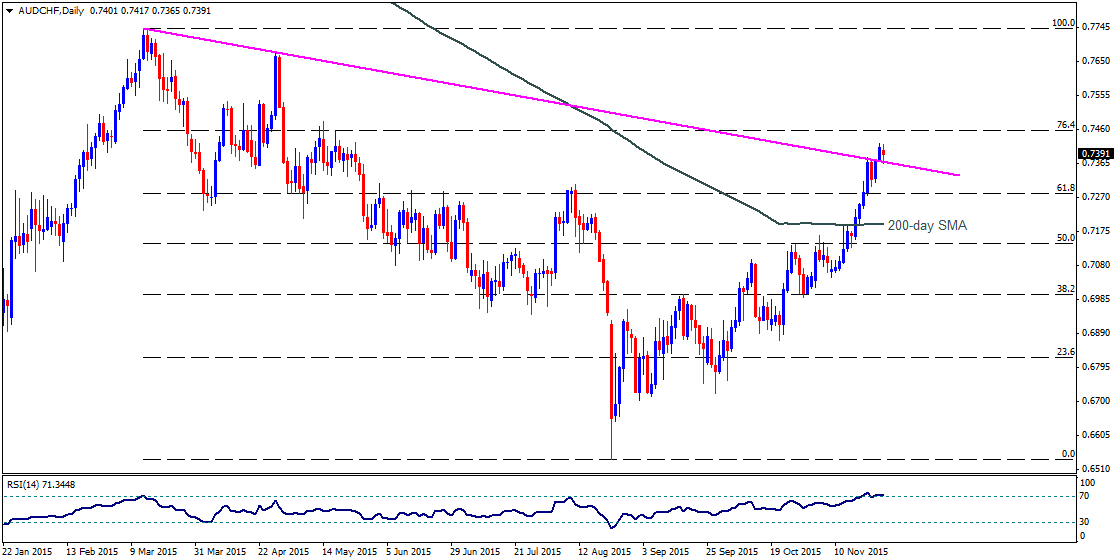
AUDCHF
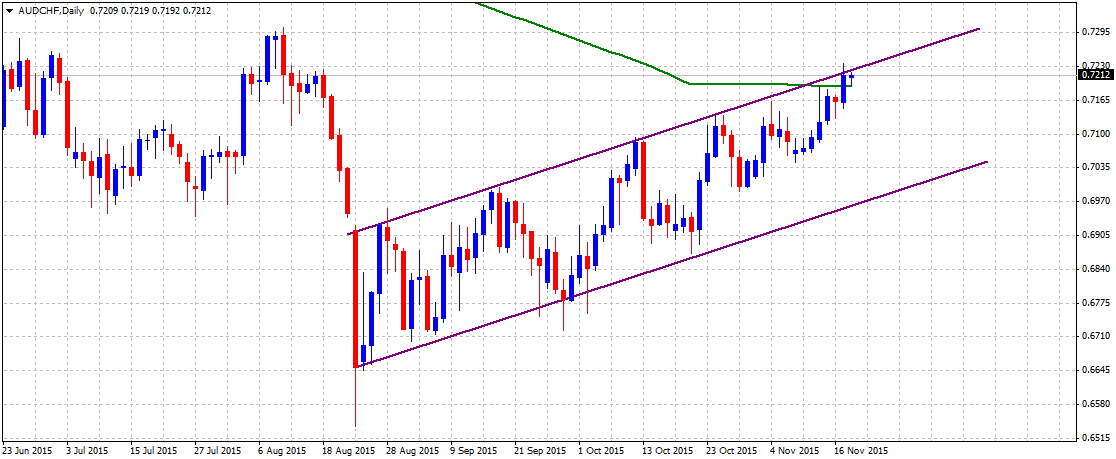
The pair extends its recovery from the all-time low levels within a short-term ascending trend-channel formation on daily chart. The pair is now trading above 200-day SMA for the first time since Jan. and is also close to the upper trend-line resistance of the channel near 0.7220-30 area. Should the ongoing bullish momentum assist the pair in conquering this immediate resistance, the pair could further extend the recovery towards retesting 0.7300-0.7310 strong resistance, marking highs tested in June and August this year. Meanwhile, considering that the pair is trading close to the upper trend-line resistance of the channel, weakness back below 200-day SMA is likely to find immediate support near 0.7120-0.7100 area. Weakness below 0.7100 mark is likely to be limited by a strong support near 0.7060-50 horizontal zone and a decisive break below this strong support might negate possibilities of any further recovery momentum, dragging the pair back towards retesting the lower trend-line support of the channel, currently near 0.7000 mark.
“Original analysis is provided by Admiral Markets”
AUDUSD
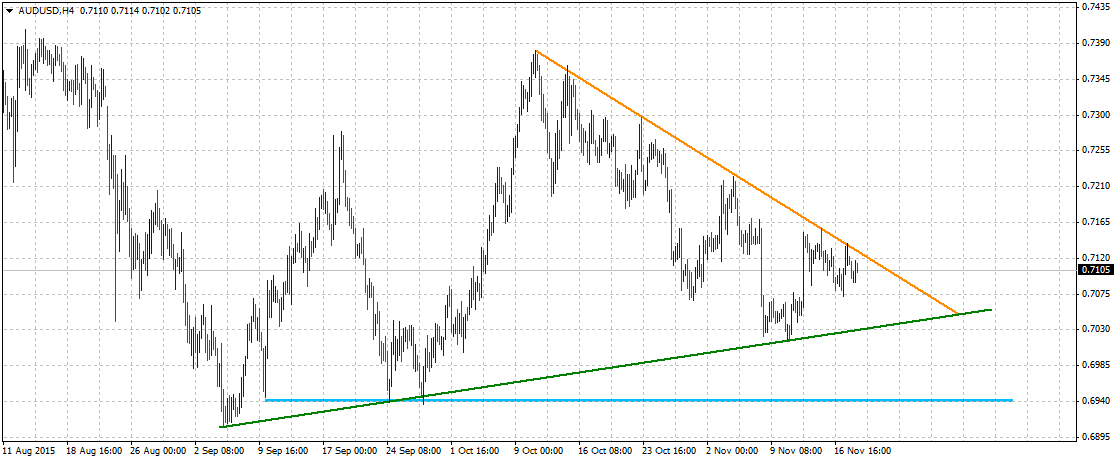
The pair's reversal from October highs, also marking 100-day SMA resistance, has managed to find support near 0.7000 psychological mark, representing a short-term ascending trend-line support extending from multi-year lows tested in September. The pair has subsequently moved above 0.7100 mark and is currently trading close to a short-term descending trend-line resistance near 0.7120-30 area. A decisive break-through this immediate resistance, also coinciding with 50-day SMA, is likely to assist the pair back towards testing the very important resistance near 0.7200-0.7220 area. Alternatively, failure to conquer this immediate resistance and a sustained weakens below 0.7000 important support now seems to increase the possibilities of further downward trajectory, initially towards 0.6930-20 horizontal support (nearing 0.6900 round figure mark) before heading lower towards testing sub-0.6800 mark support.
AUDCHF

The pair extends its recovery from the all-time low levels within a short-term ascending trend-channel formation on daily chart. The pair is now trading above 200-day SMA for the first time since Jan. and is also close to the upper trend-line resistance of the channel near 0.7220-30 area. Should the ongoing bullish momentum assist the pair in conquering this immediate resistance, the pair could further extend the recovery towards retesting 0.7300-0.7310 strong resistance, marking highs tested in June and August this year. Meanwhile, considering that the pair is trading close to the upper trend-line resistance of the channel, weakness back below 200-day SMA is likely to find immediate support near 0.7120-0.7100 area. Weakness below 0.7100 mark is likely to be limited by a strong support near 0.7060-50 horizontal zone and a decisive break below this strong support might negate possibilities of any further recovery momentum, dragging the pair back towards retesting the lower trend-line support of the channel, currently near 0.7000 mark.
“Original analysis is provided by Admiral Markets”