Admiral Markets
AdmiralMarkets.com Representative
- Messages
- 95
Forex Majors Retrace Back to Wave 4 Fibonacci Levels
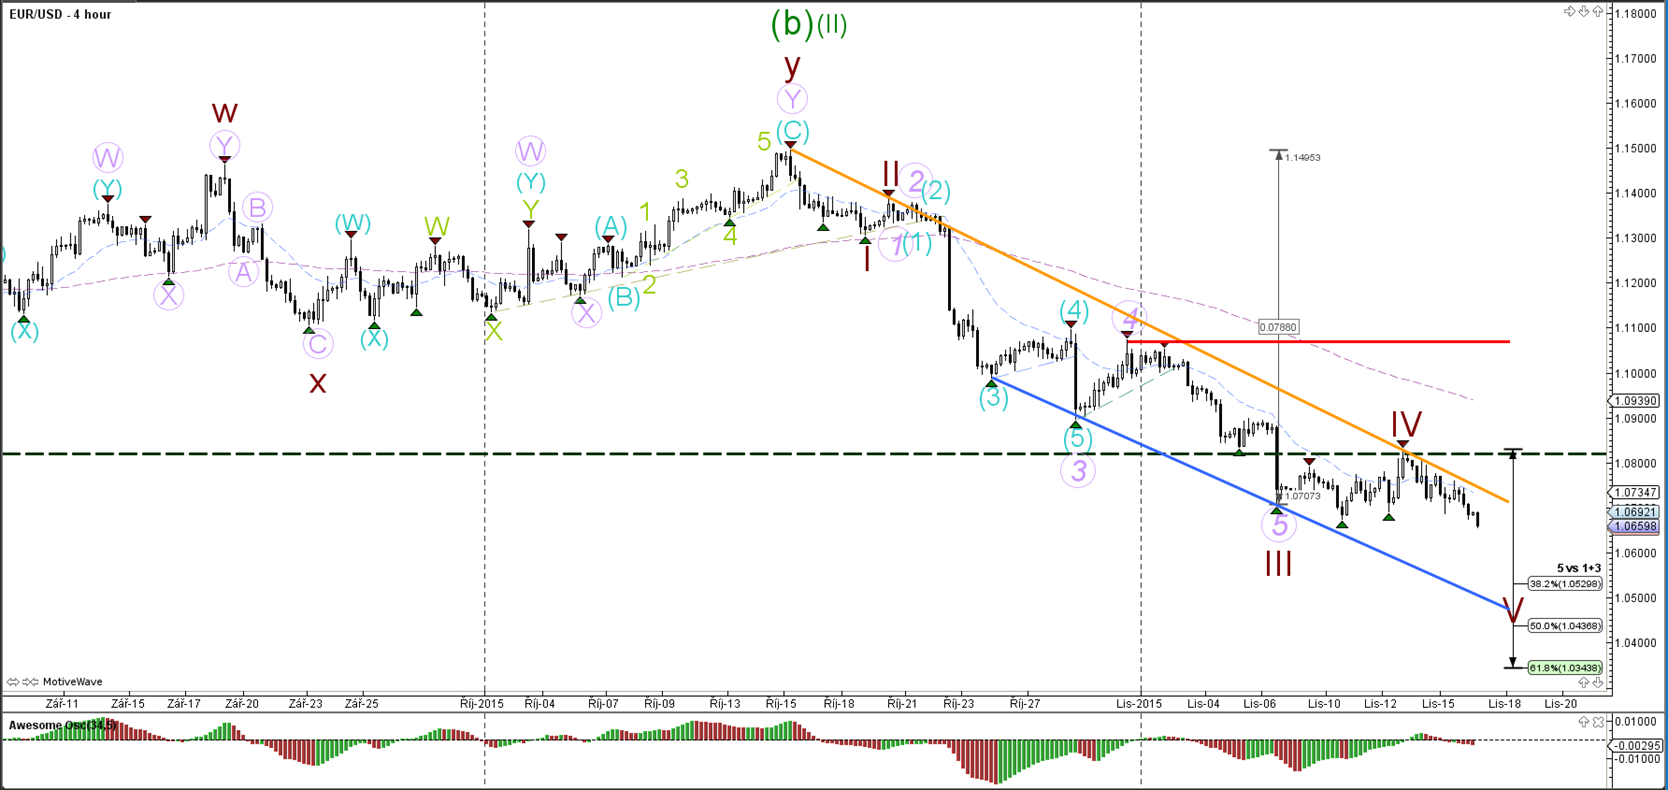
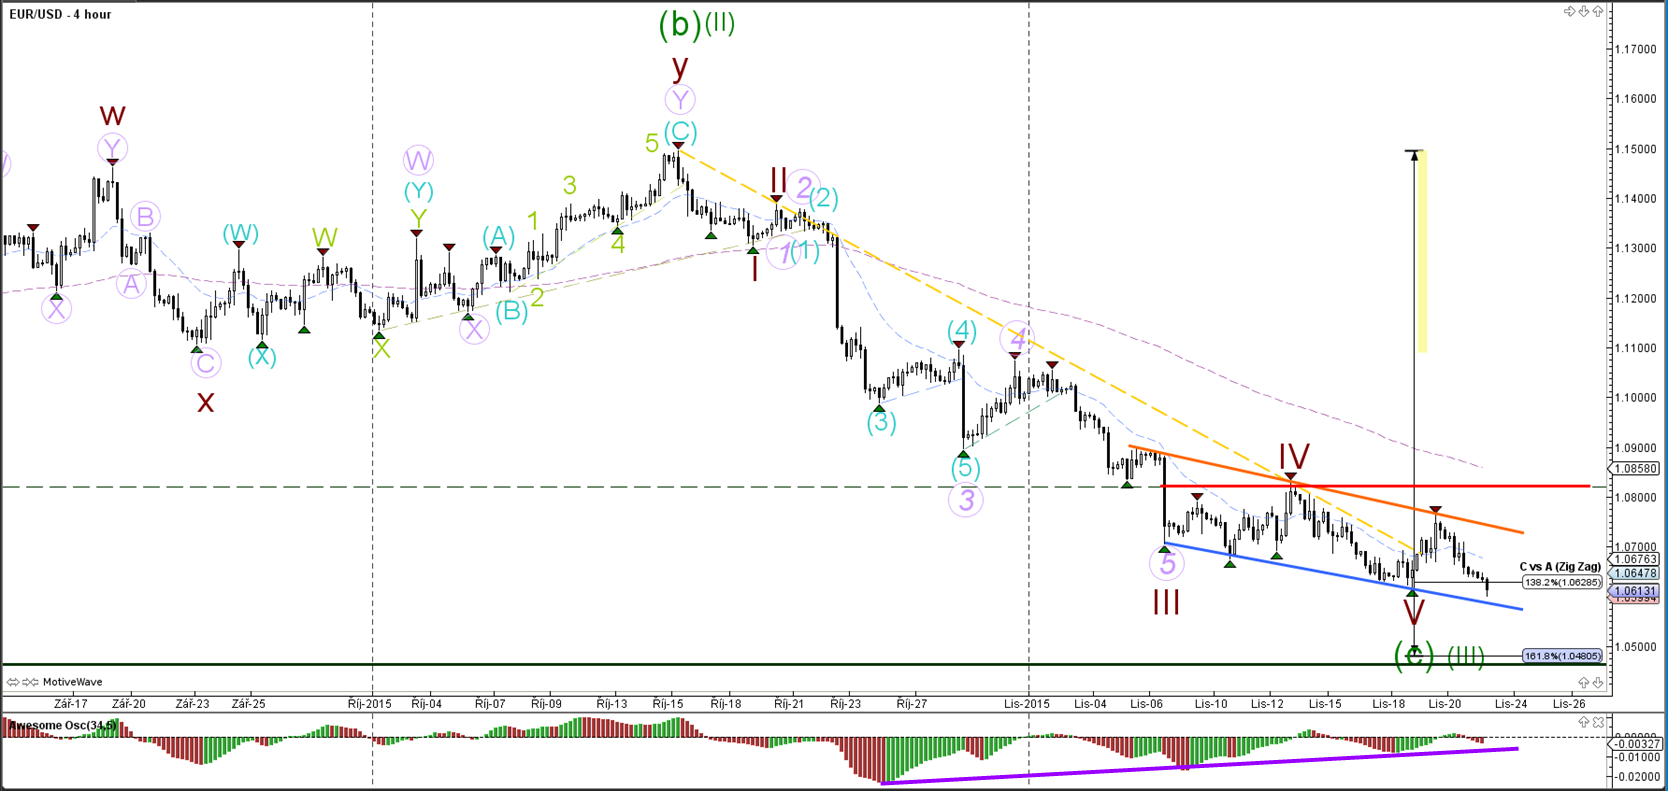
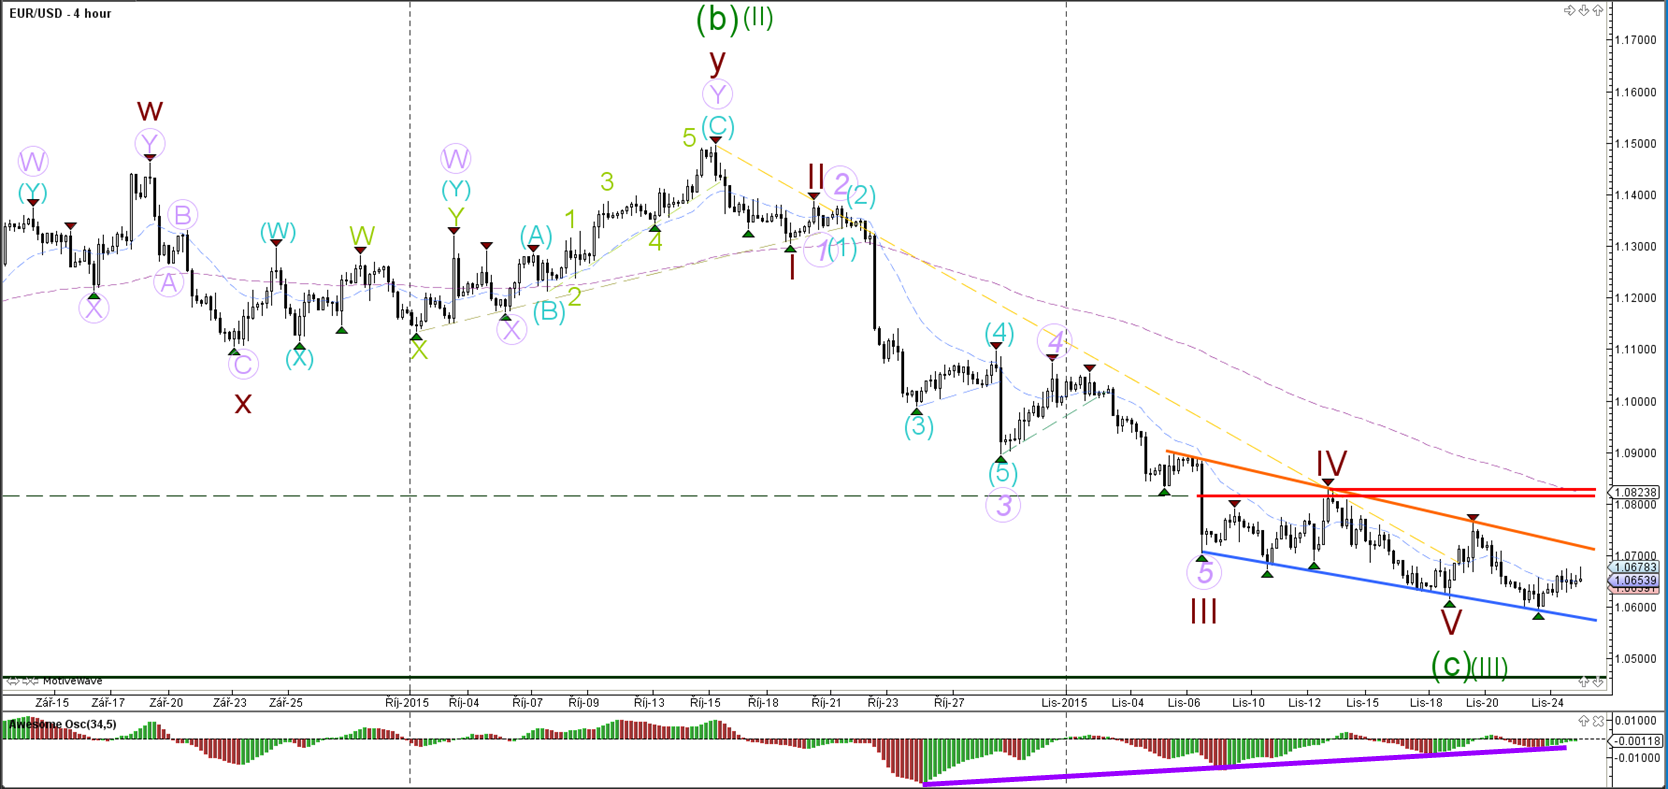
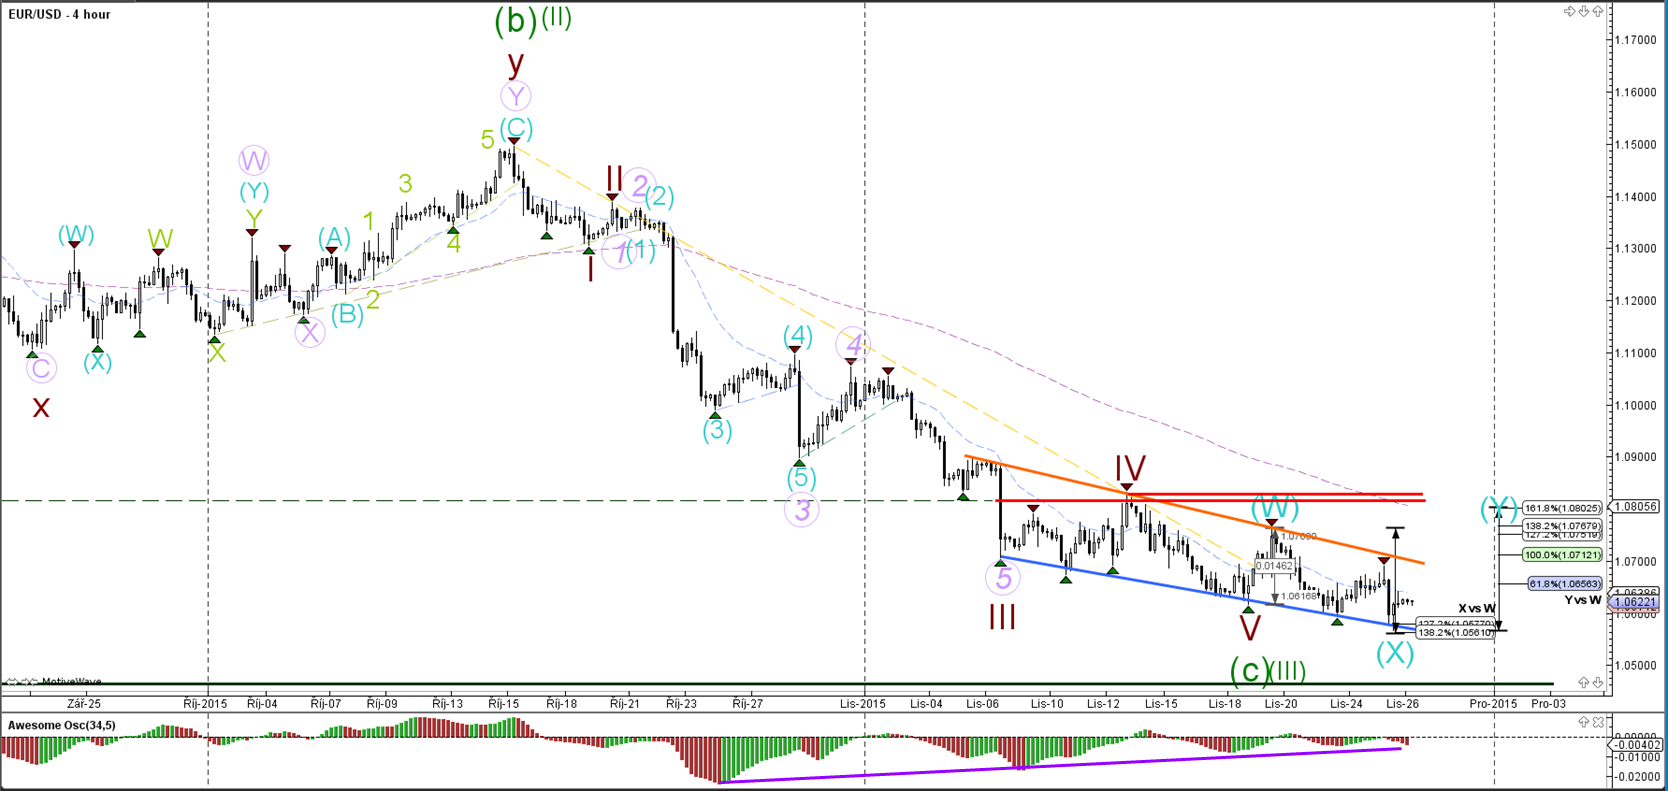
EUR/USD
4 hour

The EUR/USD is in a wave 4 (brown) correction. The wave count is invalidated if price manages to break above the 50% Fibonacci retracement level.
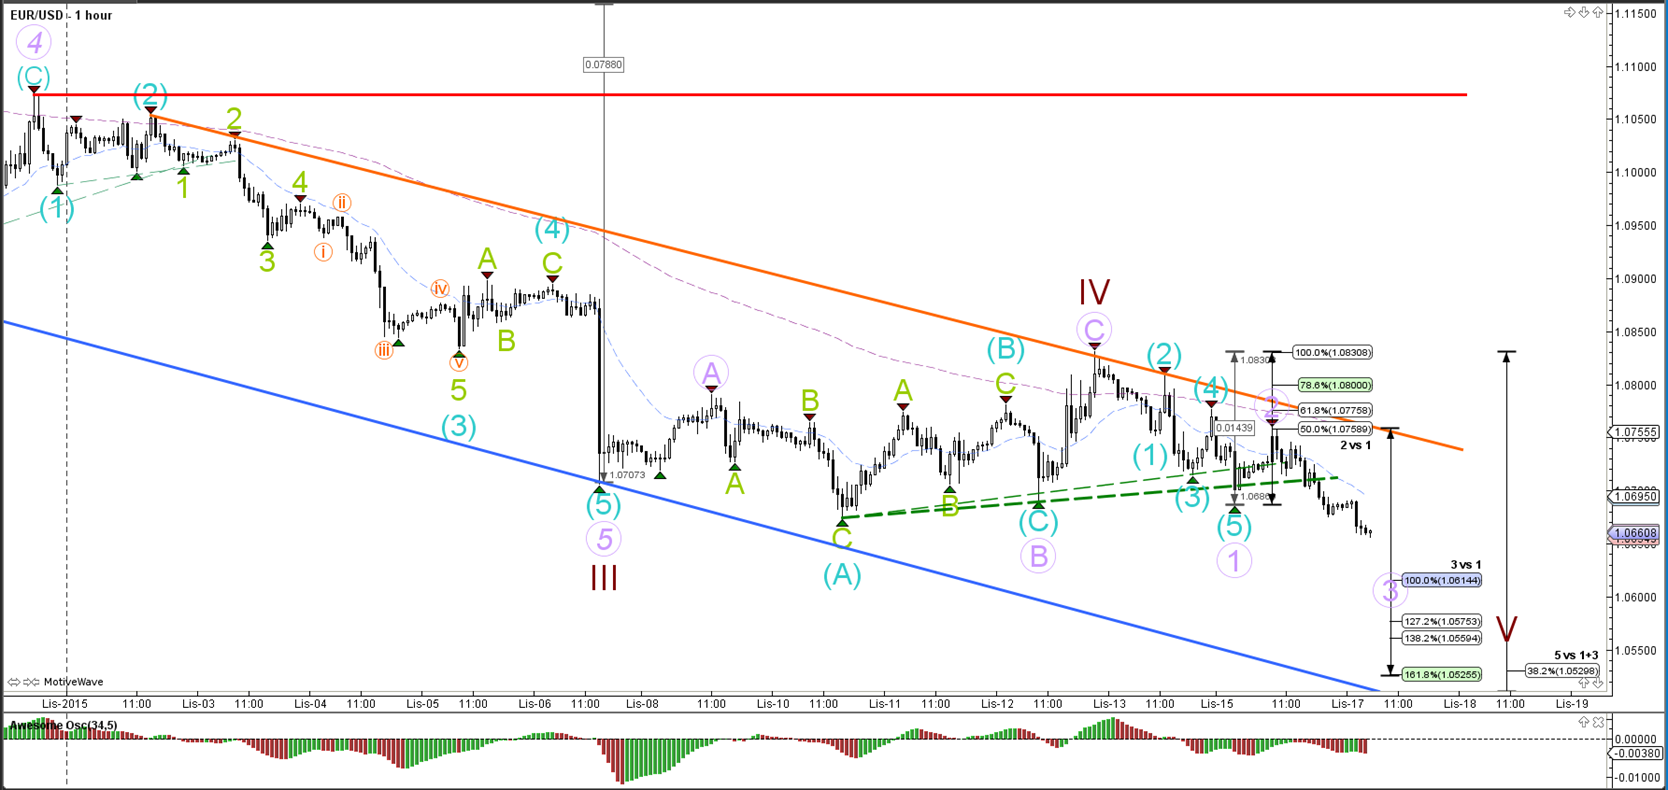
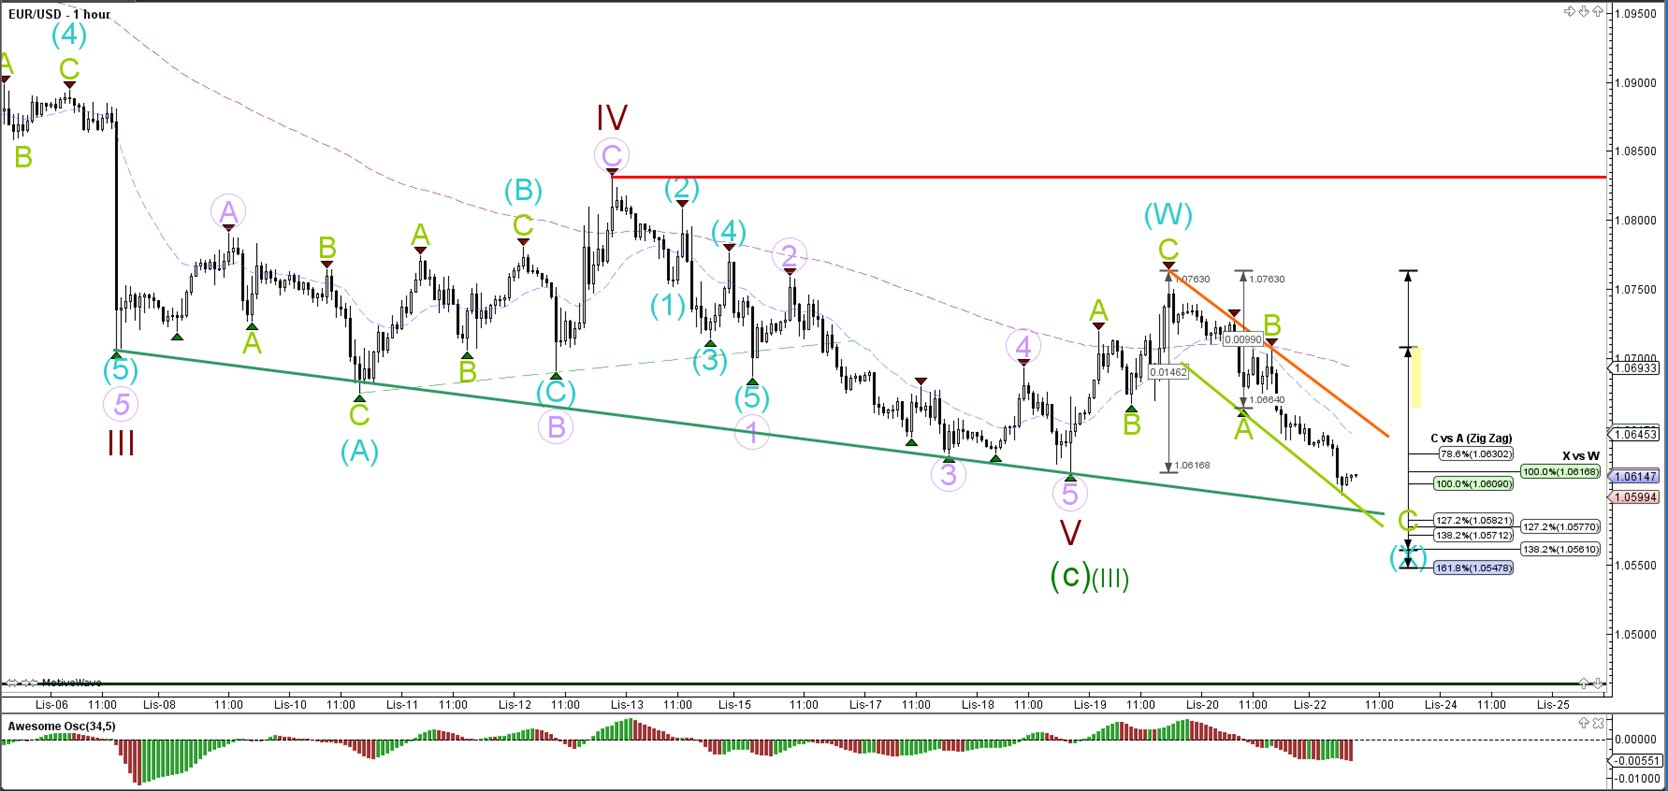
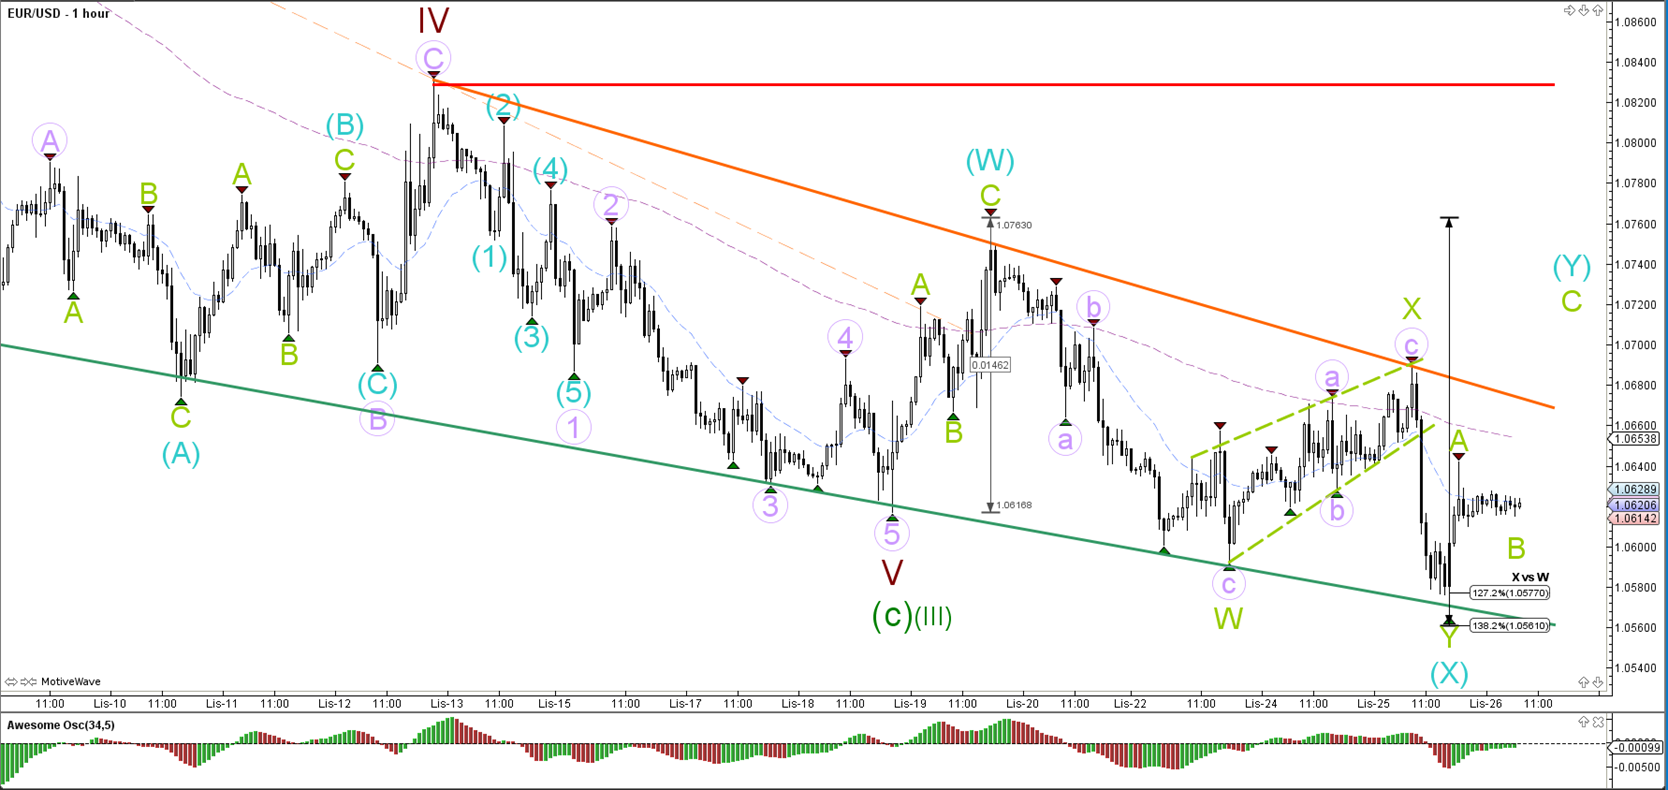
1 hour

The EUR/USD is back at the top of the channel near the resistance trend line (orange), which is a bounce or break spot. A bearish bounce could price move lower as part of the wave 5 (brown). A bullish break could mean that wave 5 has already been completed.
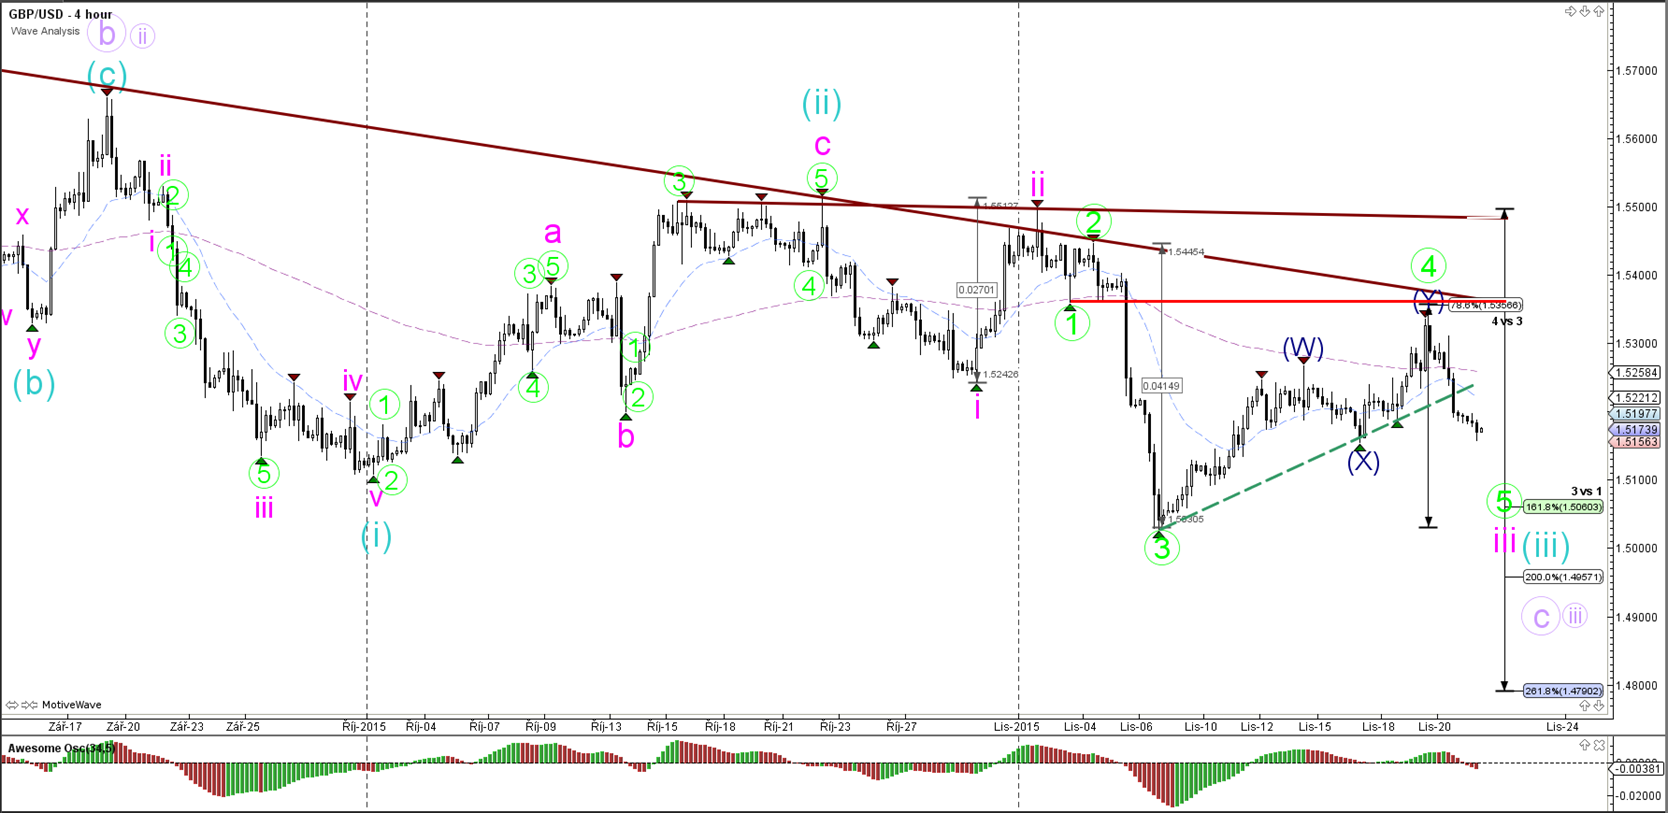
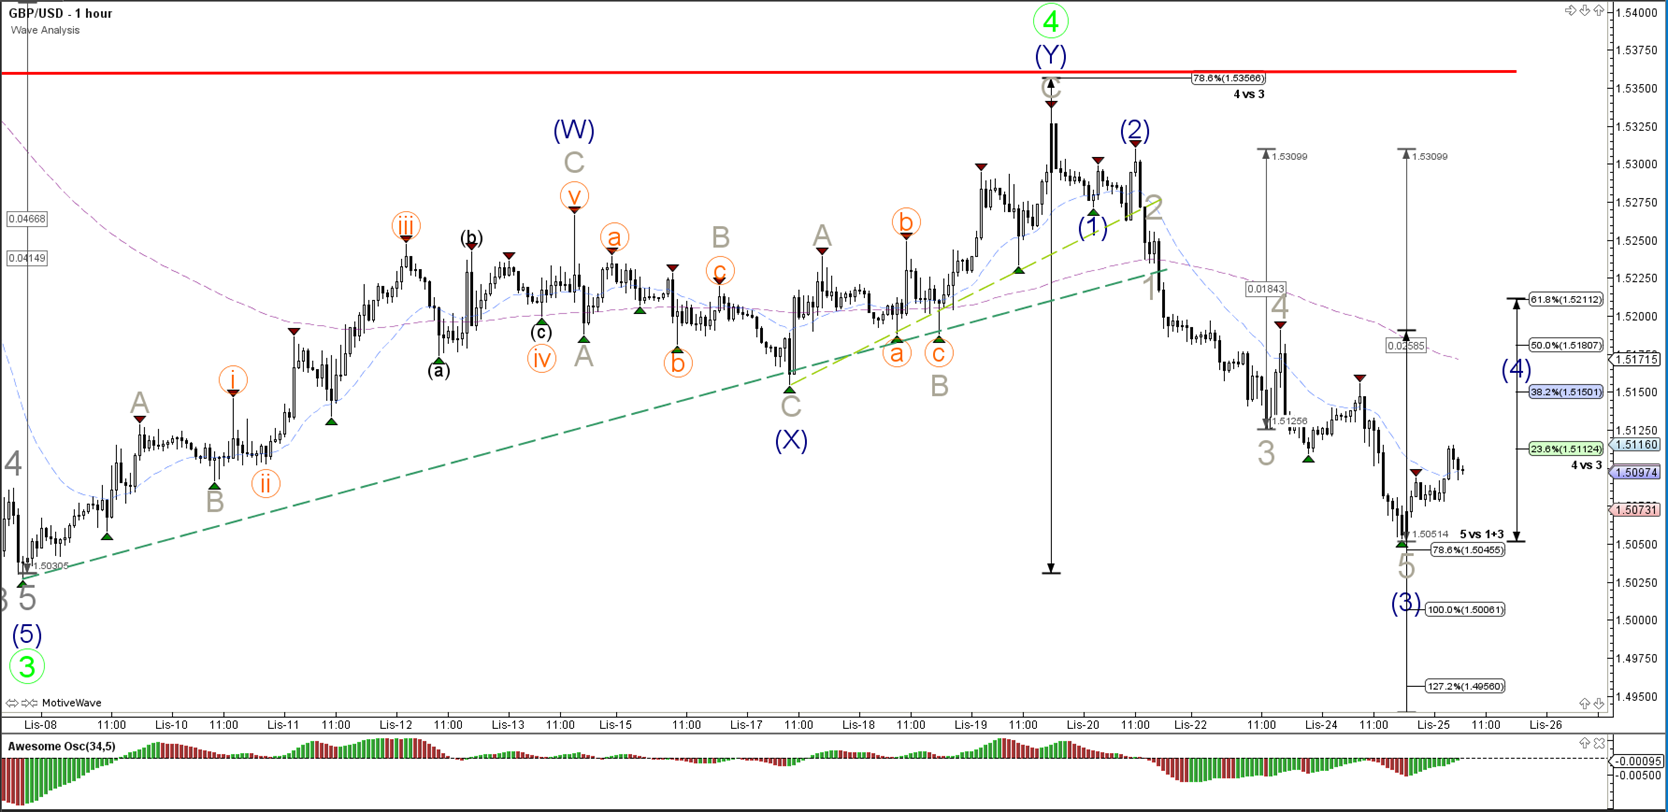
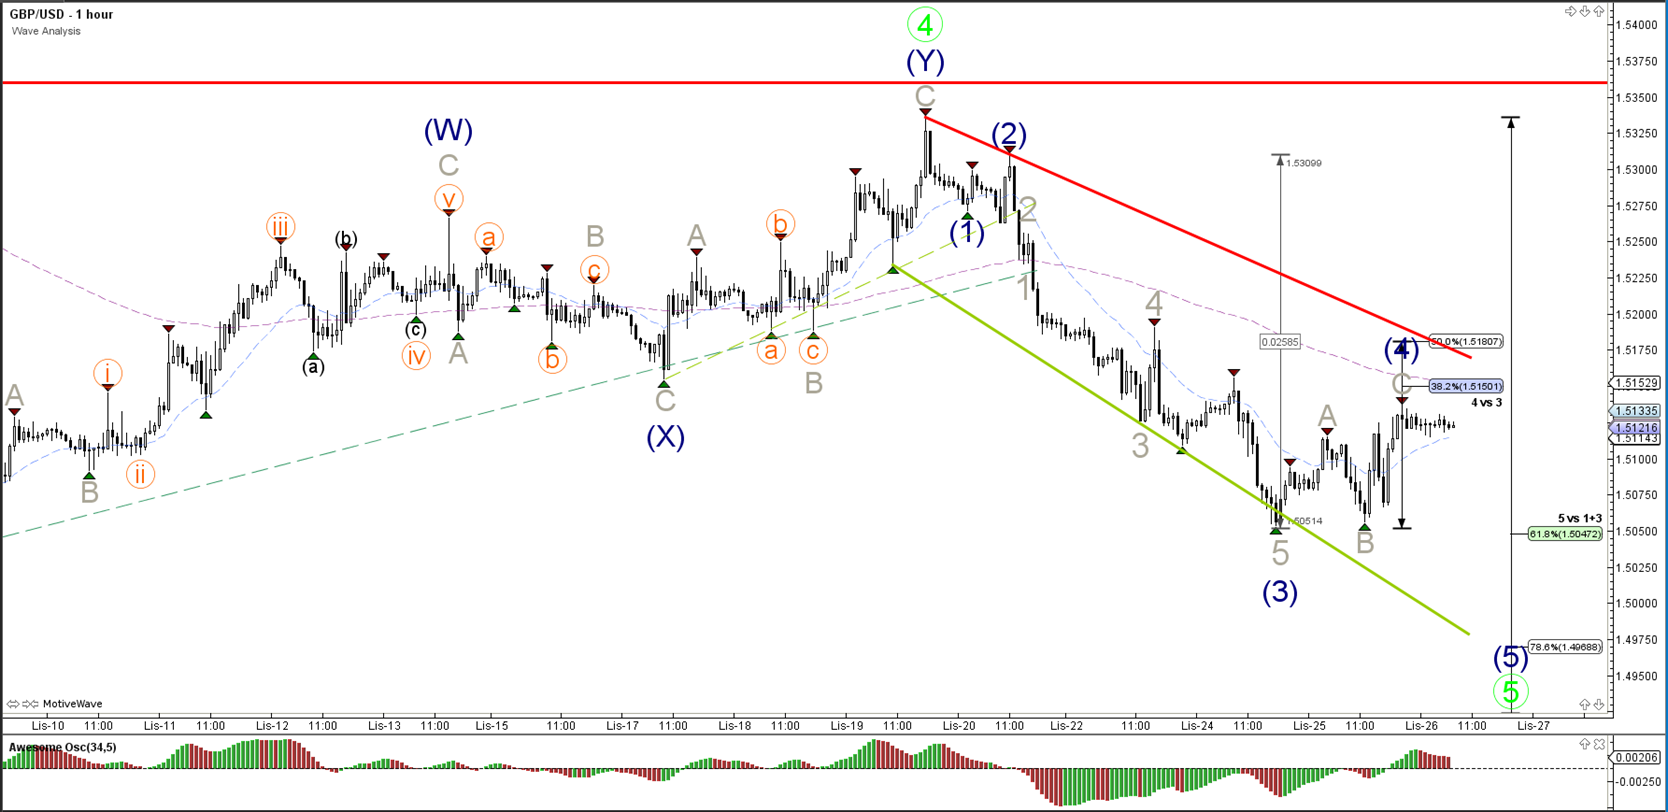
GBP/USD
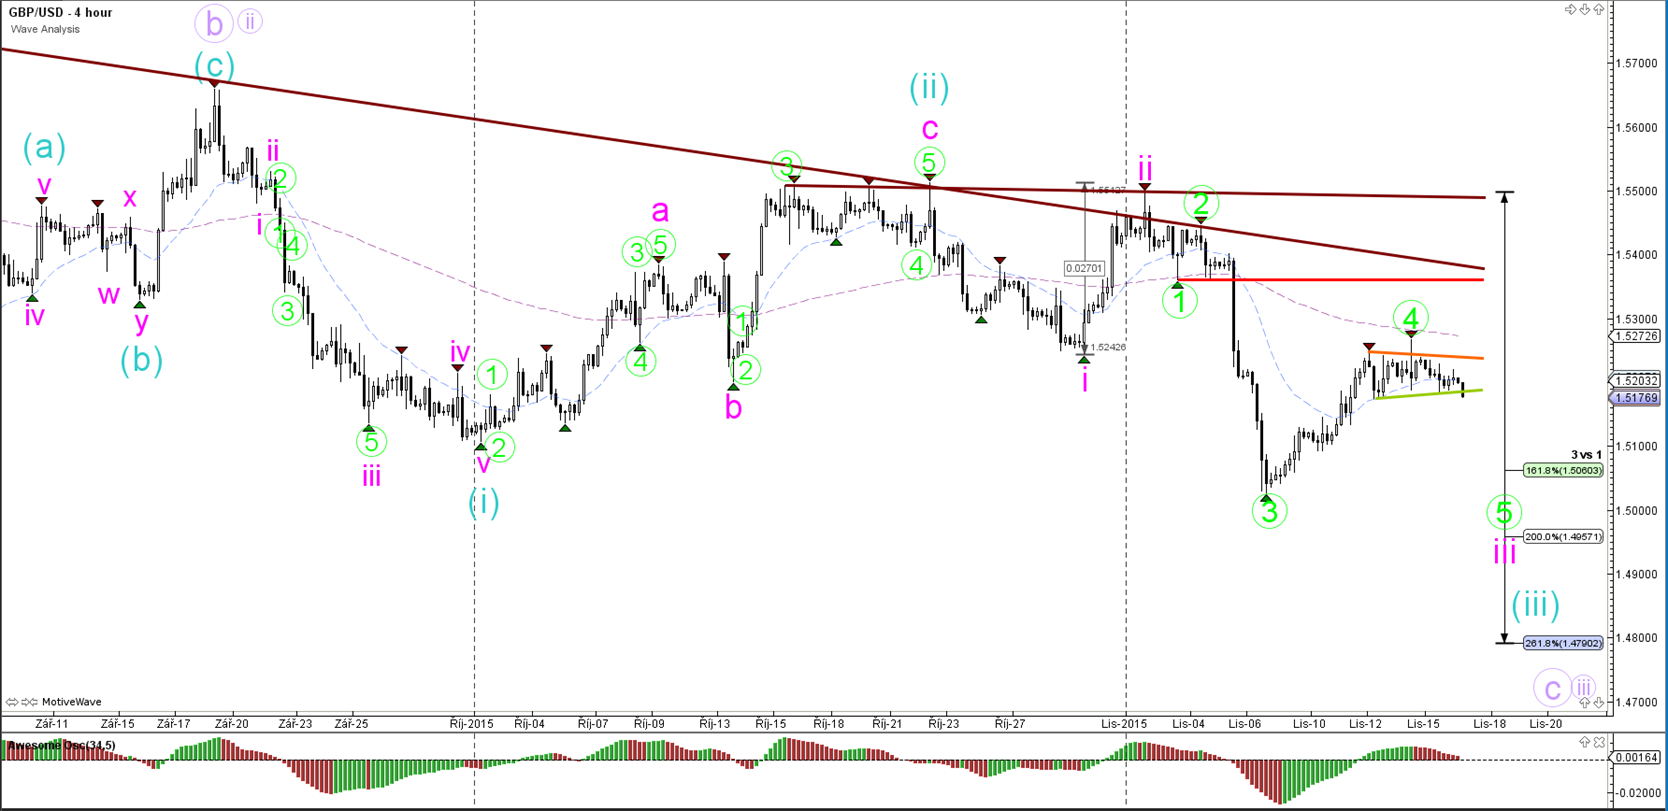
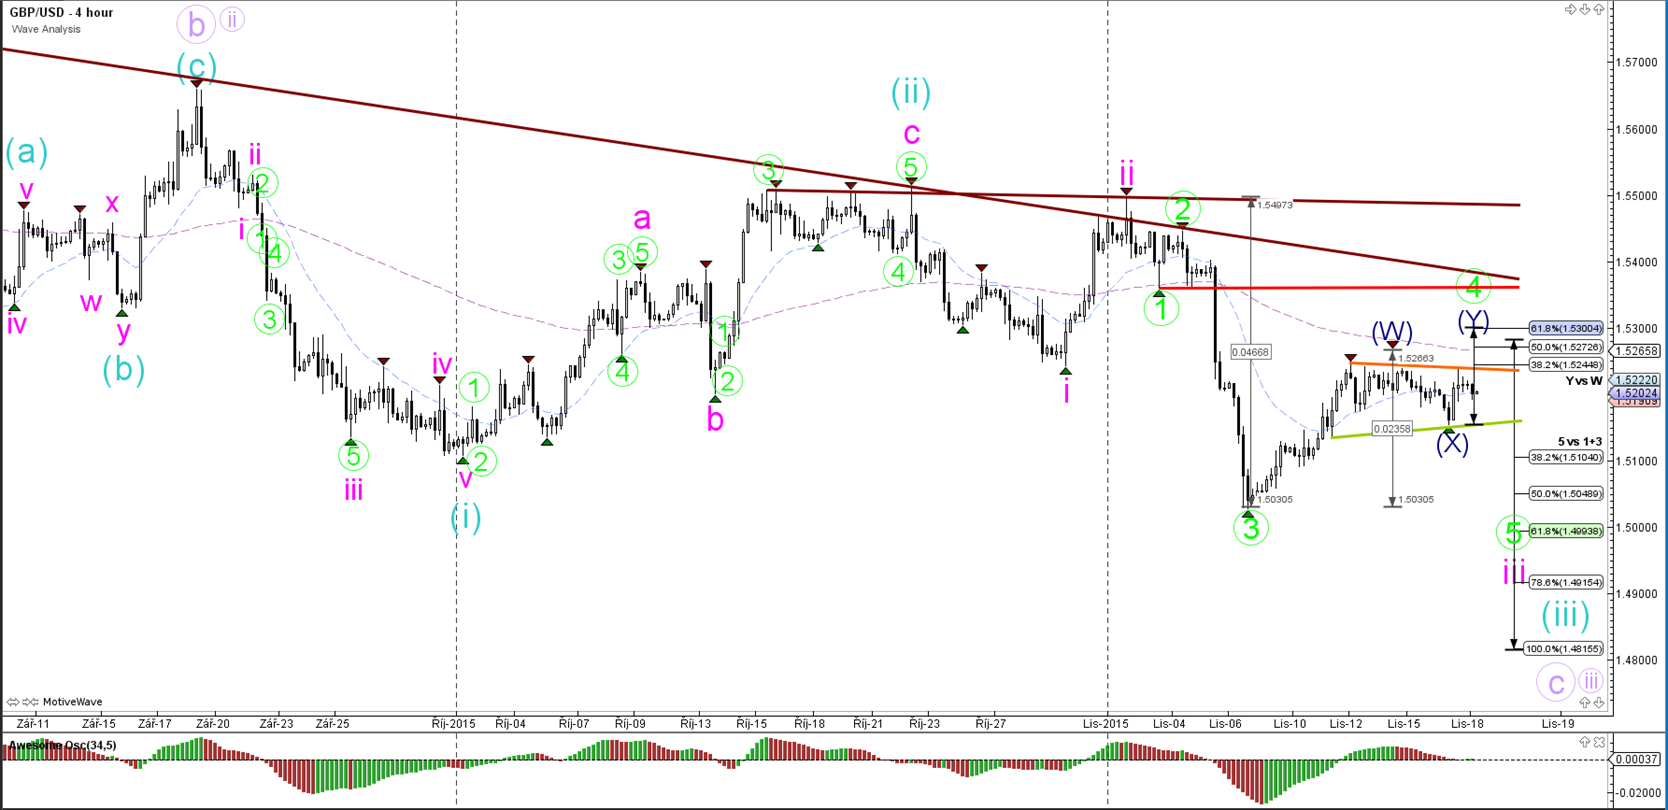
4 hour

The GBP/USD is in wave 4 (green) retracement and a break below support could see price head lower towards the waves 3 (pink/blue).
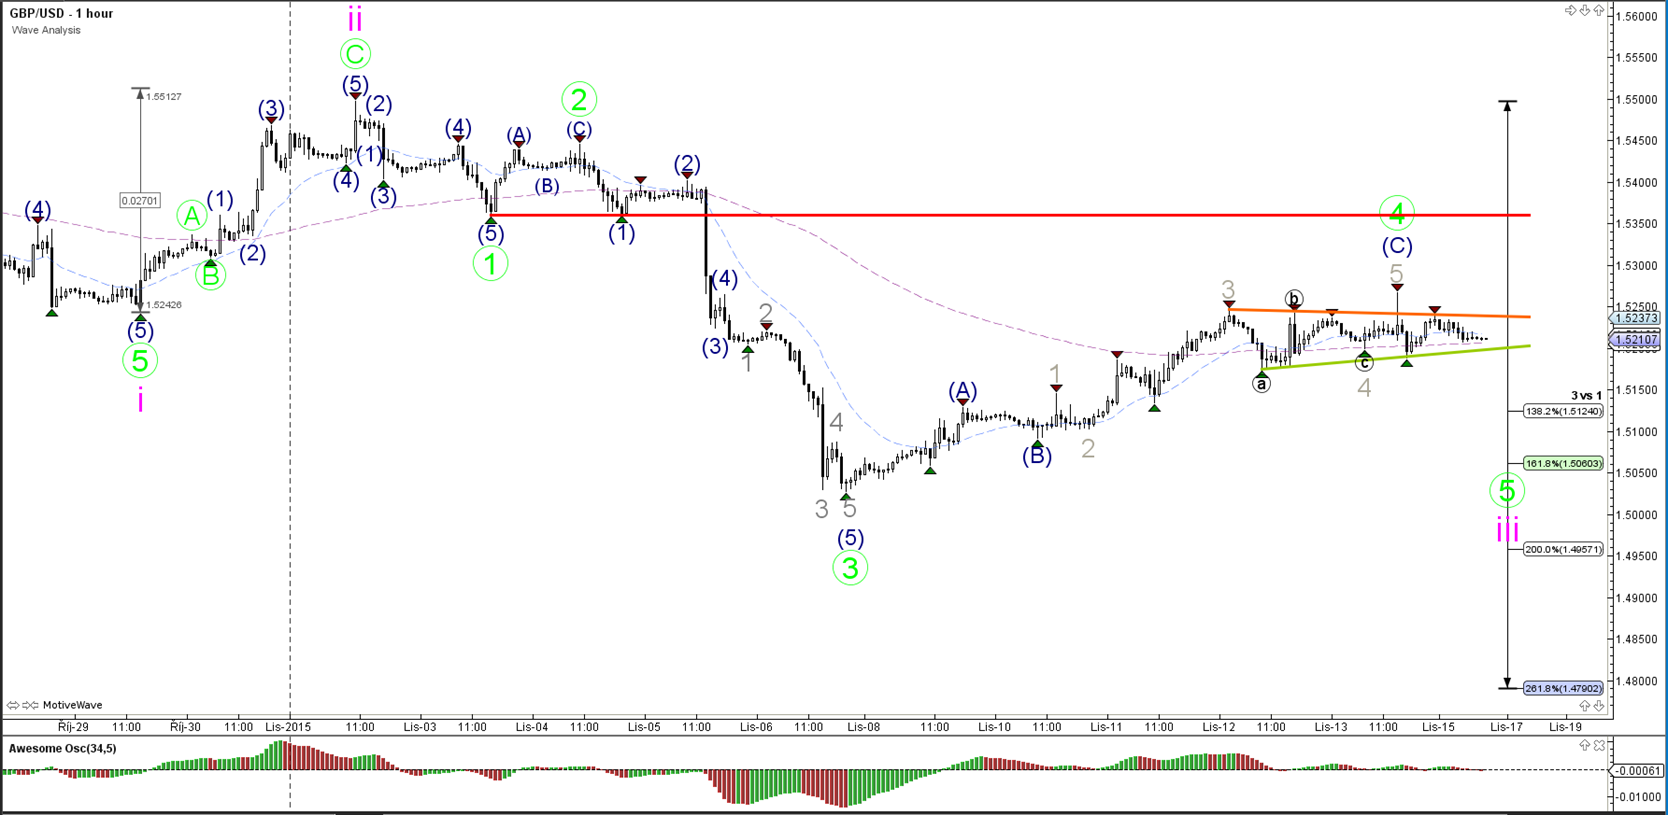
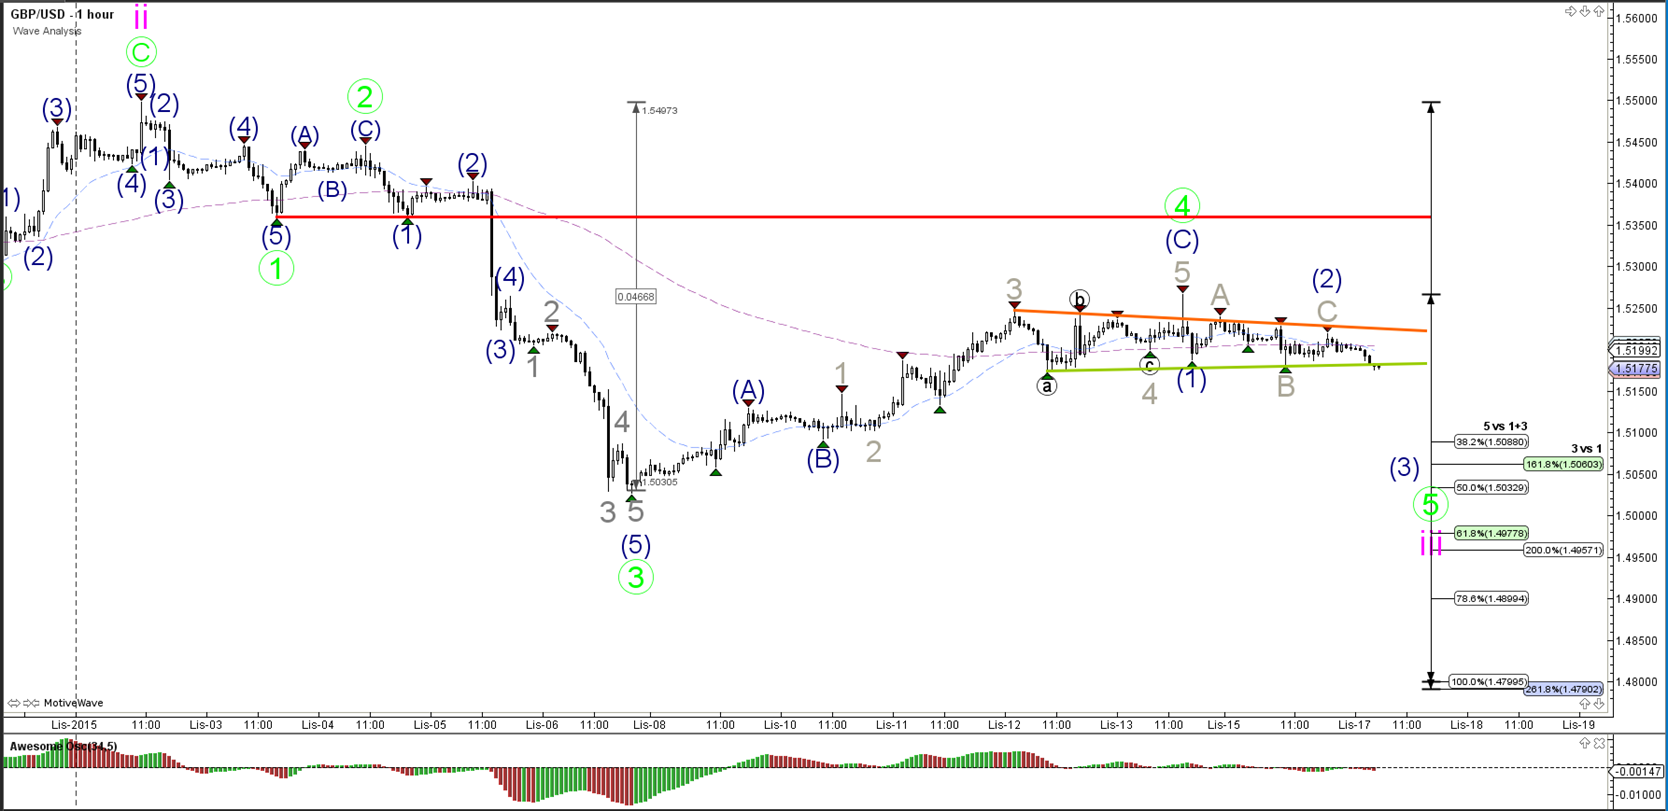
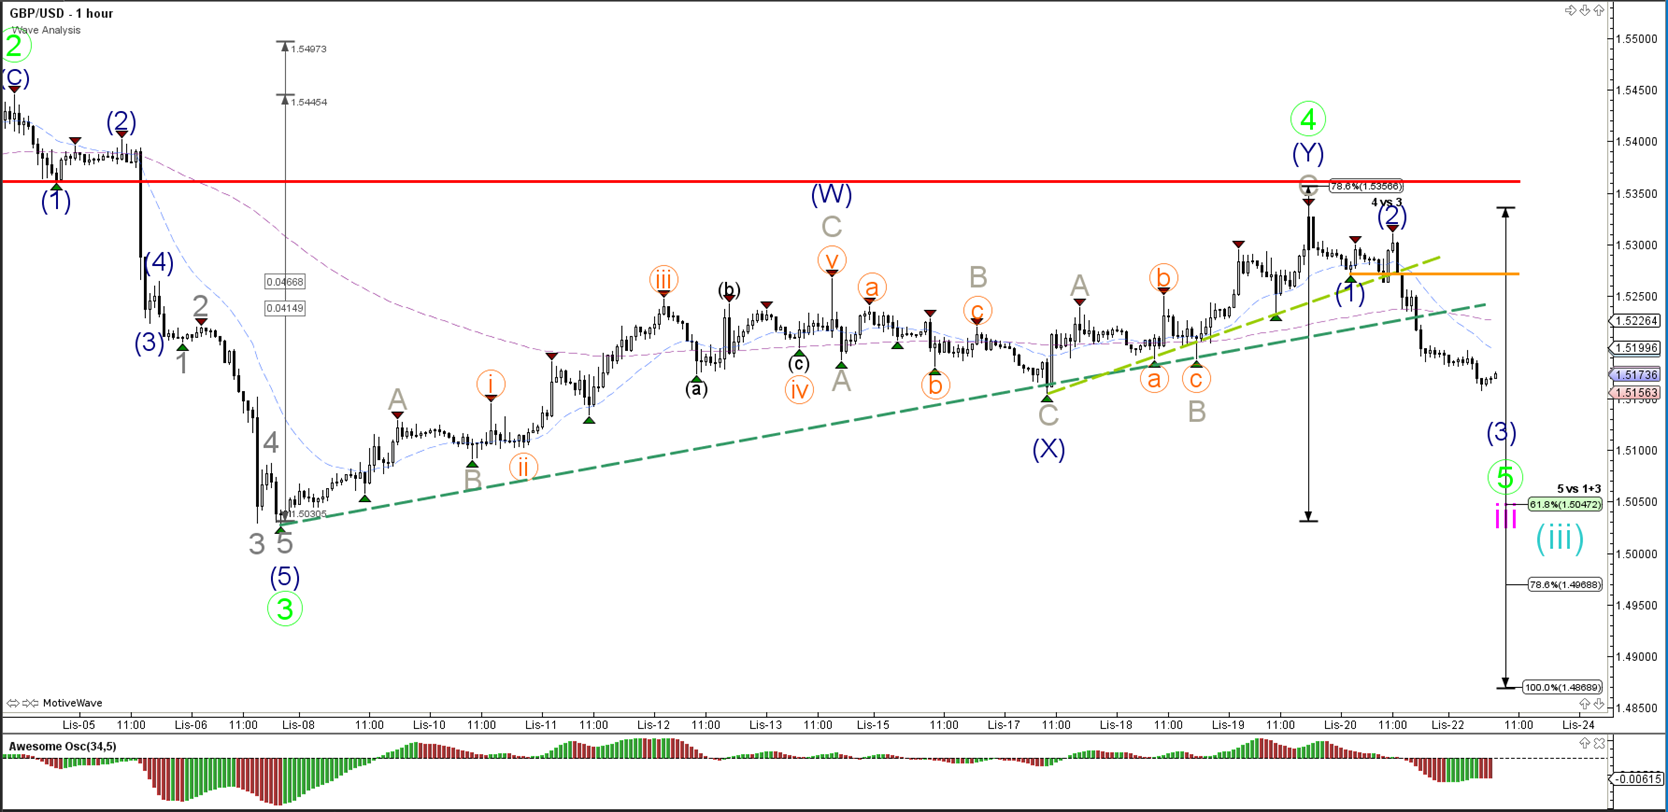
1 hour

The GBP/USD made a bullish impulse to complete a wave C (blue) most likely, which is part of a larger wave 4 (green) correction and retracement. A break below the support trend line (green) could start the wave 5 whereas a break above the resistance trend line (orange) and 50% Fibonacci level invalidates the current wave structure.
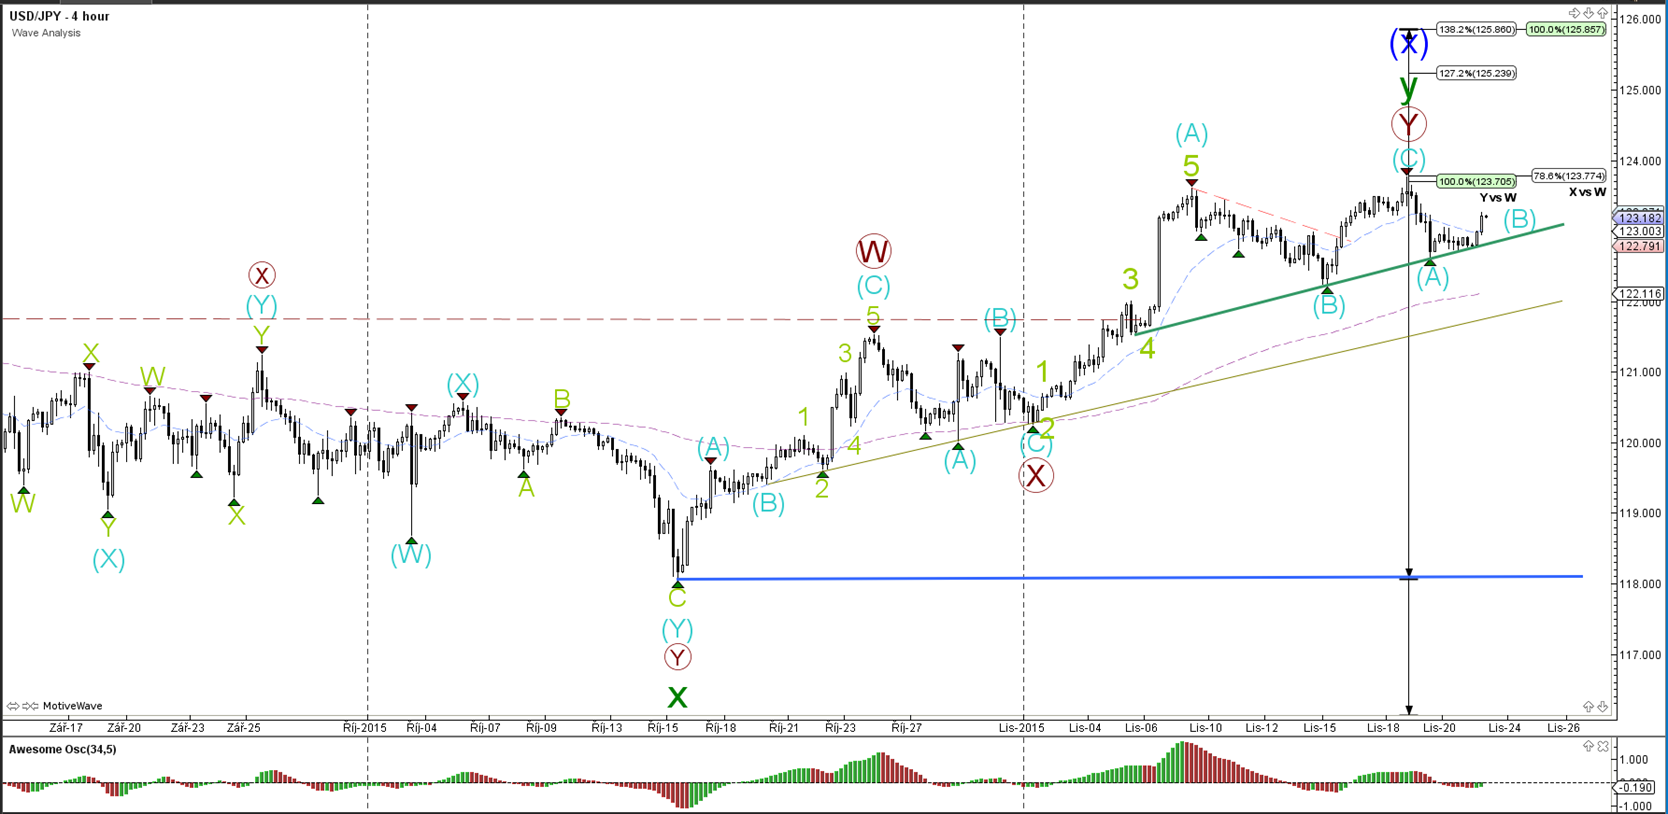
USD/JPY
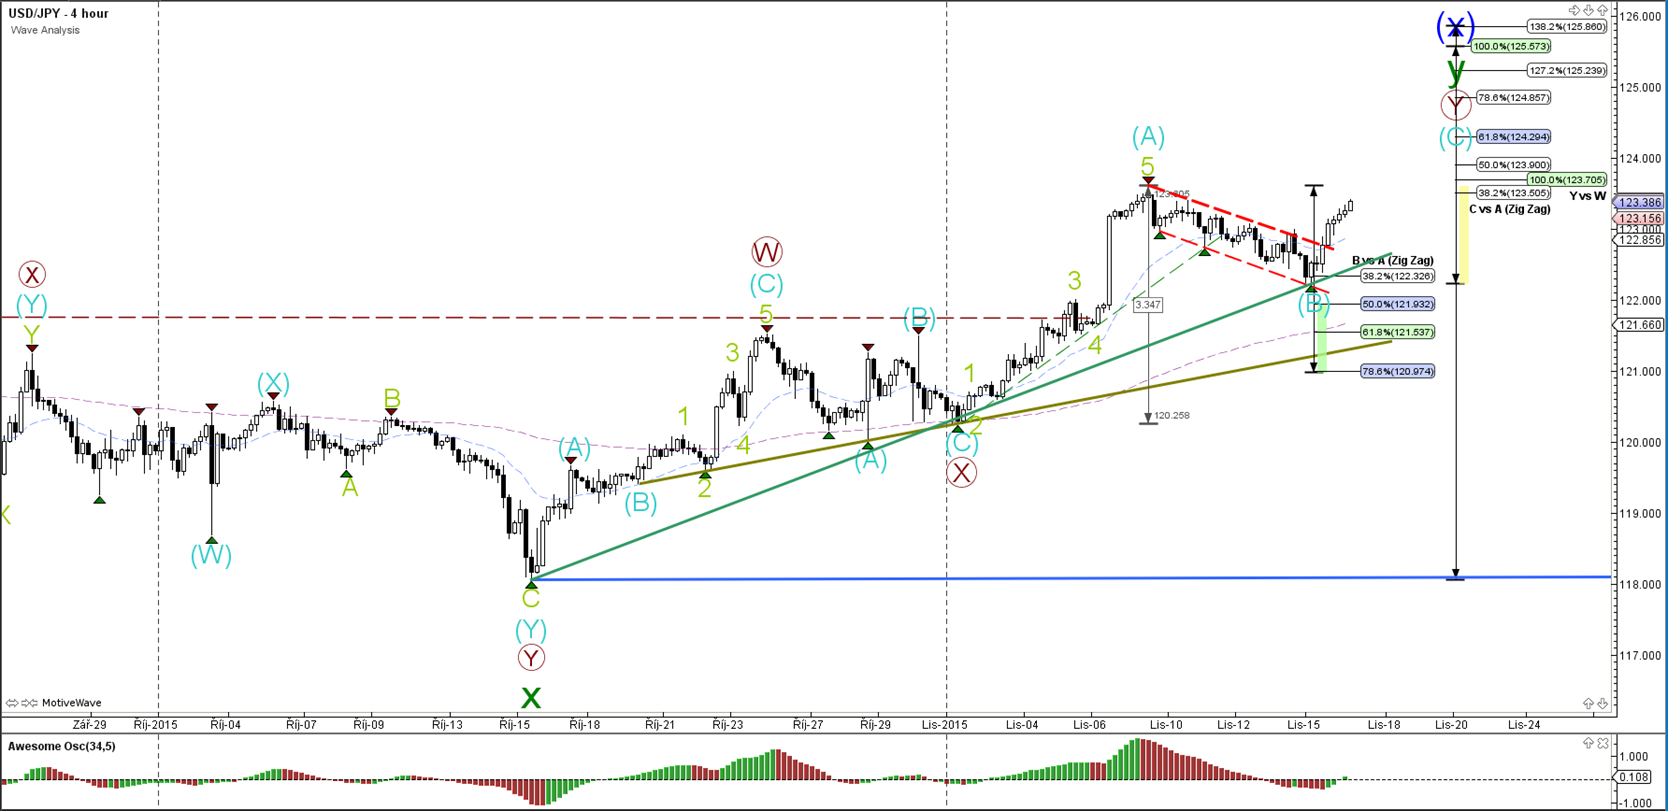
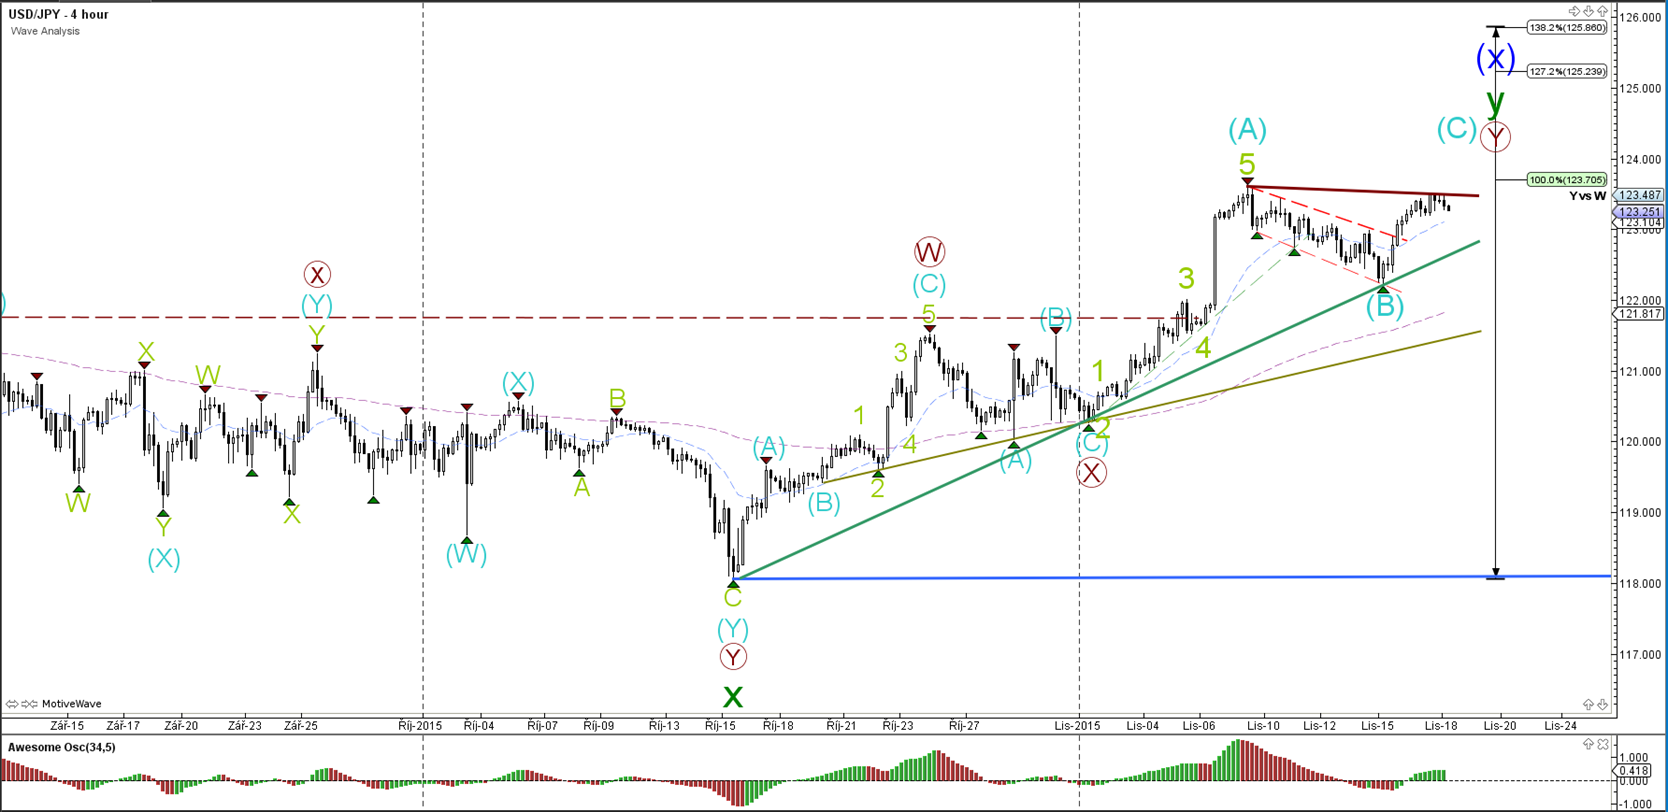
4 hour

The USD/JPY has retraced back to the support trend line (green), which will be a bounce or break moment (see 1 hour chart).
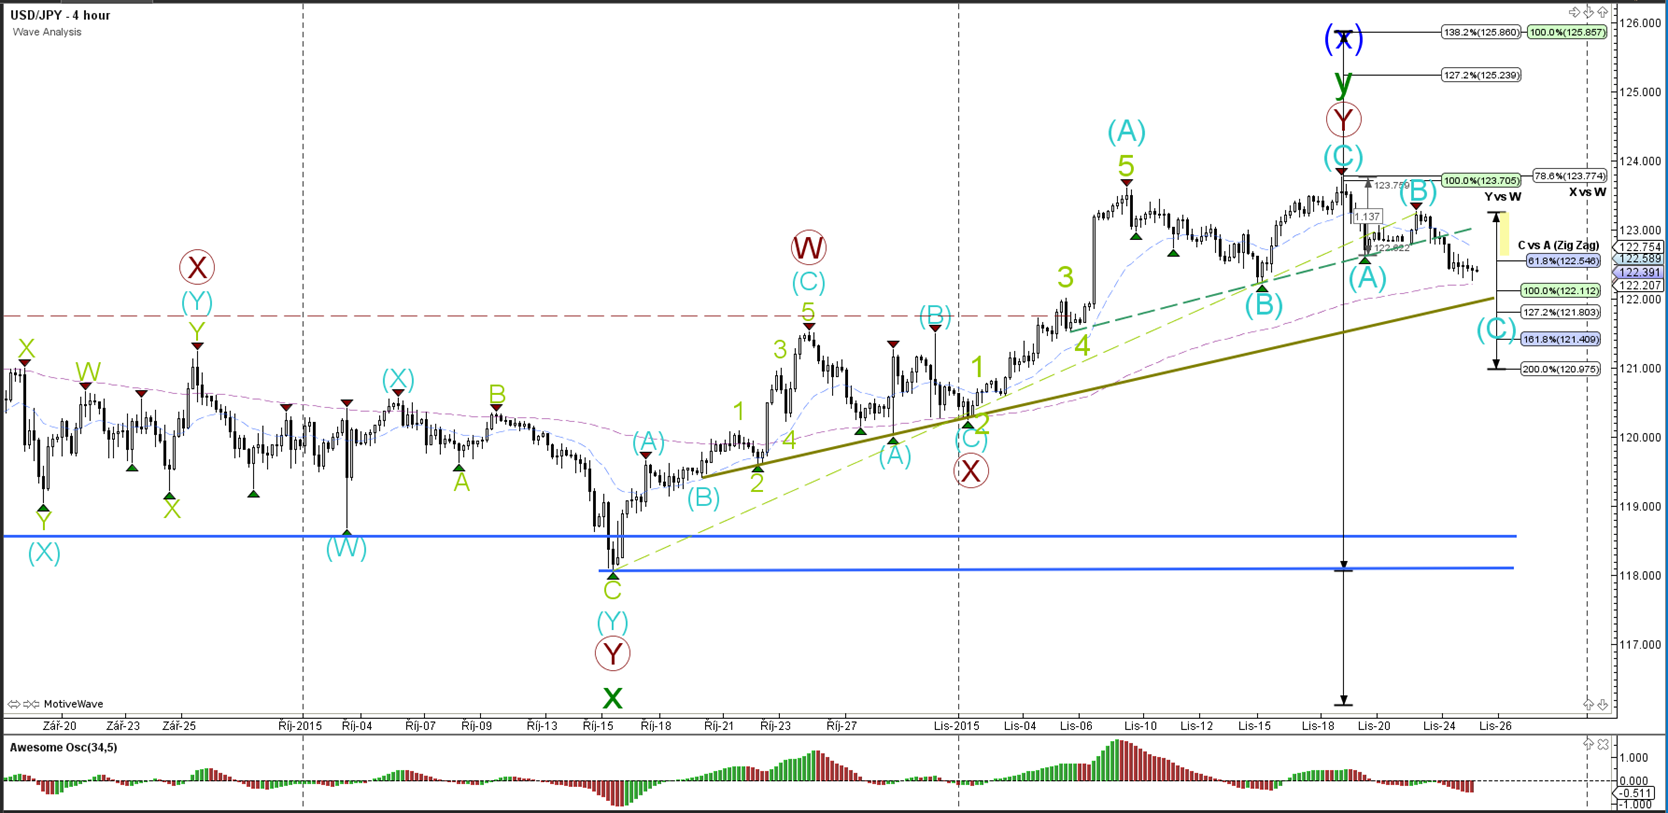
1 hour

The USD/JPY could still be in a wave 4 (orange) pattern if price stays above the support trend line (green). A bullish bounce could see price move higher to complete wave 5 (orange/green) of wave A (blue). A bearish break means that wave A (blue) was already completed at the previous top and that price could be retracing lower for wave B (blue).
EUR/USD
4 hour
The EUR/USD is in a wave 4 (brown) correction. The wave count is invalidated if price manages to break above the 50% Fibonacci retracement level.
1 hour
The EUR/USD is back at the top of the channel near the resistance trend line (orange), which is a bounce or break spot. A bearish bounce could price move lower as part of the wave 5 (brown). A bullish break could mean that wave 5 has already been completed.
GBP/USD
4 hour
The GBP/USD is in wave 4 (green) retracement and a break below support could see price head lower towards the waves 3 (pink/blue).
1 hour
The GBP/USD made a bullish impulse to complete a wave C (blue) most likely, which is part of a larger wave 4 (green) correction and retracement. A break below the support trend line (green) could start the wave 5 whereas a break above the resistance trend line (orange) and 50% Fibonacci level invalidates the current wave structure.
USD/JPY
4 hour
The USD/JPY has retraced back to the support trend line (green), which will be a bounce or break moment (see 1 hour chart).
1 hour
The USD/JPY could still be in a wave 4 (orange) pattern if price stays above the support trend line (green). A bullish bounce could see price move higher to complete wave 5 (orange/green) of wave A (blue). A bearish break means that wave A (blue) was already completed at the previous top and that price could be retracing lower for wave B (blue).