FxGrow Support
Recruit
- Messages
- 58
FxGrow Daily Technical Analysis – 25th Nov, 2015
By FxGrow Research & Analysis Team
EURUSD below 1.0600 - getting closer to test of this year's low
Today's macro data series from the US economy led to a further strengthening of the dollar. Published data of durable goods orders are better that expected and US citizens income raised month to month. What is more, jobless claims fell by 13000.
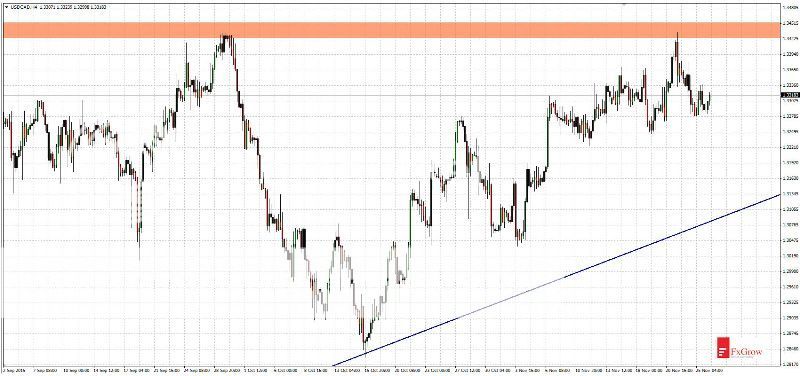
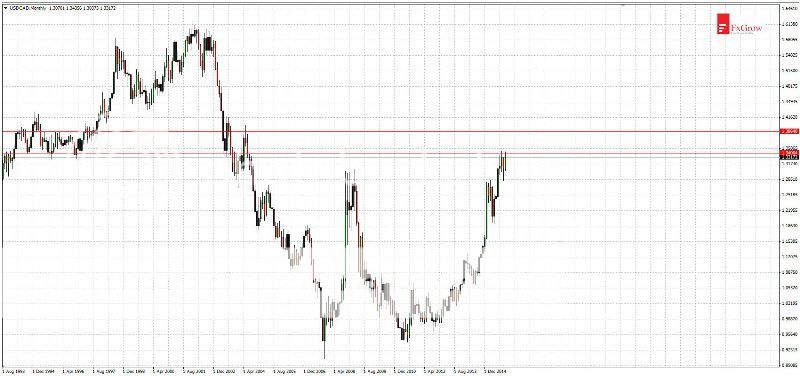
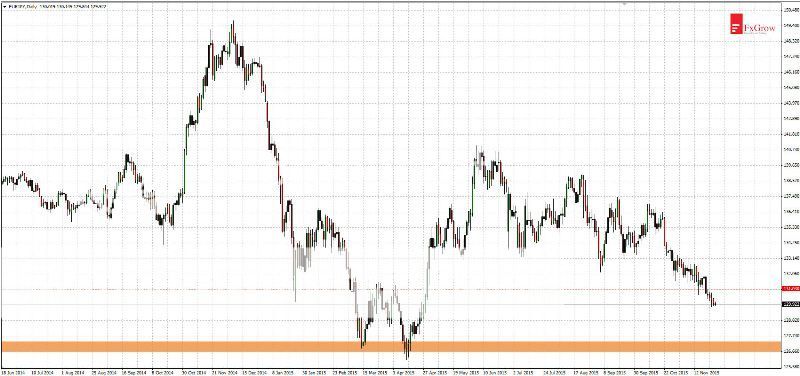
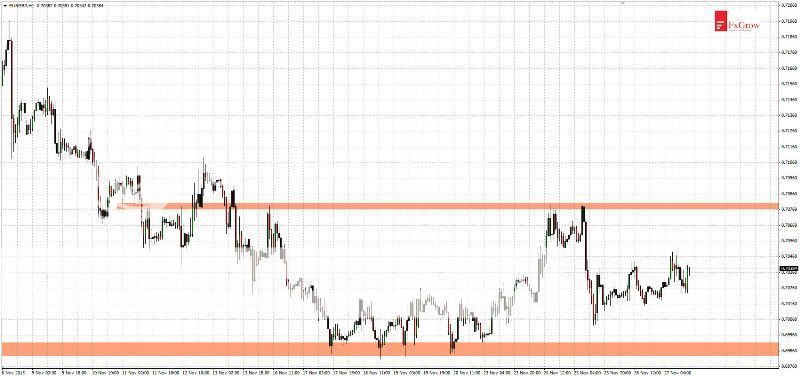
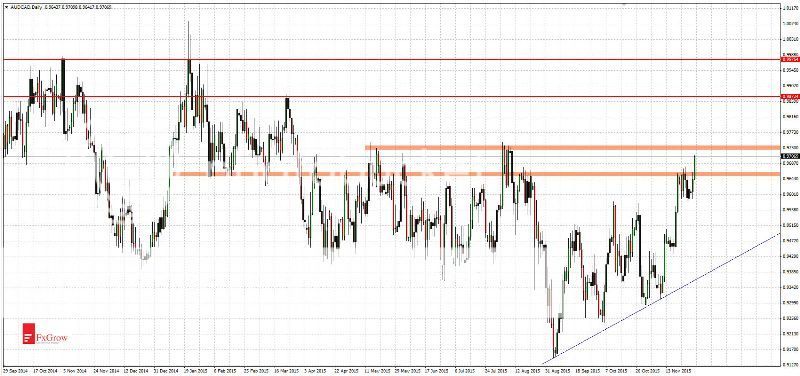
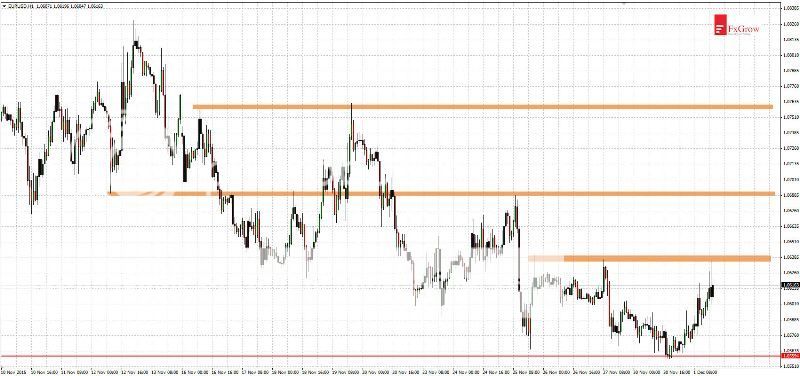
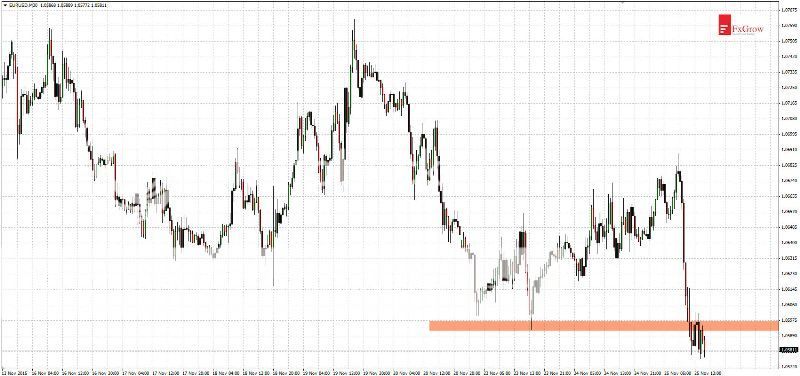
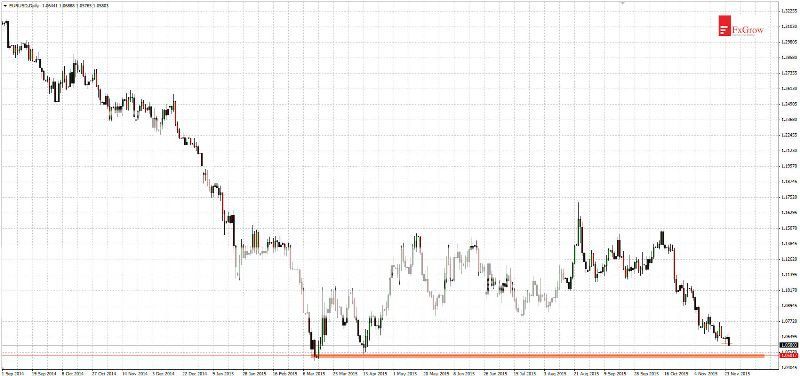
It is another week when EURUSD deepens its lows. And it's hard to think about bigger rebound while low of this year wasn't tested again. Target for declines is at level 1.0500 and there should be rebound. Because for a quite long time EURUSD falls without any correction. If there will be rebound nearest resistances are at levels: 1.0600, 1.0680, 1.0730.
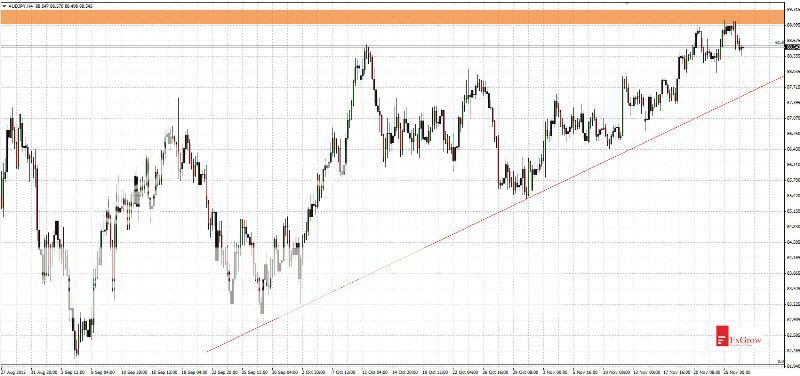
Time-frame M30:
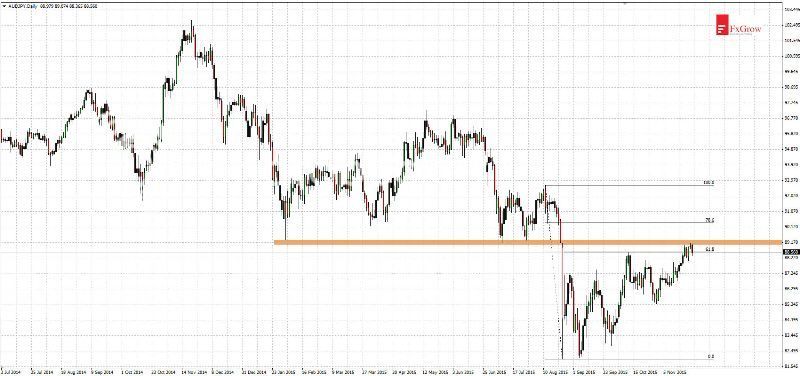
Time-frame D1:
For more in depth Research & Analysis please visit FxGrowhttps://secure.fxgrow.com/b.php?cid...yb3cuY29tL3Byb21vX2RldGFpbHMucGhwP2Fkc19pZD02.
Note: This analysis is intended to provide general information and does not constitute the provision of INVESTMENT ADVICE. Investors should, before acting on this information, consider the appropriateness of this information having regard to their personal objectives, financial situation or needs. We recommend investors obtain investment advice specific to their situation before making any financial investment decision.
By FxGrow Research & Analysis Team
EURUSD below 1.0600 - getting closer to test of this year's low
Today's macro data series from the US economy led to a further strengthening of the dollar. Published data of durable goods orders are better that expected and US citizens income raised month to month. What is more, jobless claims fell by 13000.
It is another week when EURUSD deepens its lows. And it's hard to think about bigger rebound while low of this year wasn't tested again. Target for declines is at level 1.0500 and there should be rebound. Because for a quite long time EURUSD falls without any correction. If there will be rebound nearest resistances are at levels: 1.0600, 1.0680, 1.0730.
Time-frame M30:
Time-frame D1:
For more in depth Research & Analysis please visit FxGrowhttps://secure.fxgrow.com/b.php?cid...yb3cuY29tL3Byb21vX2RldGFpbHMucGhwP2Fkc19pZD02.
Note: This analysis is intended to provide general information and does not constitute the provision of INVESTMENT ADVICE. Investors should, before acting on this information, consider the appropriateness of this information having regard to their personal objectives, financial situation or needs. We recommend investors obtain investment advice specific to their situation before making any financial investment decision.