Admiral Markets
AdmiralMarkets.com Representative
- Messages
- 95
EUR/USD & GBP/USD Downtrend Channels Remain Intact
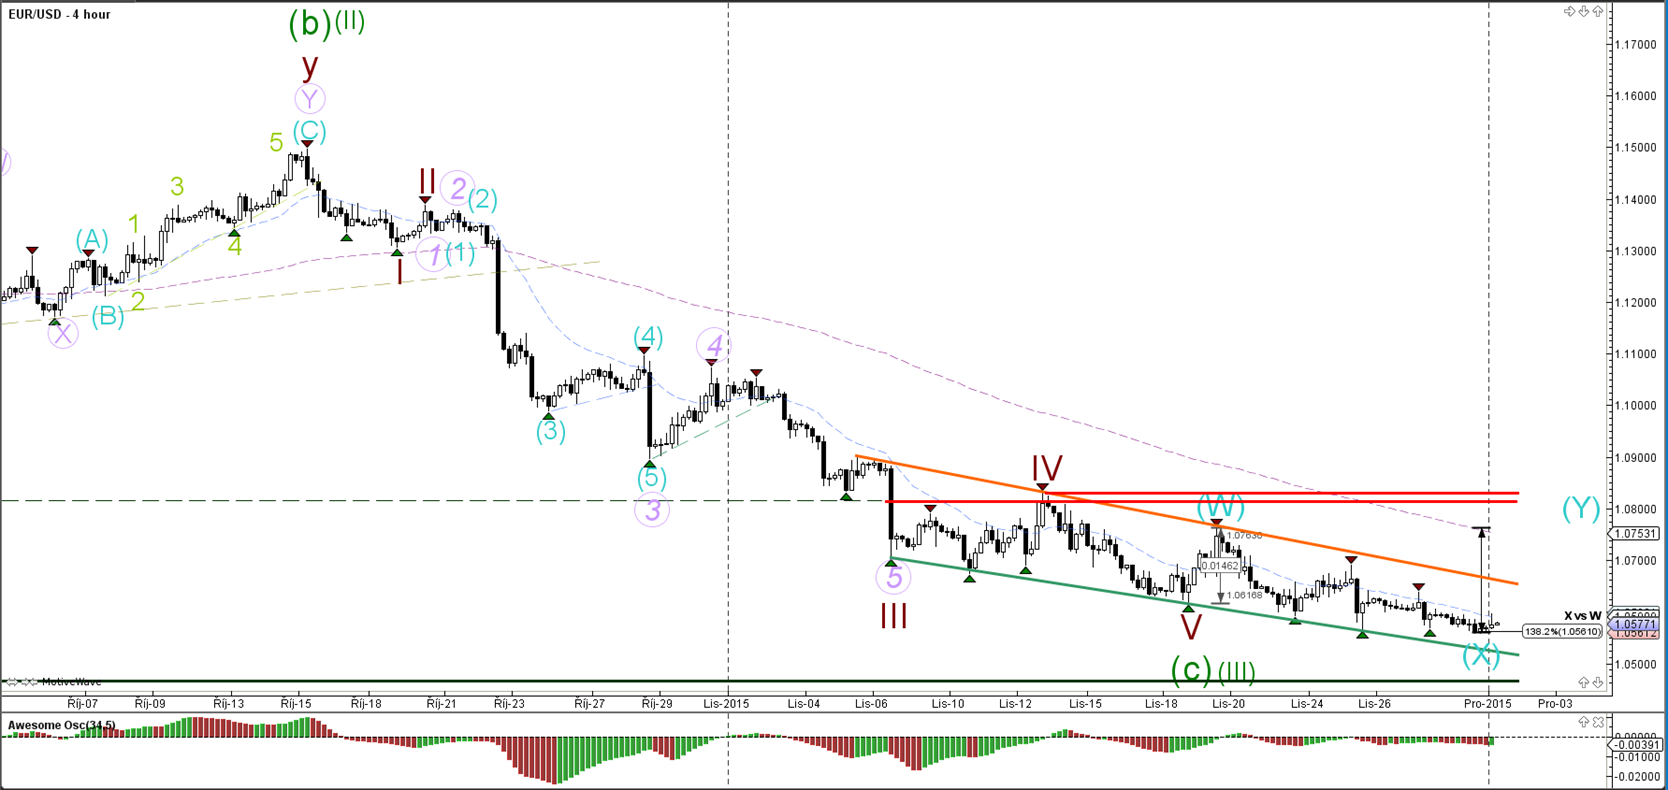
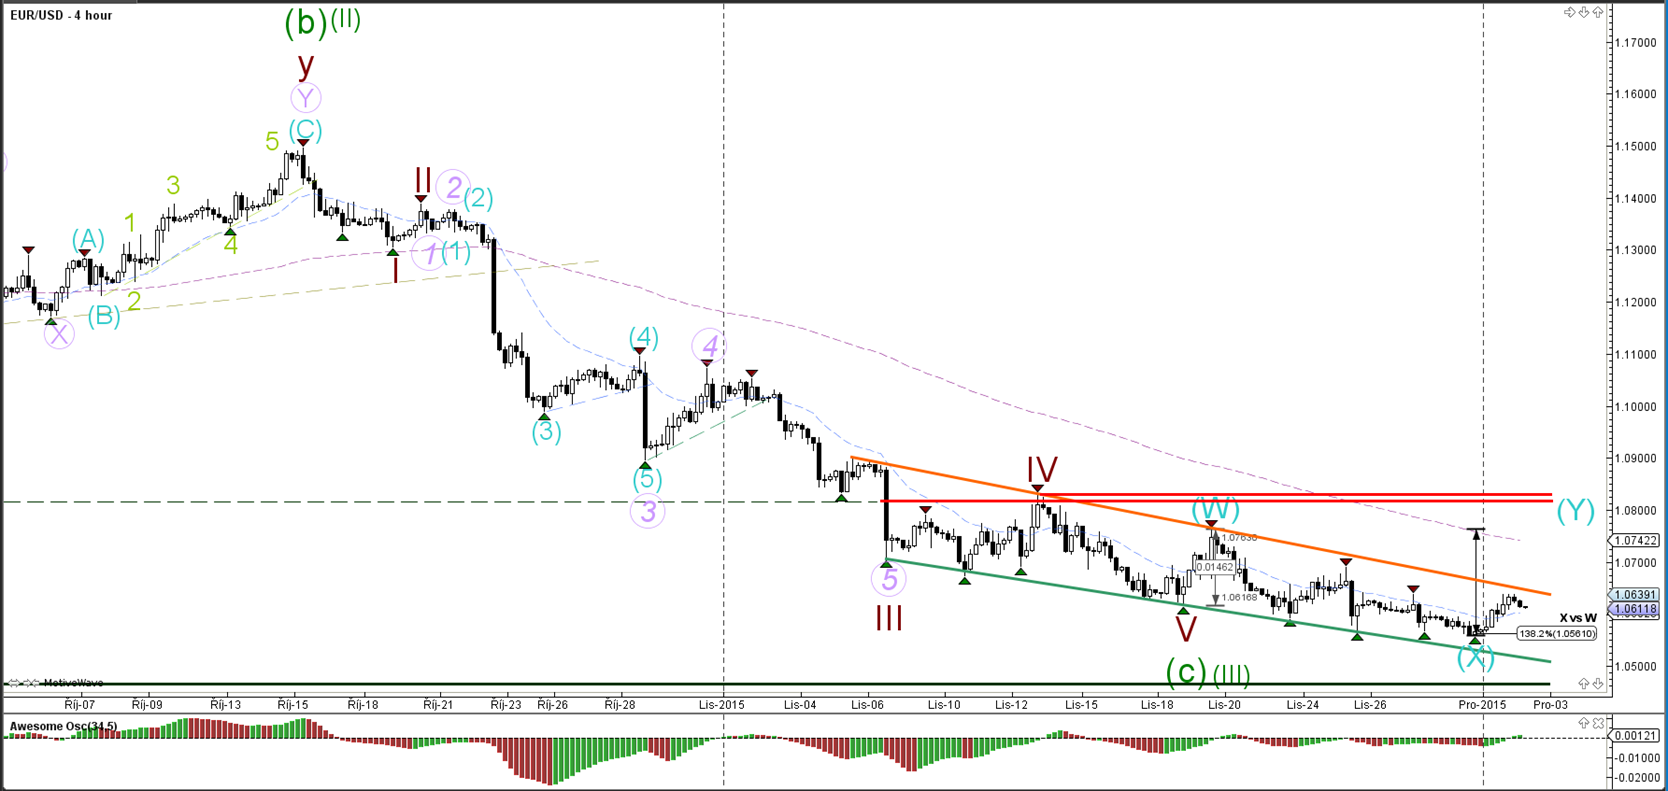
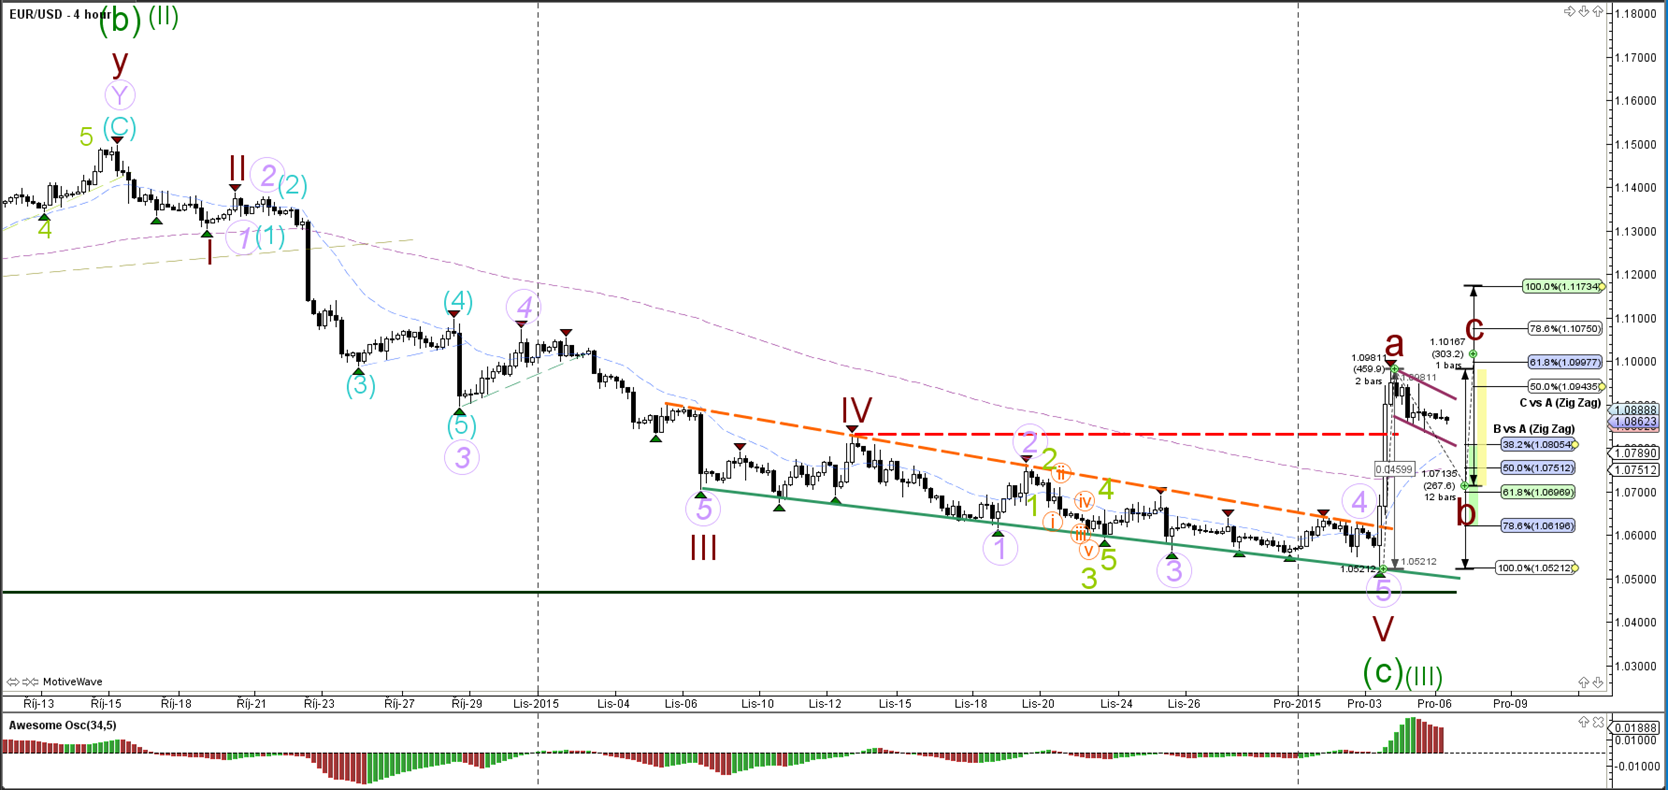
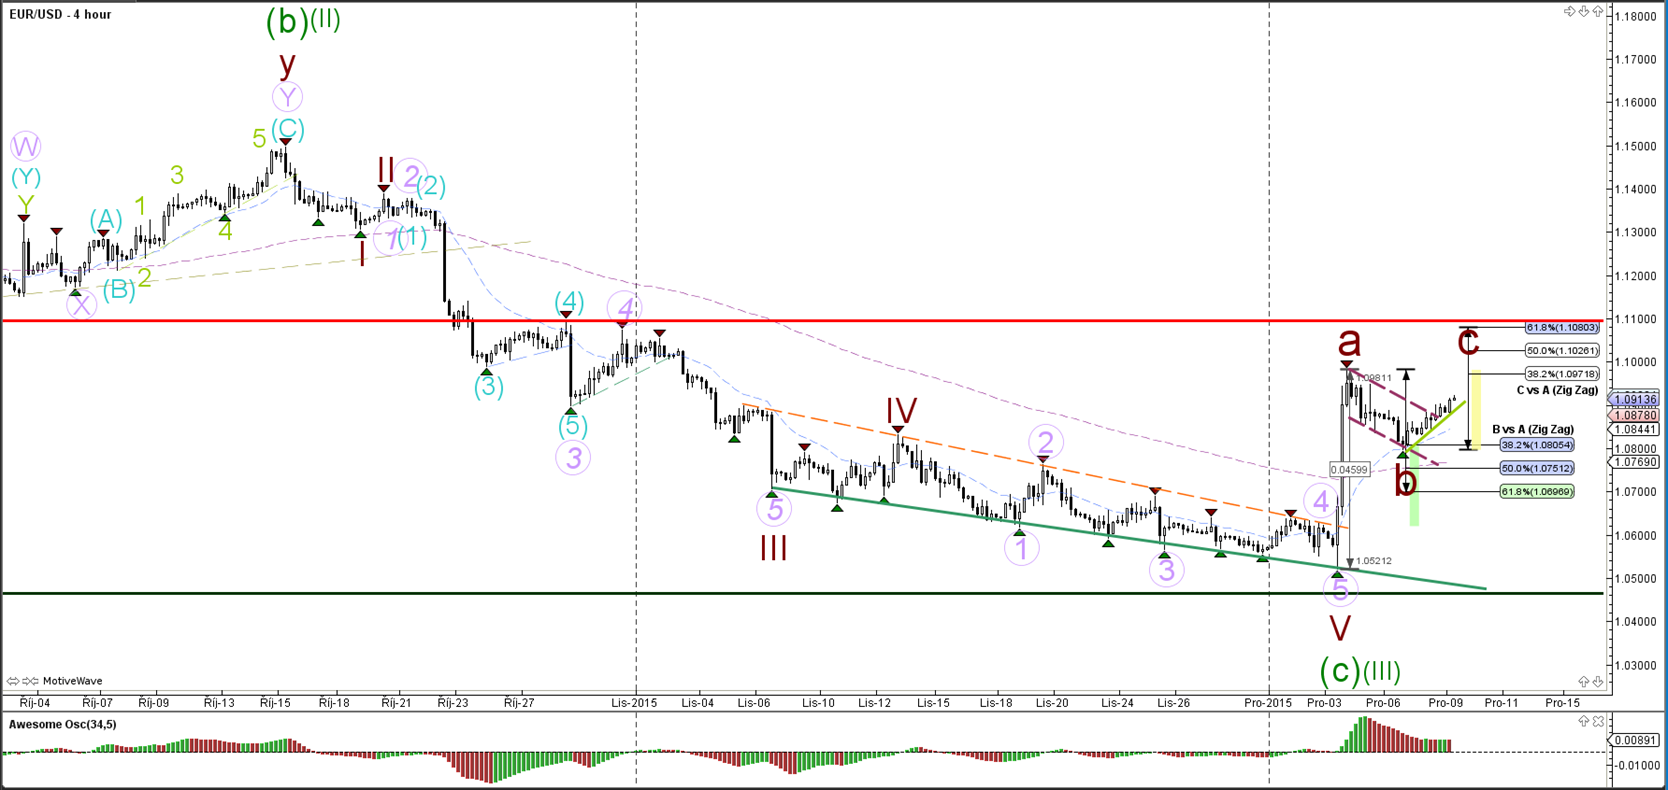
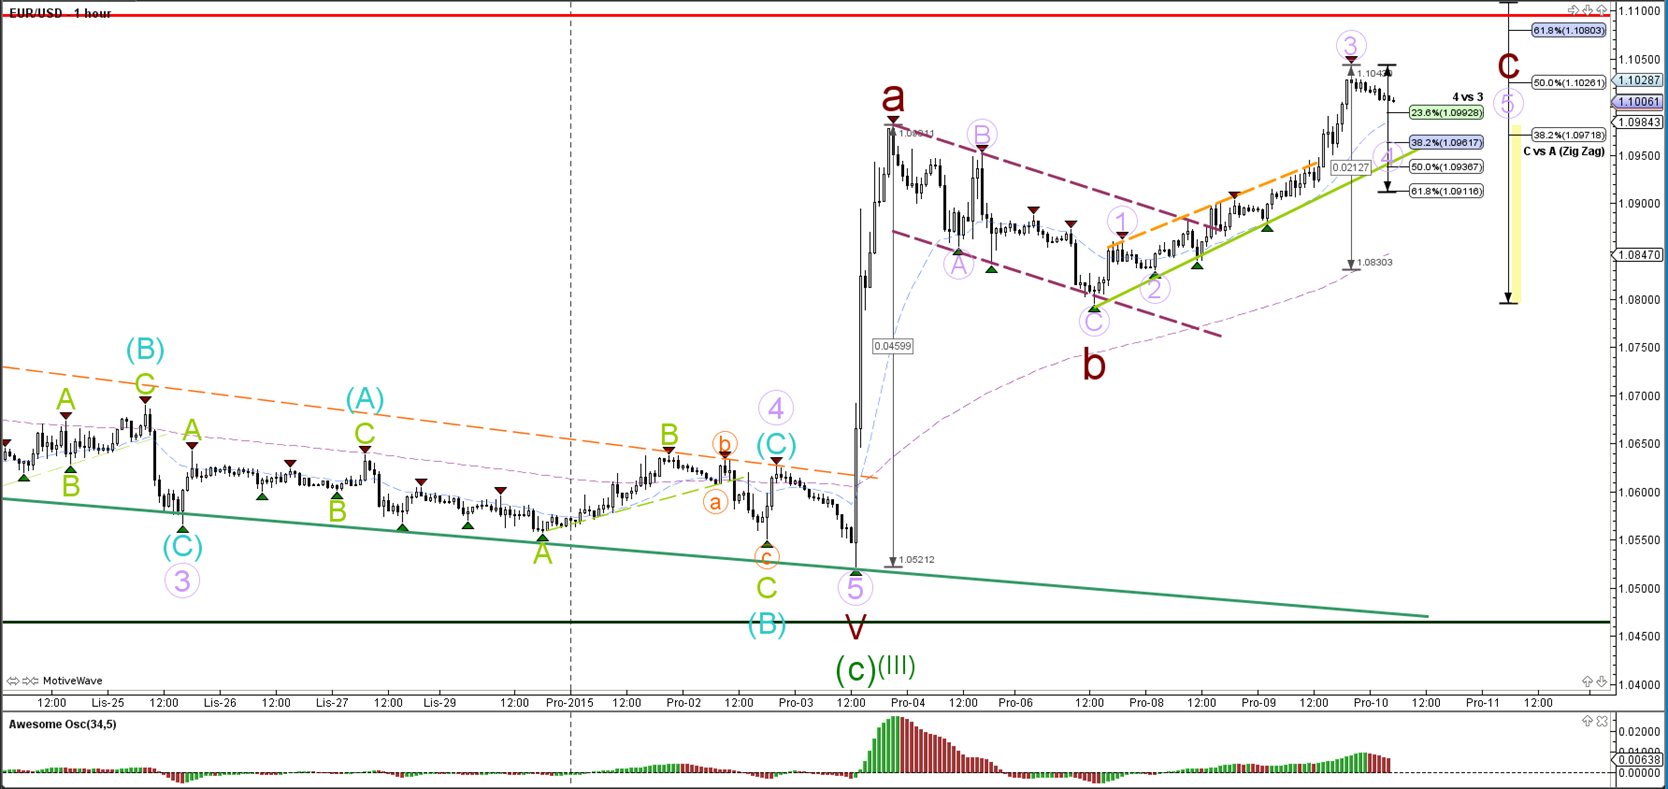
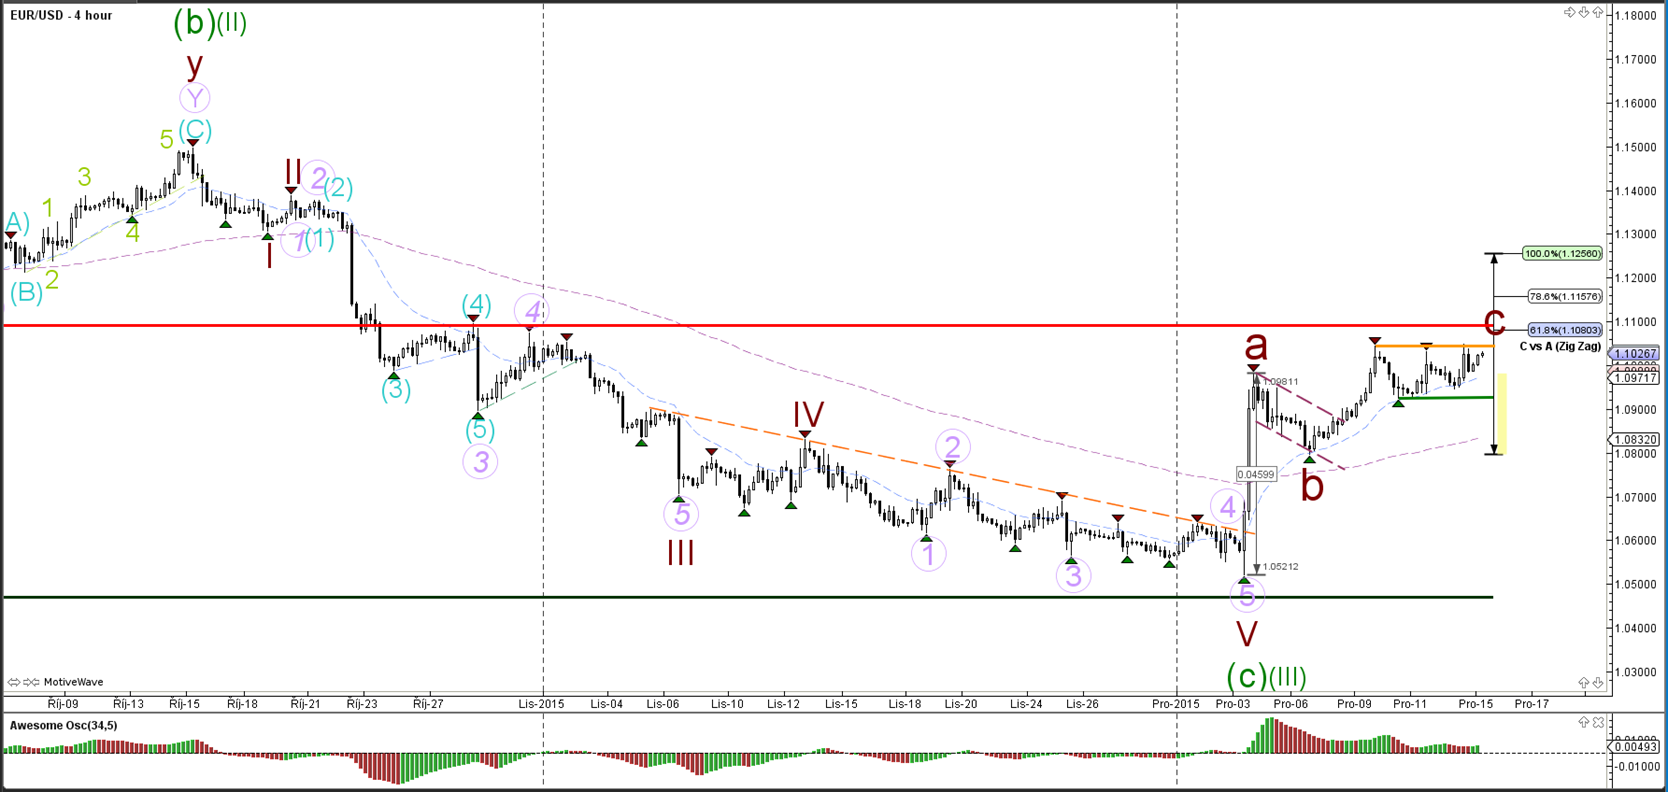
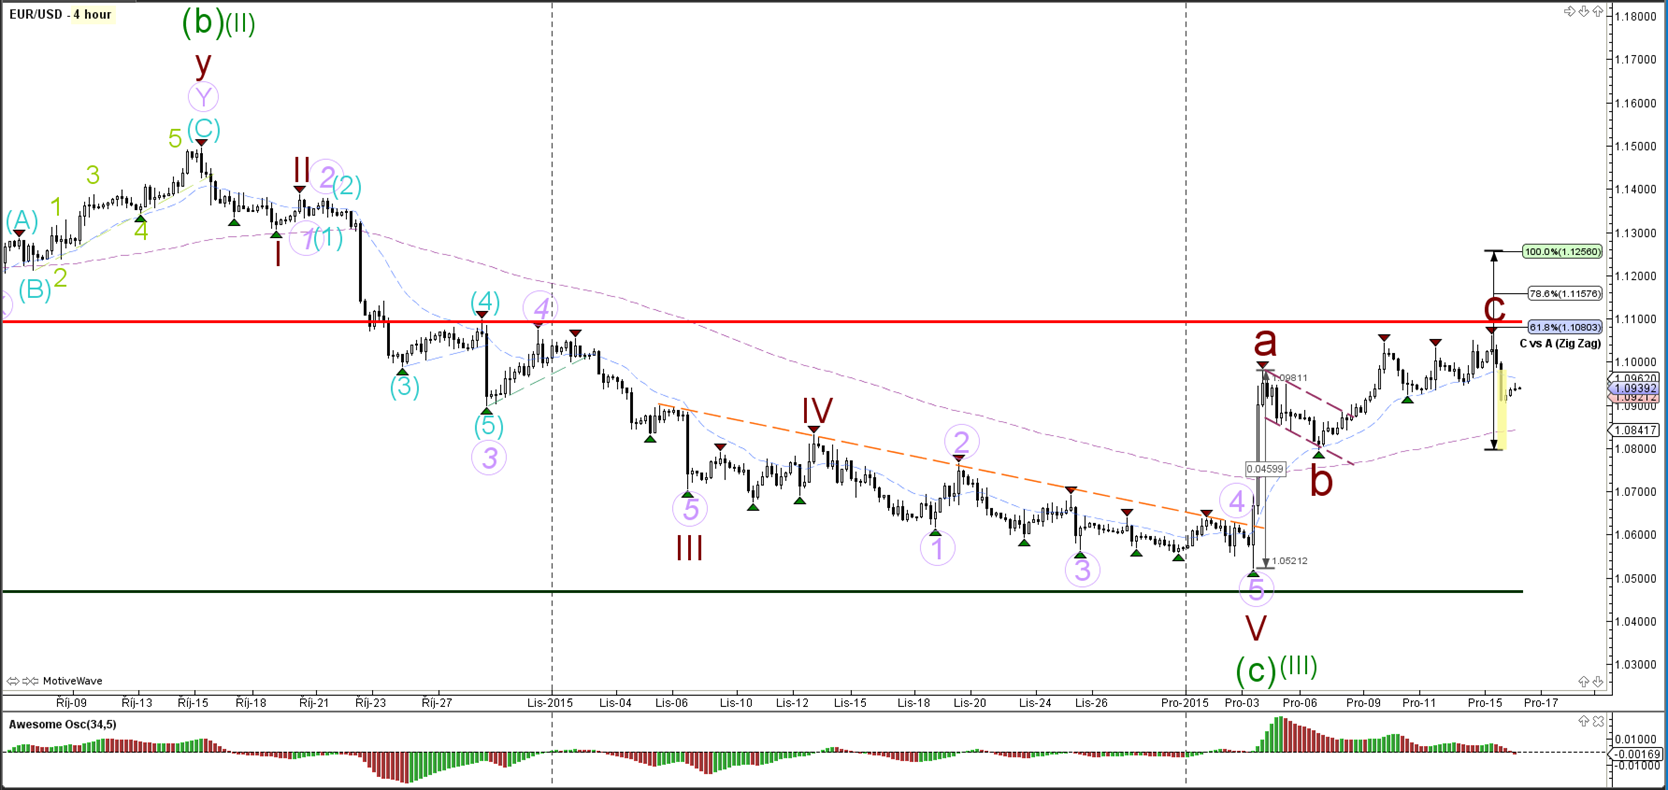
EUR/USD
4 hour

The EUR/USD has so far been unable to break below the 138.2% Fibonacci support level, which could invalidate the wave X (blue) wave count. A break above the resistance trend lines (orange/yellow) could spark a bigger bullish correction.
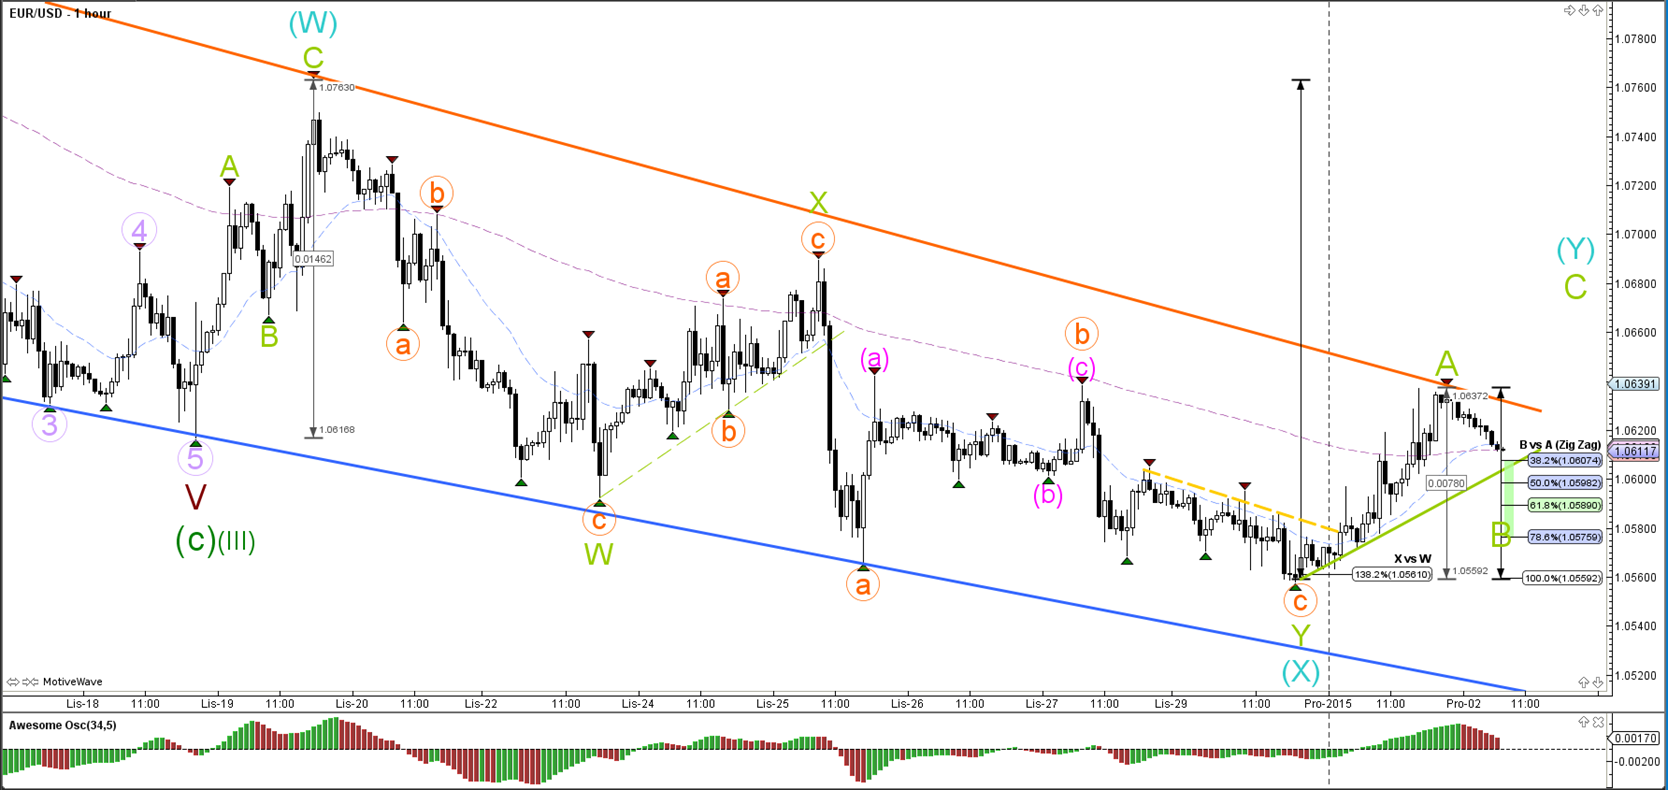
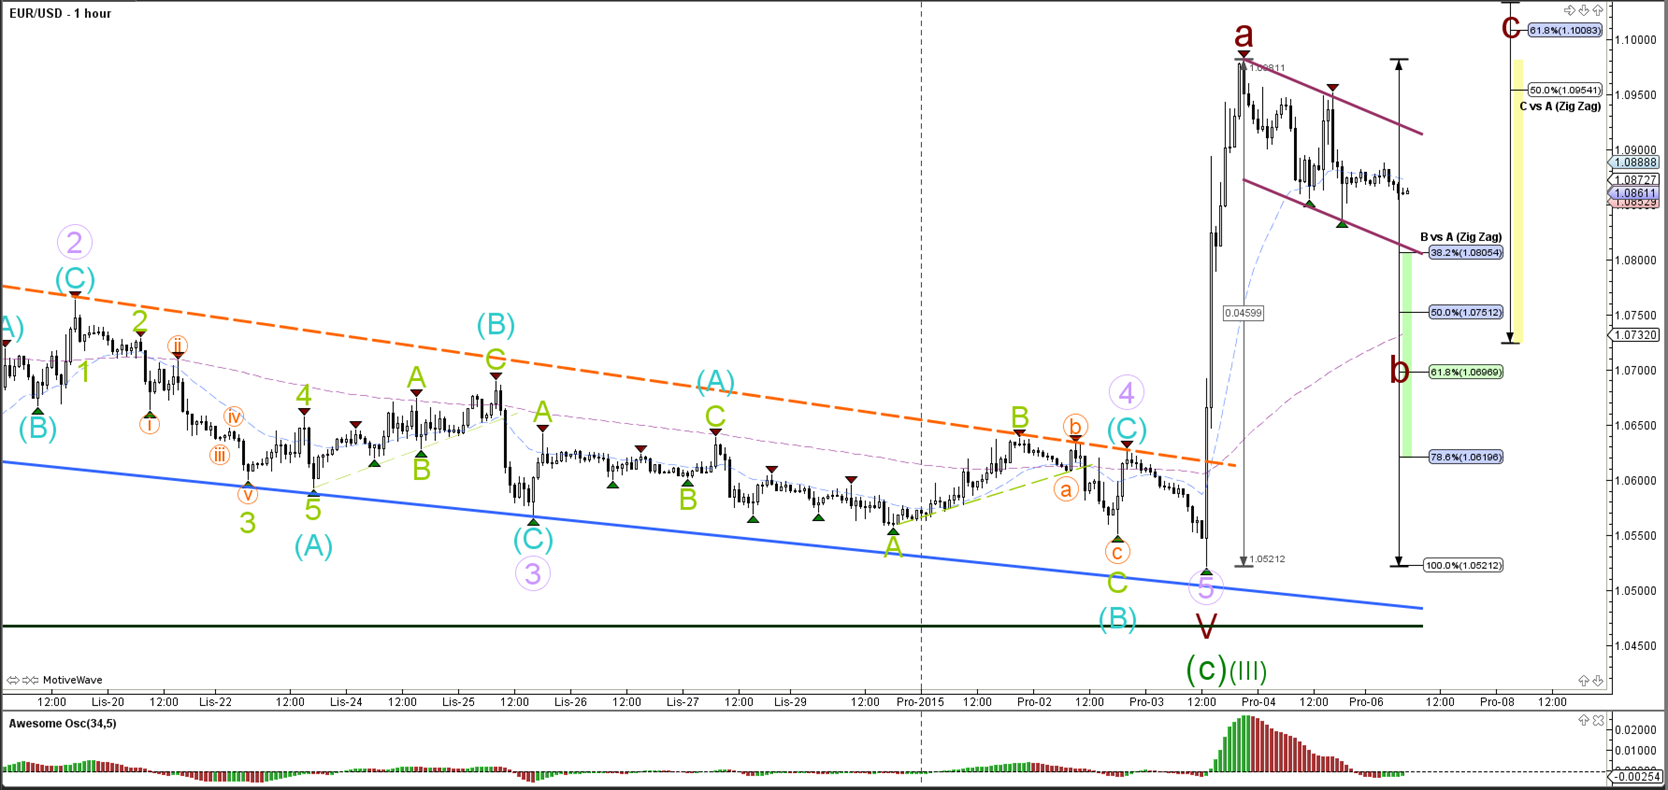
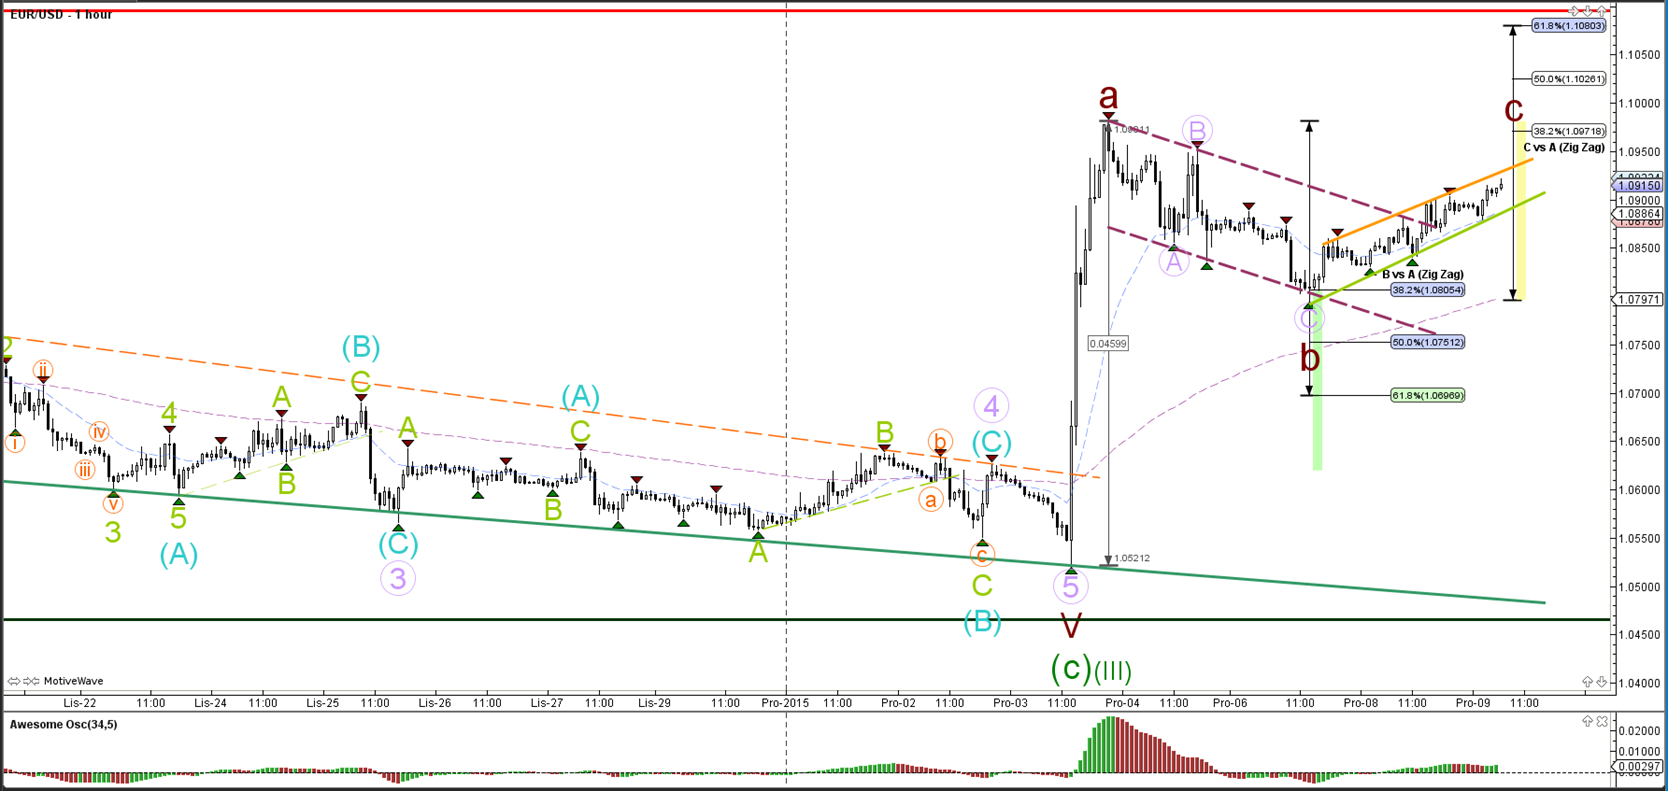
1 hour

The EUR/USD completed a small ABC zigzag (pink) which was part of a wave B (orange). The bearish wave C (orange) has not been able to break the support trend line (light green), which could be an invalidation level of wave X (blue).
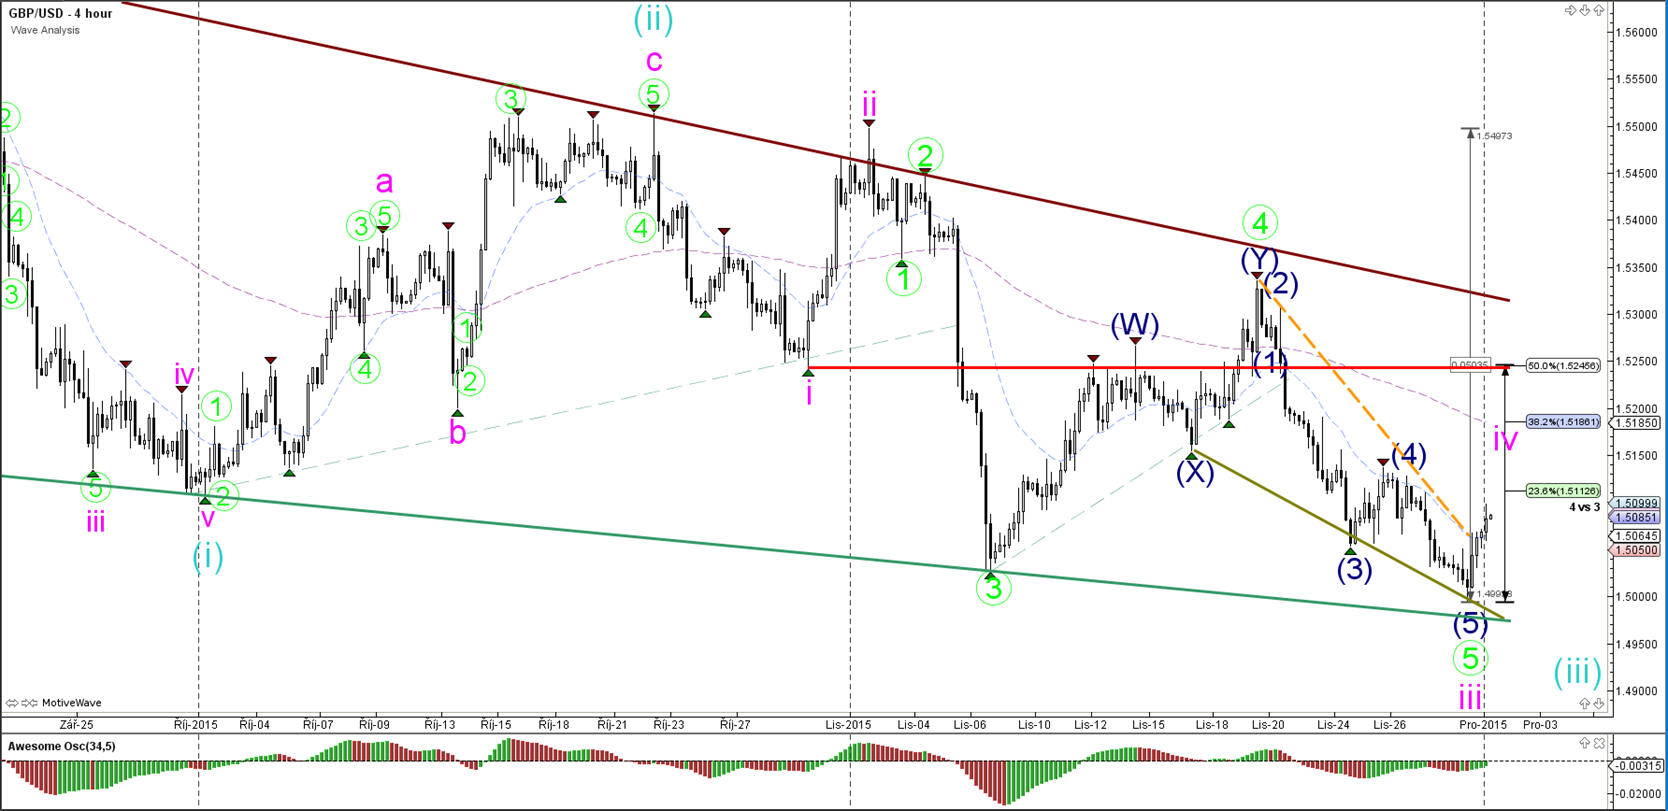
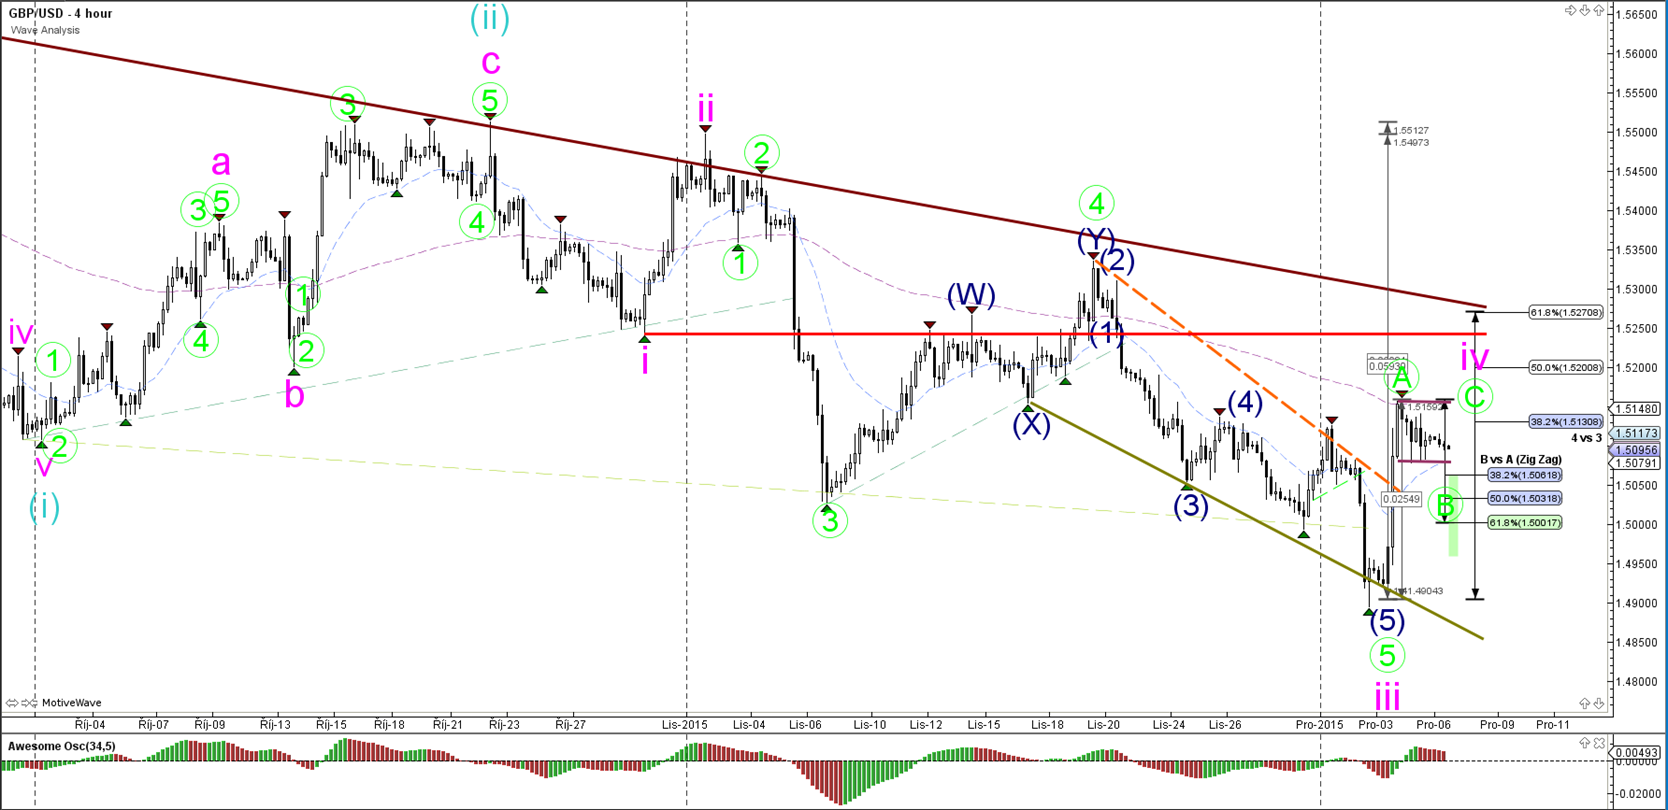
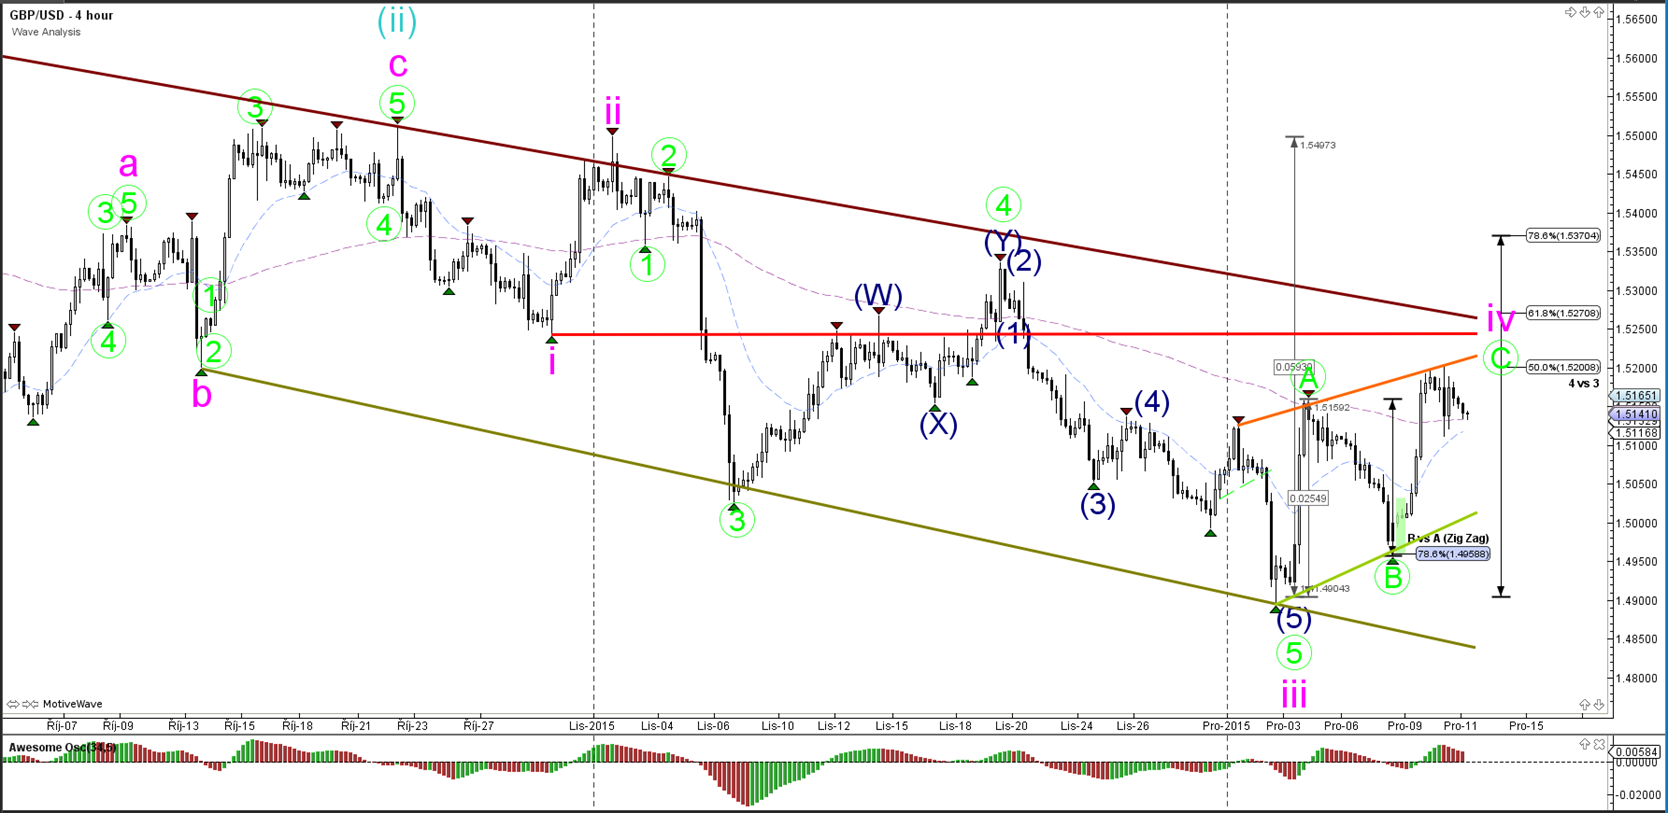
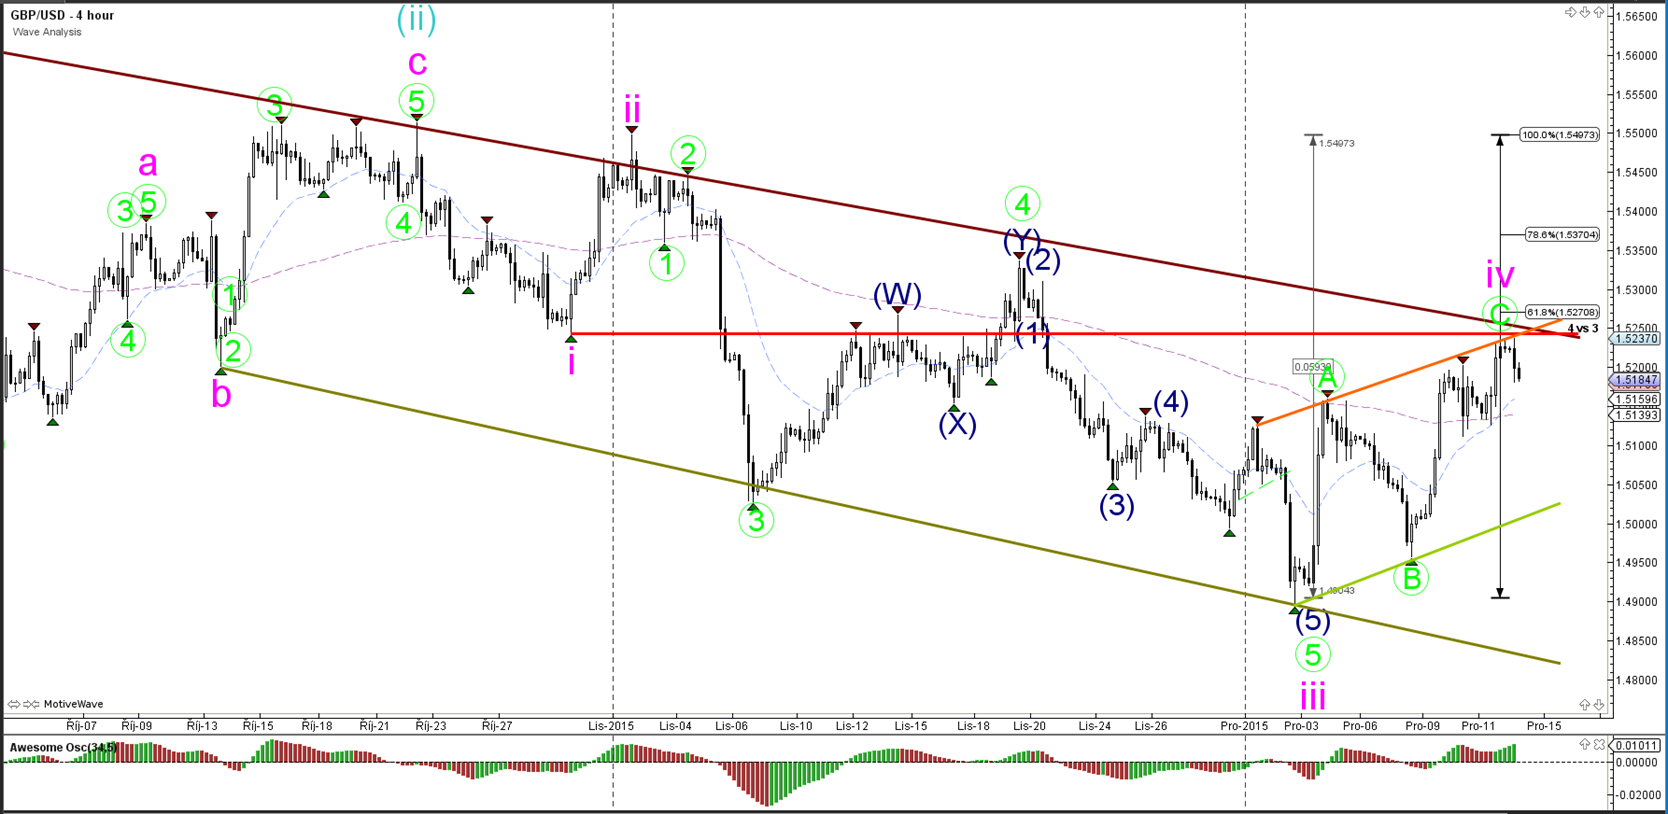
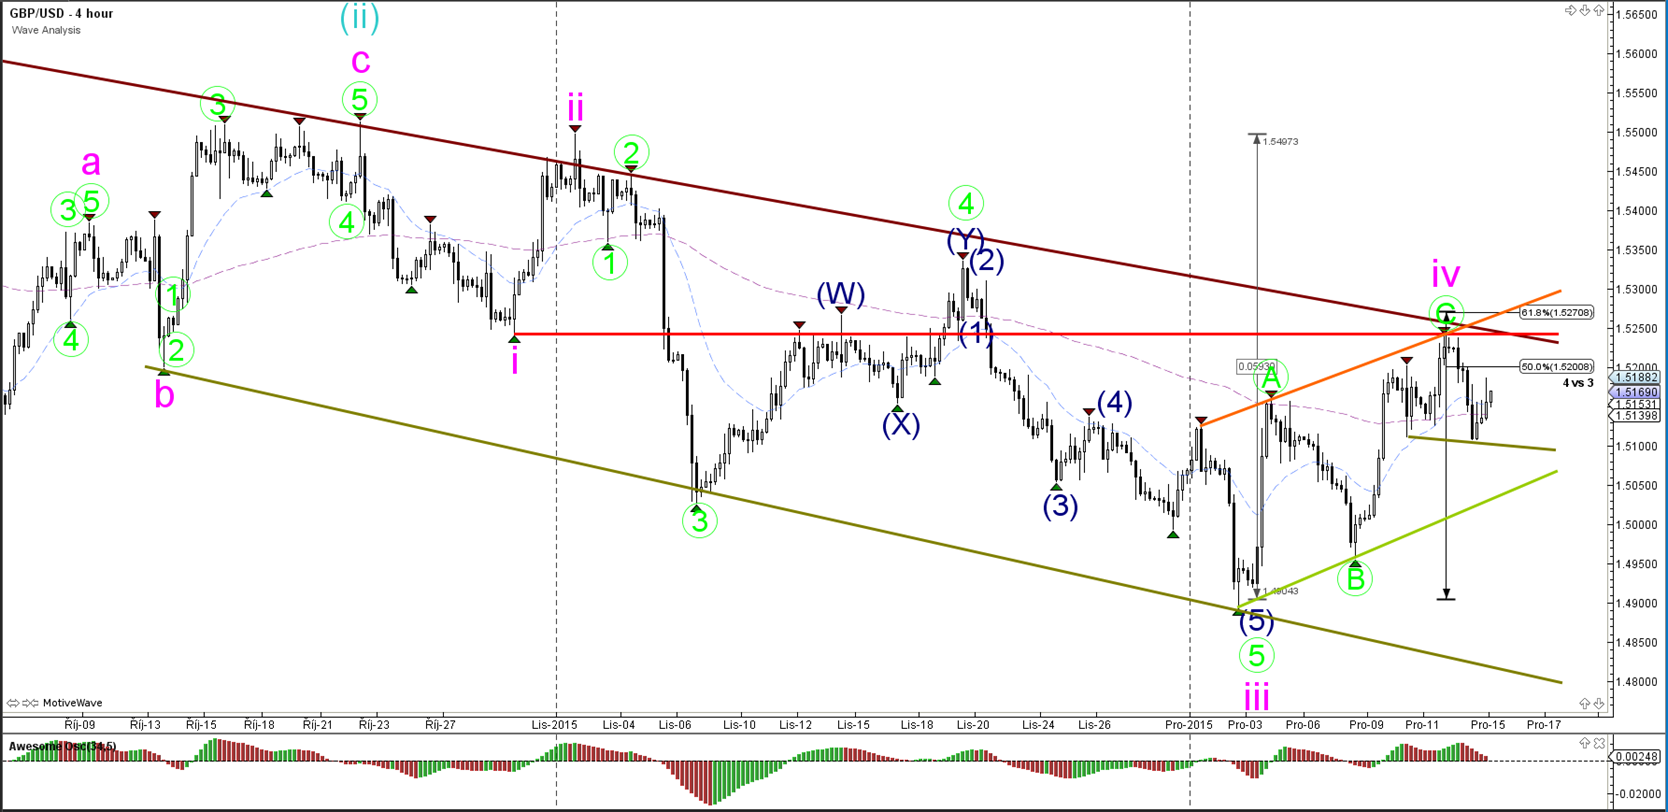
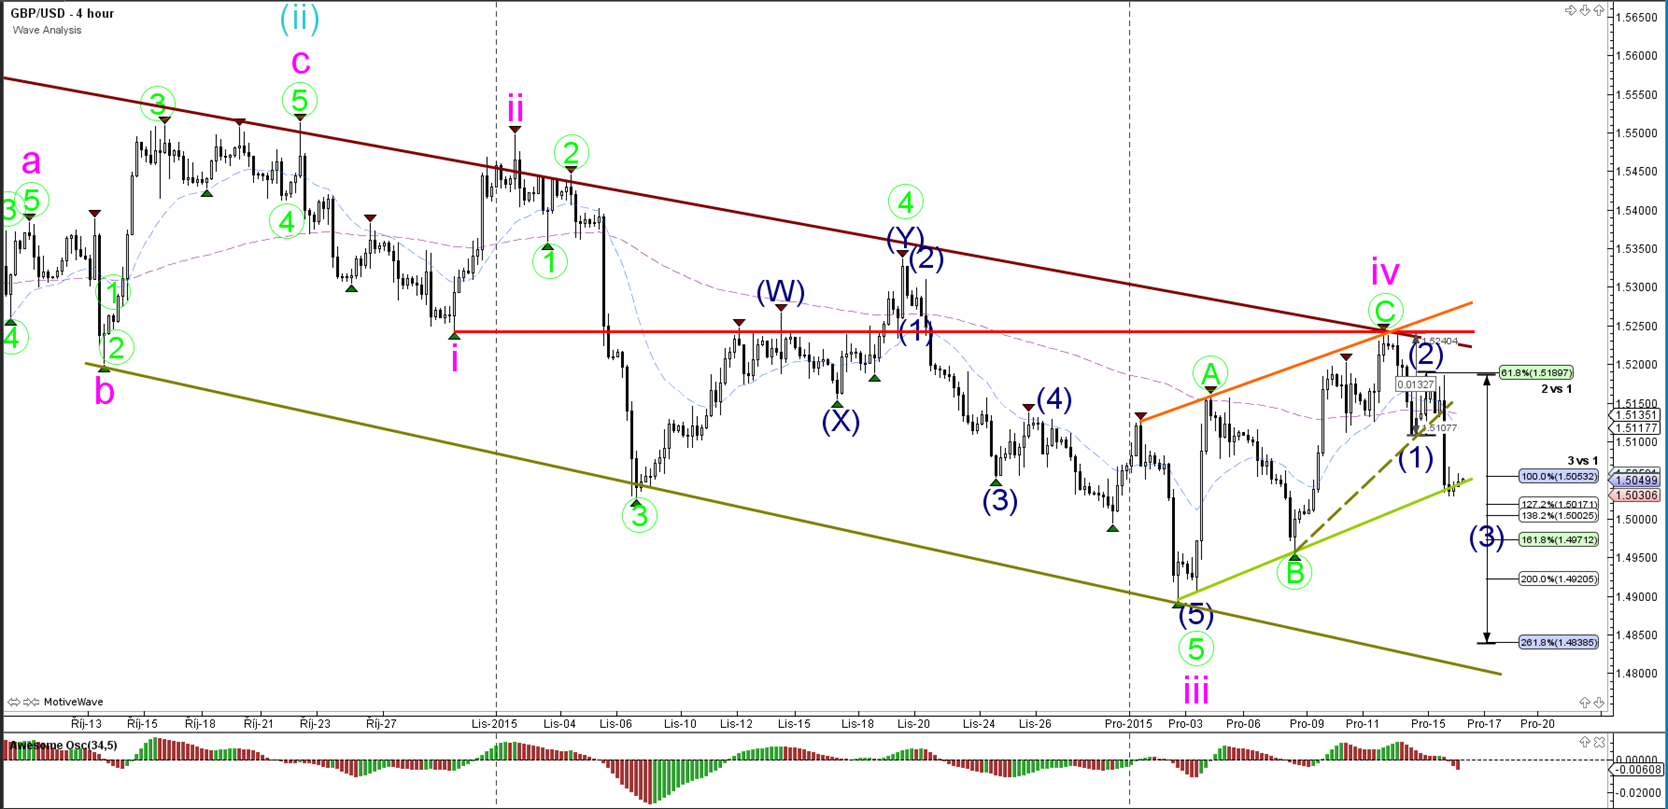
GBP/USD
4 hour
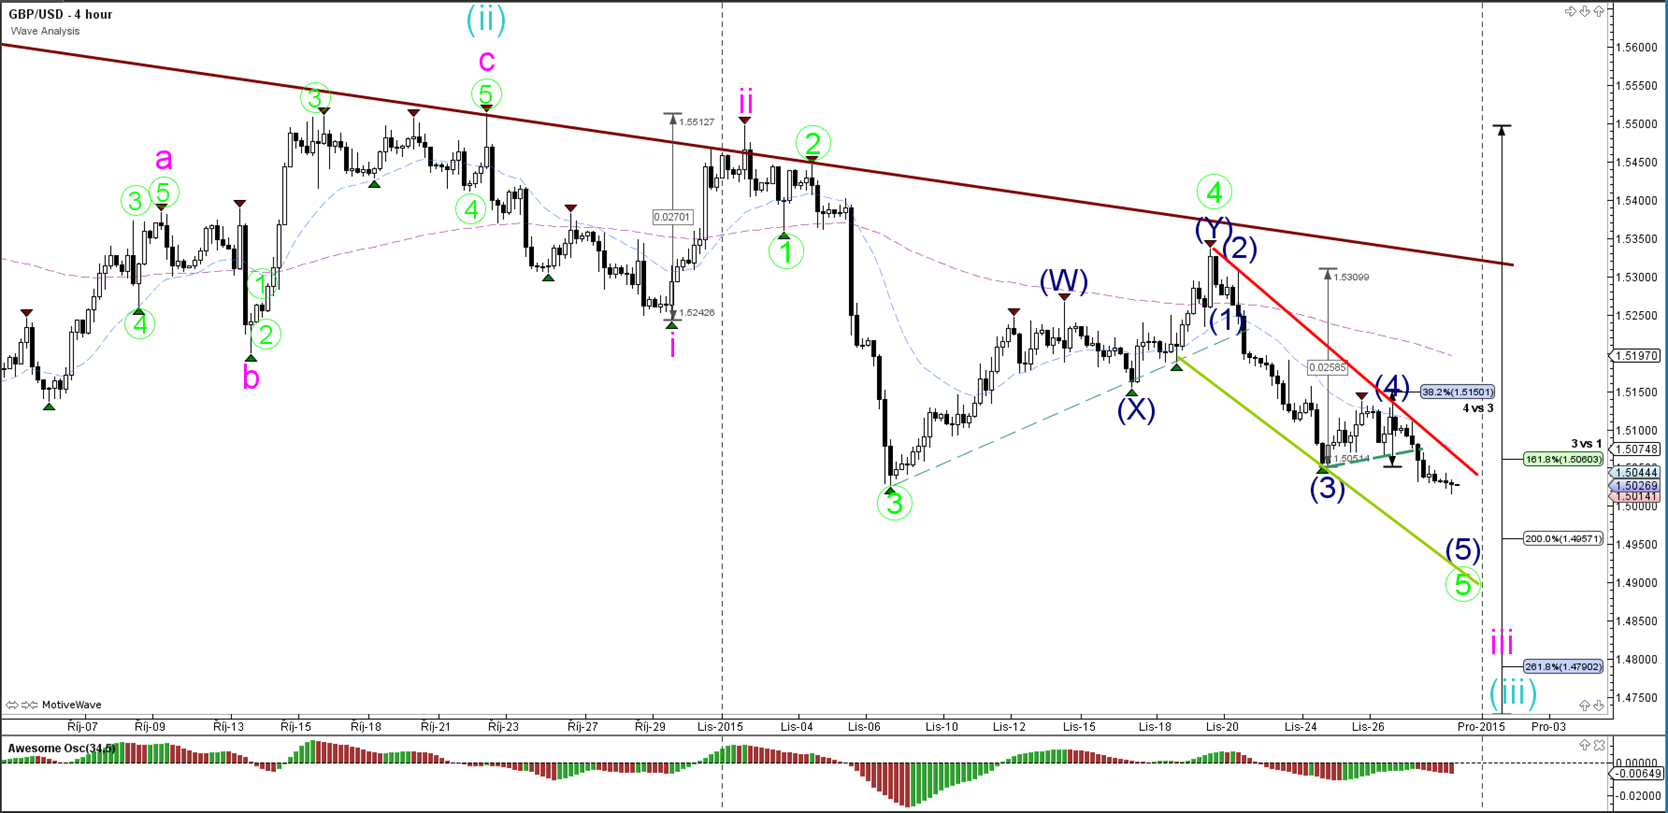
The GBP/USD broke below the support trend line (dotted green) and price is moving lower as part of a wave 5 bearish breakout.
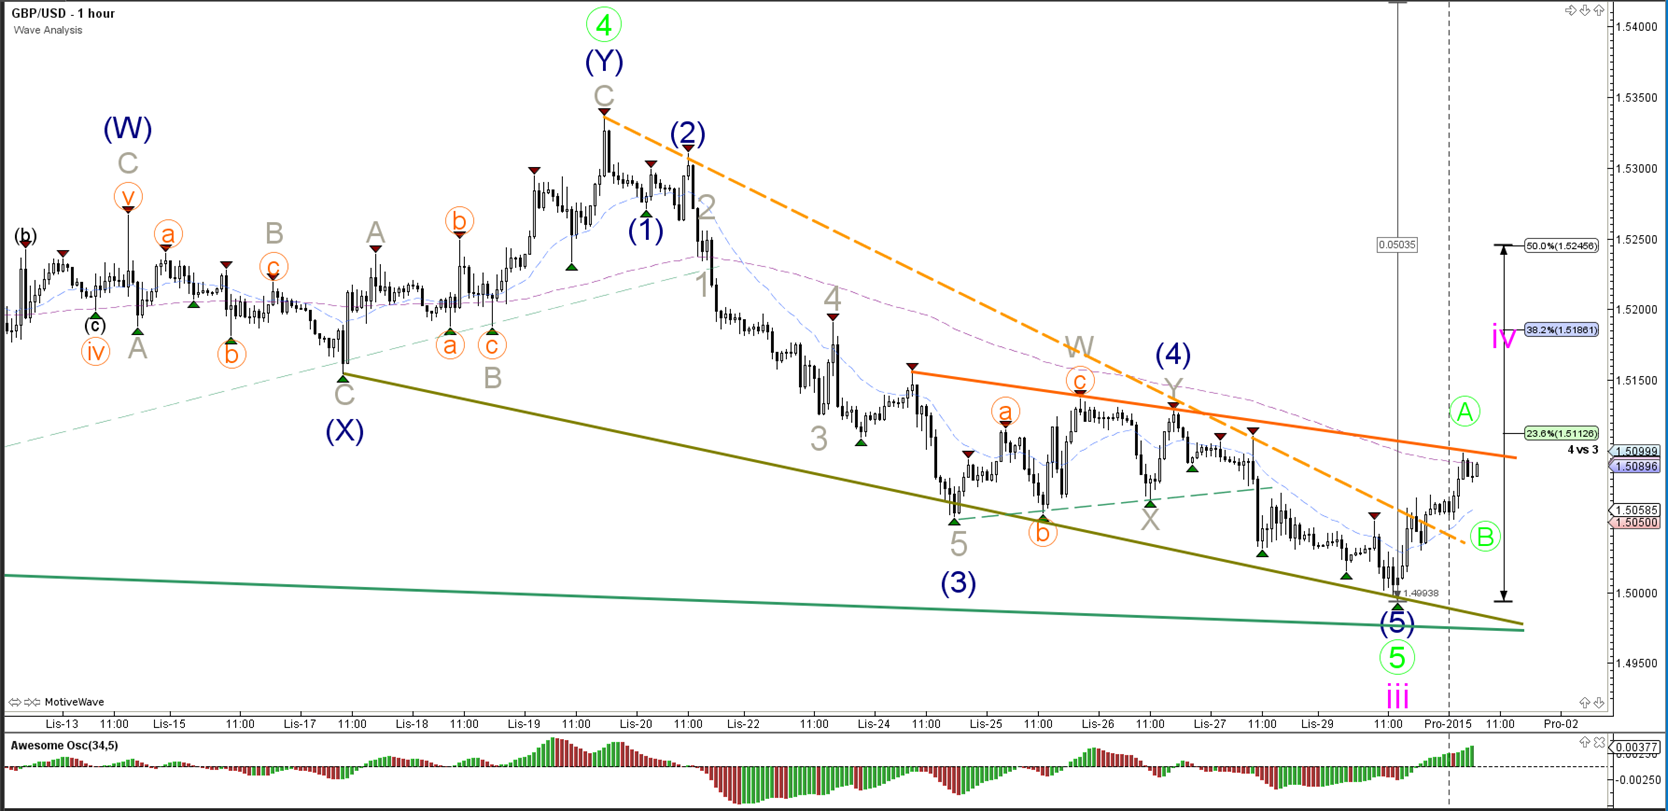
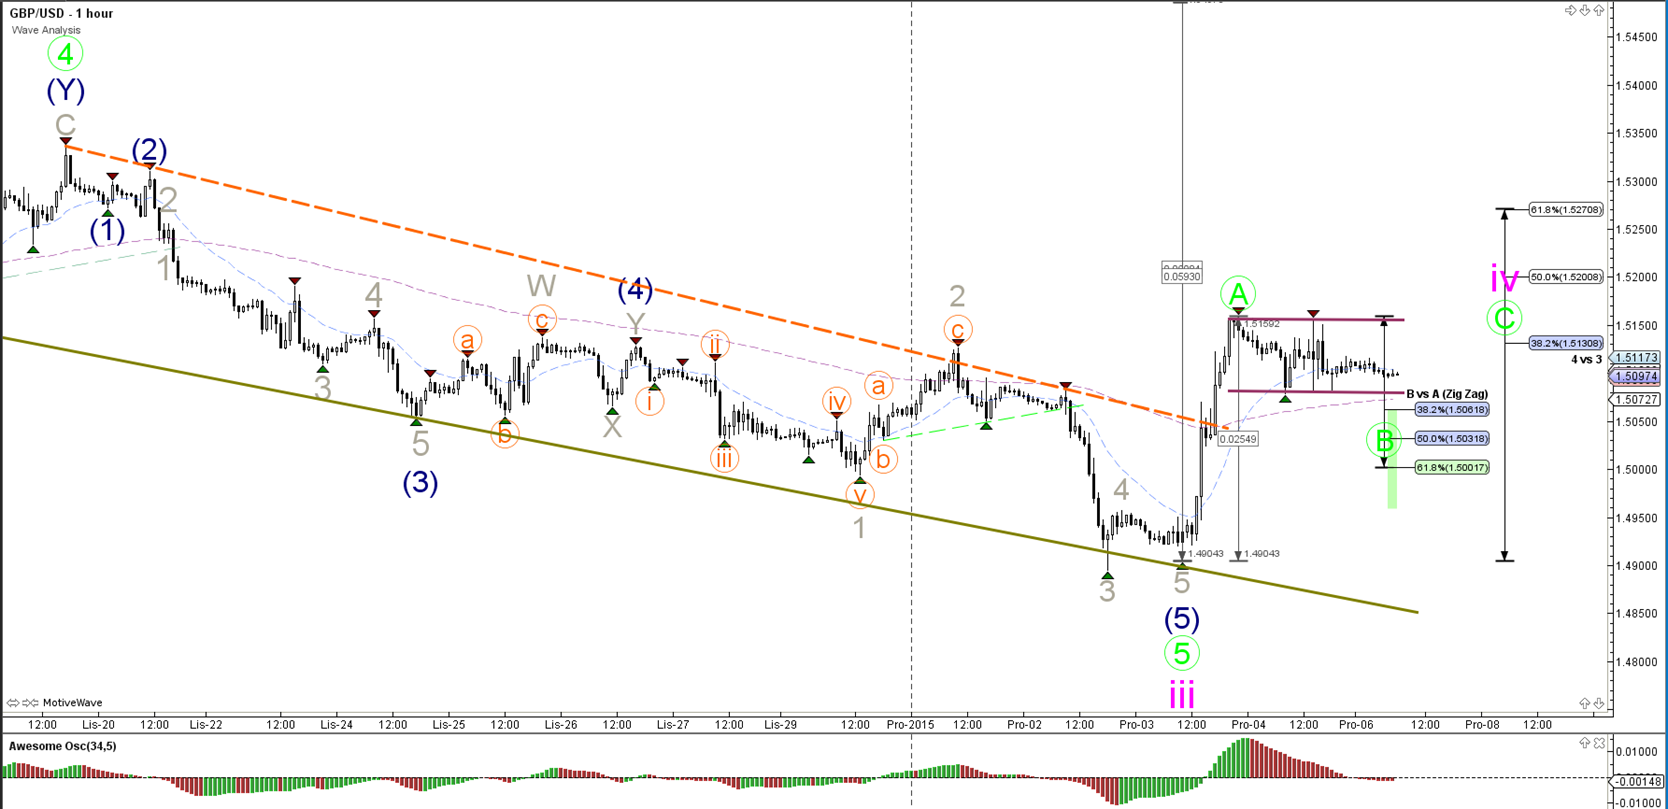
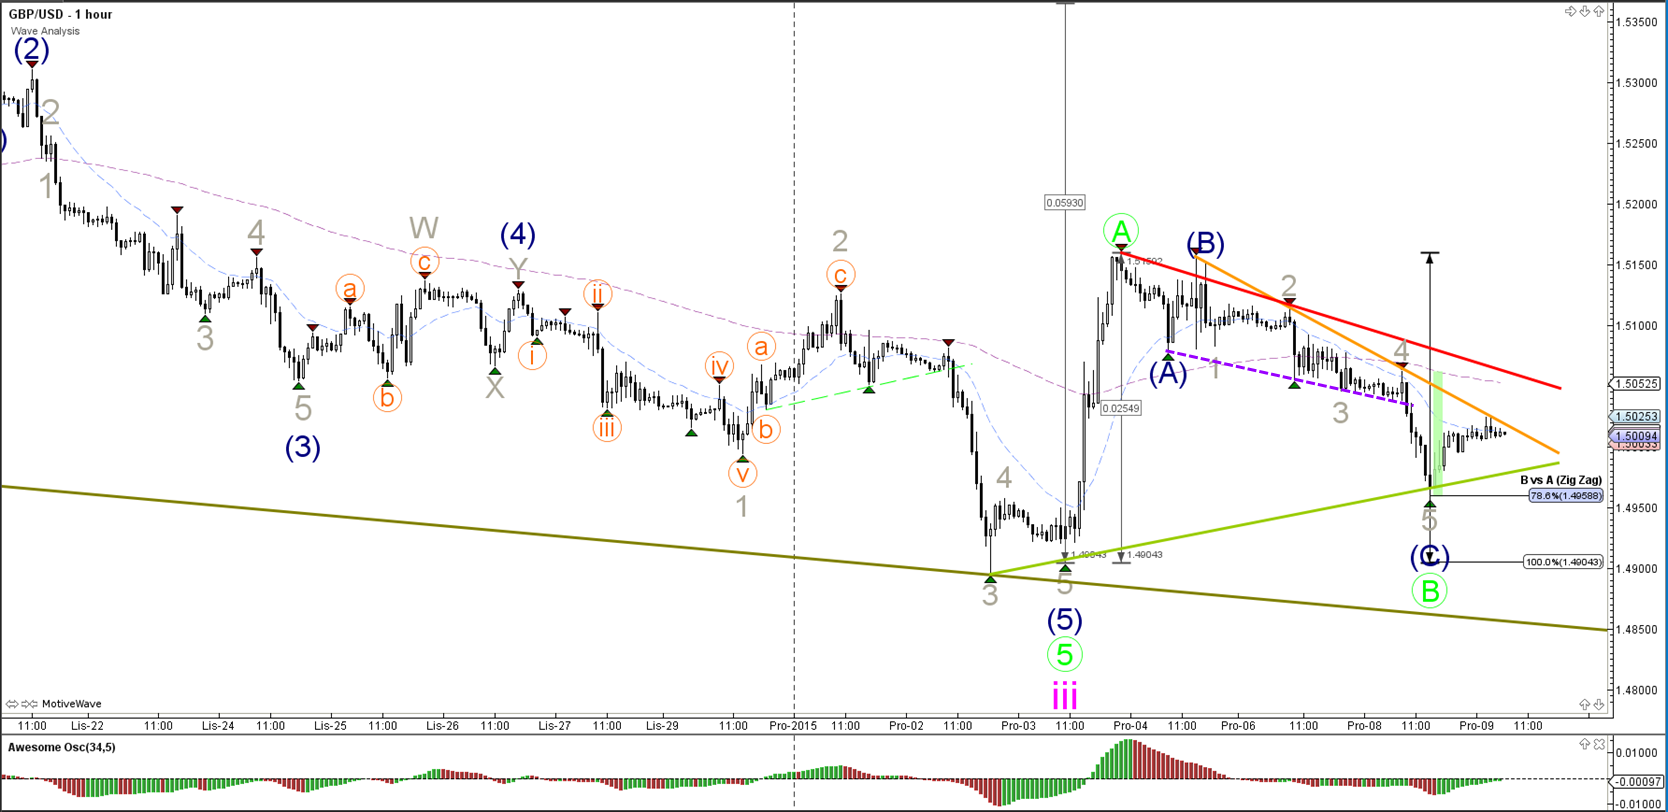
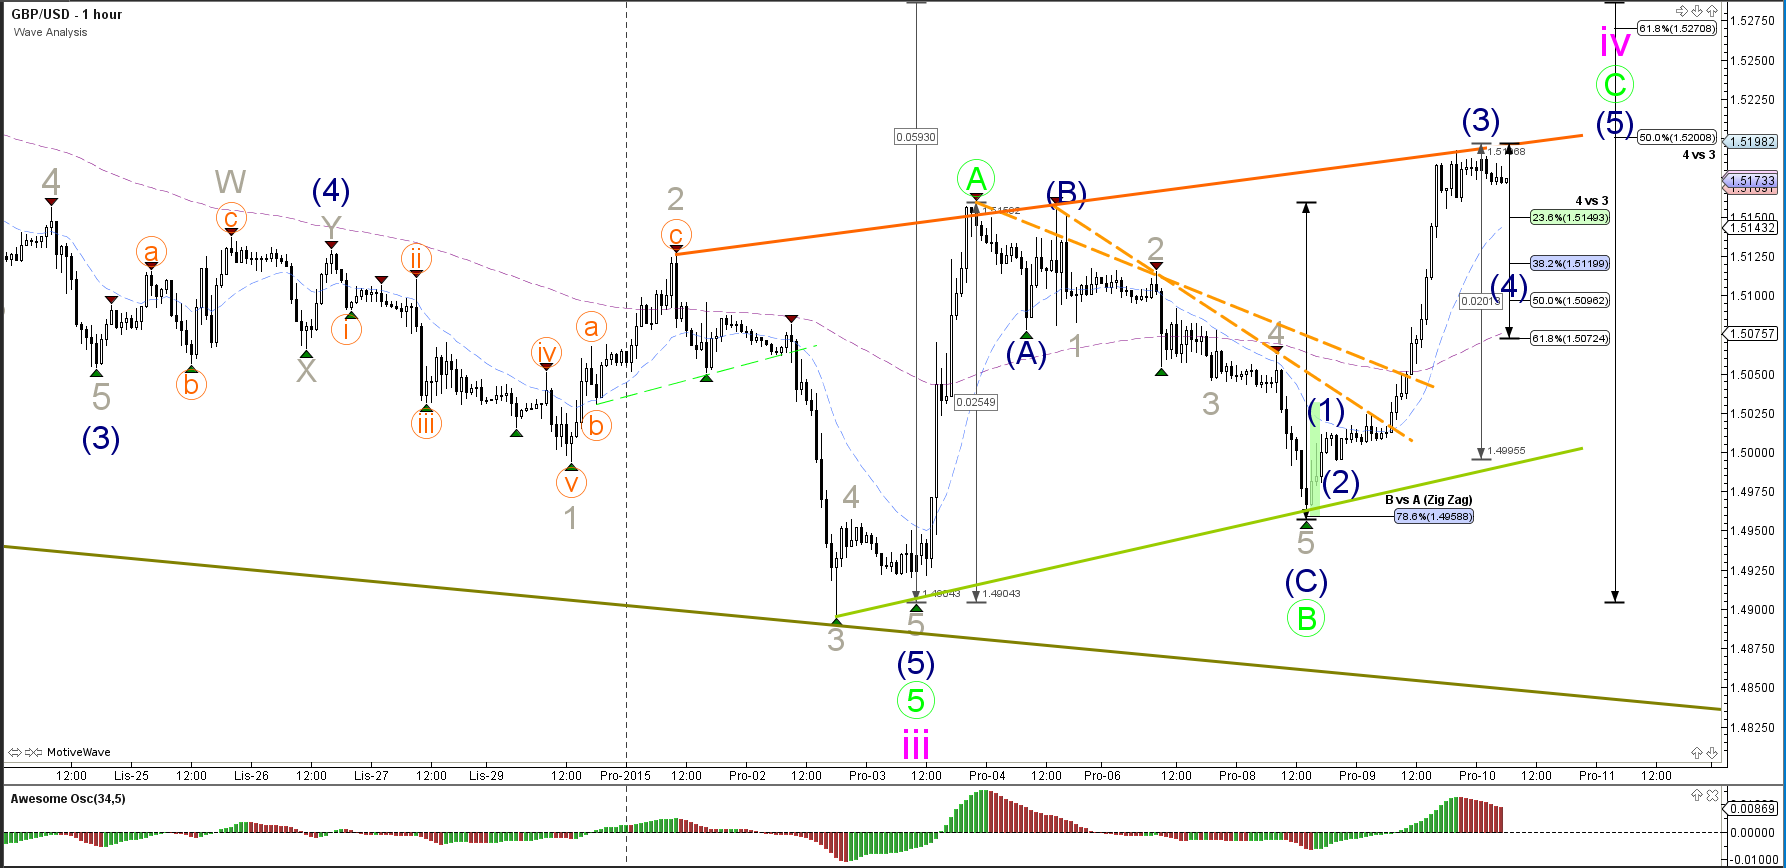
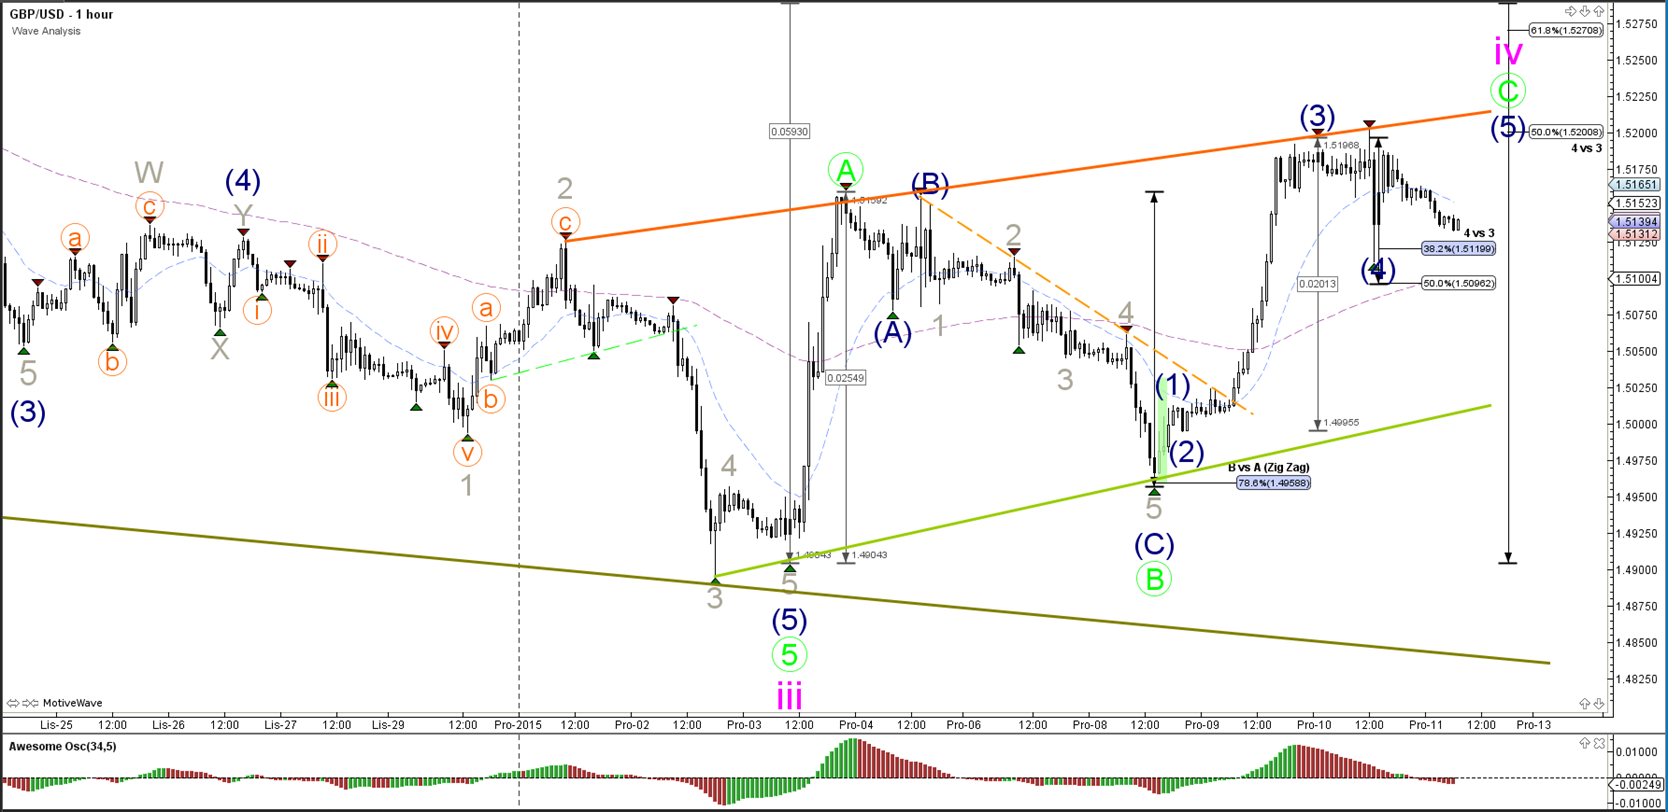
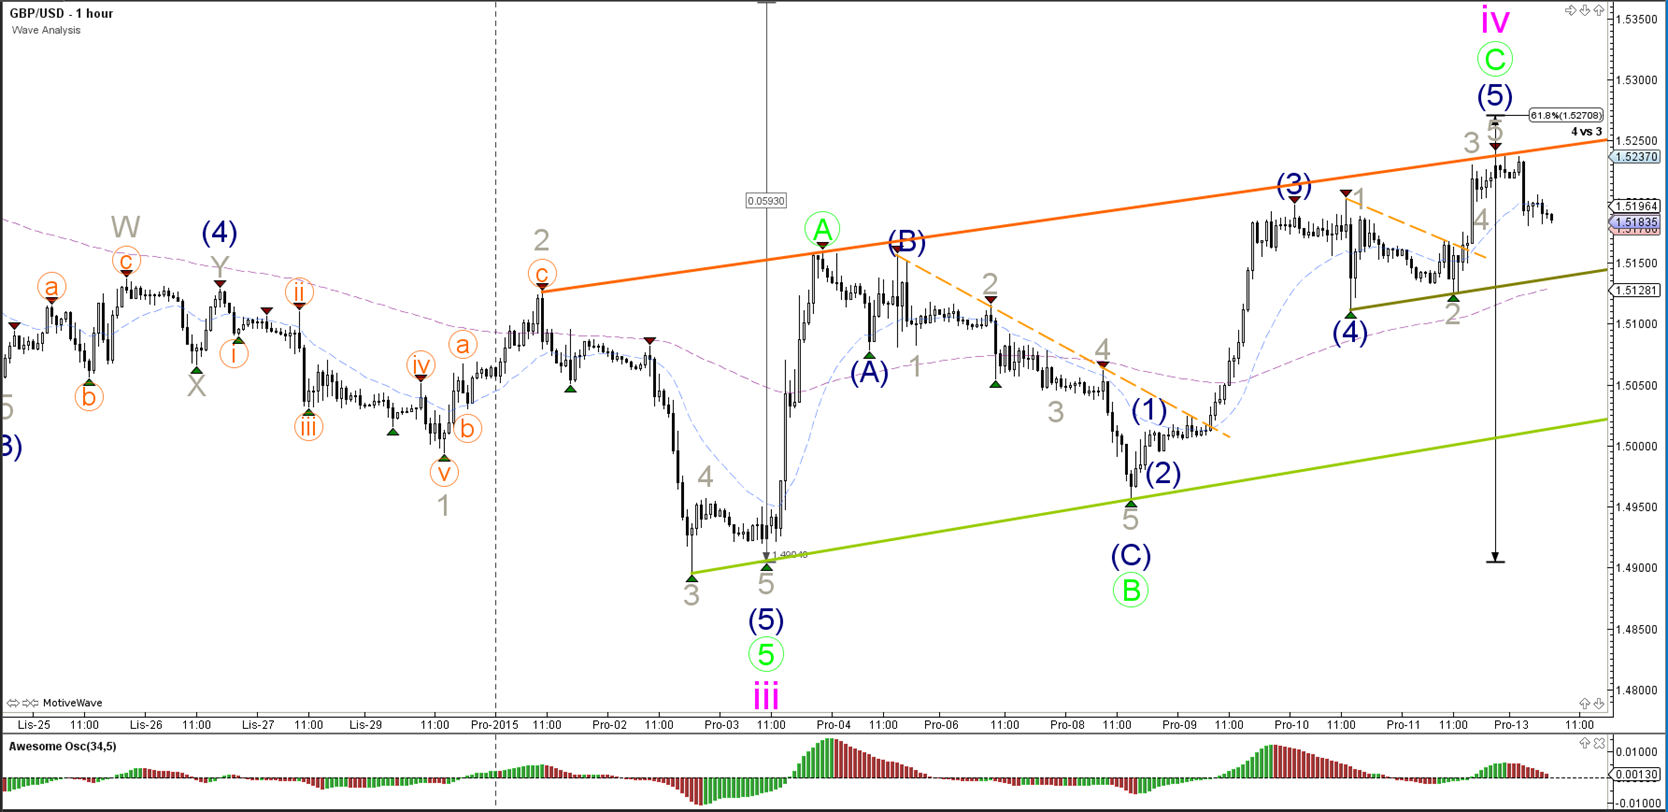
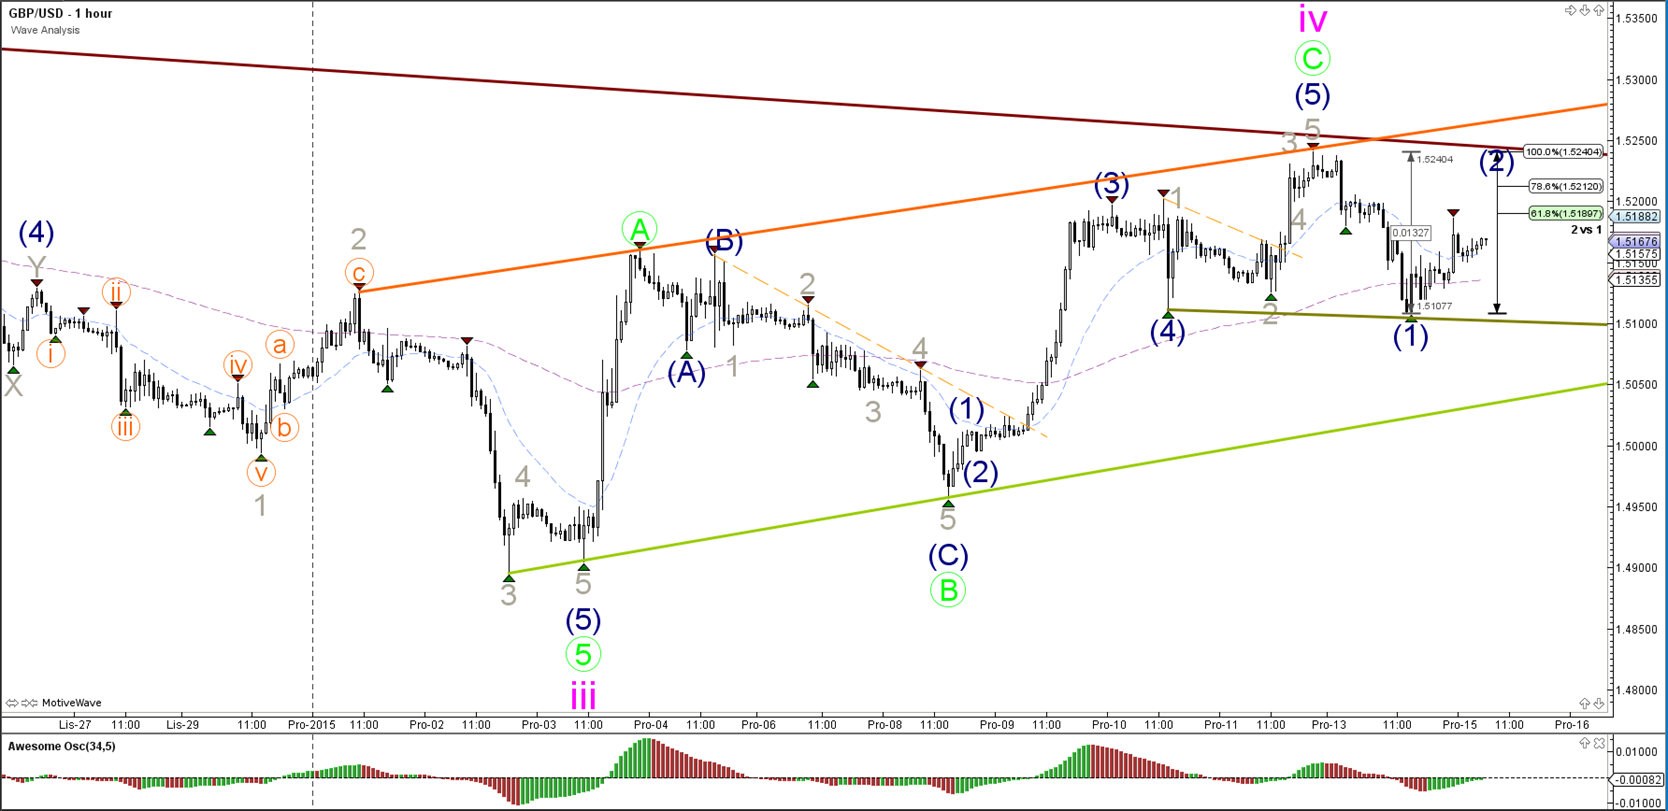
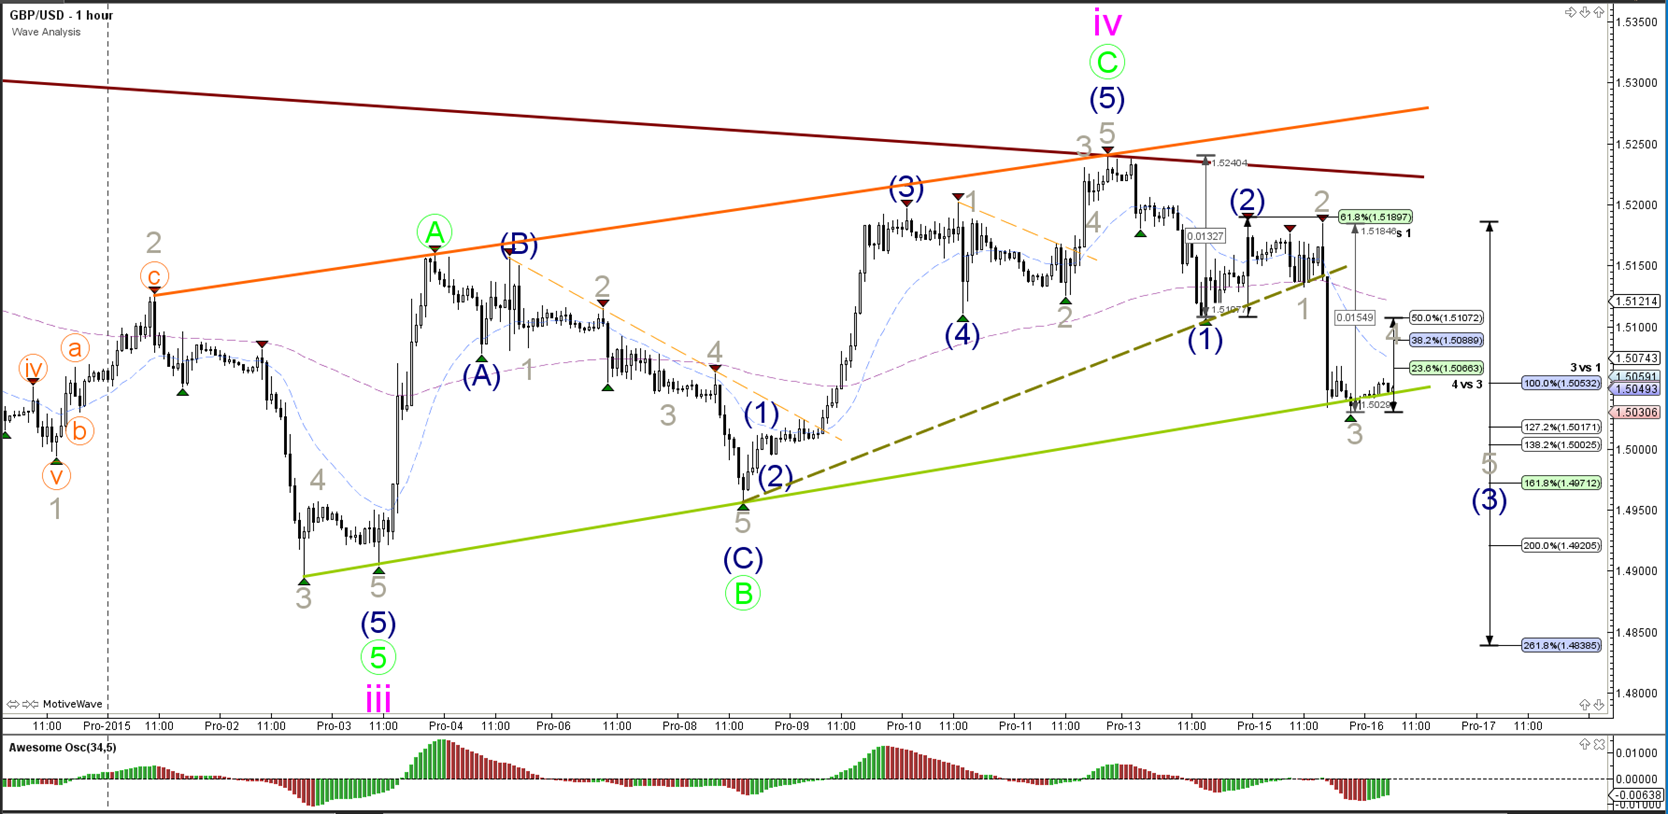
1 hour
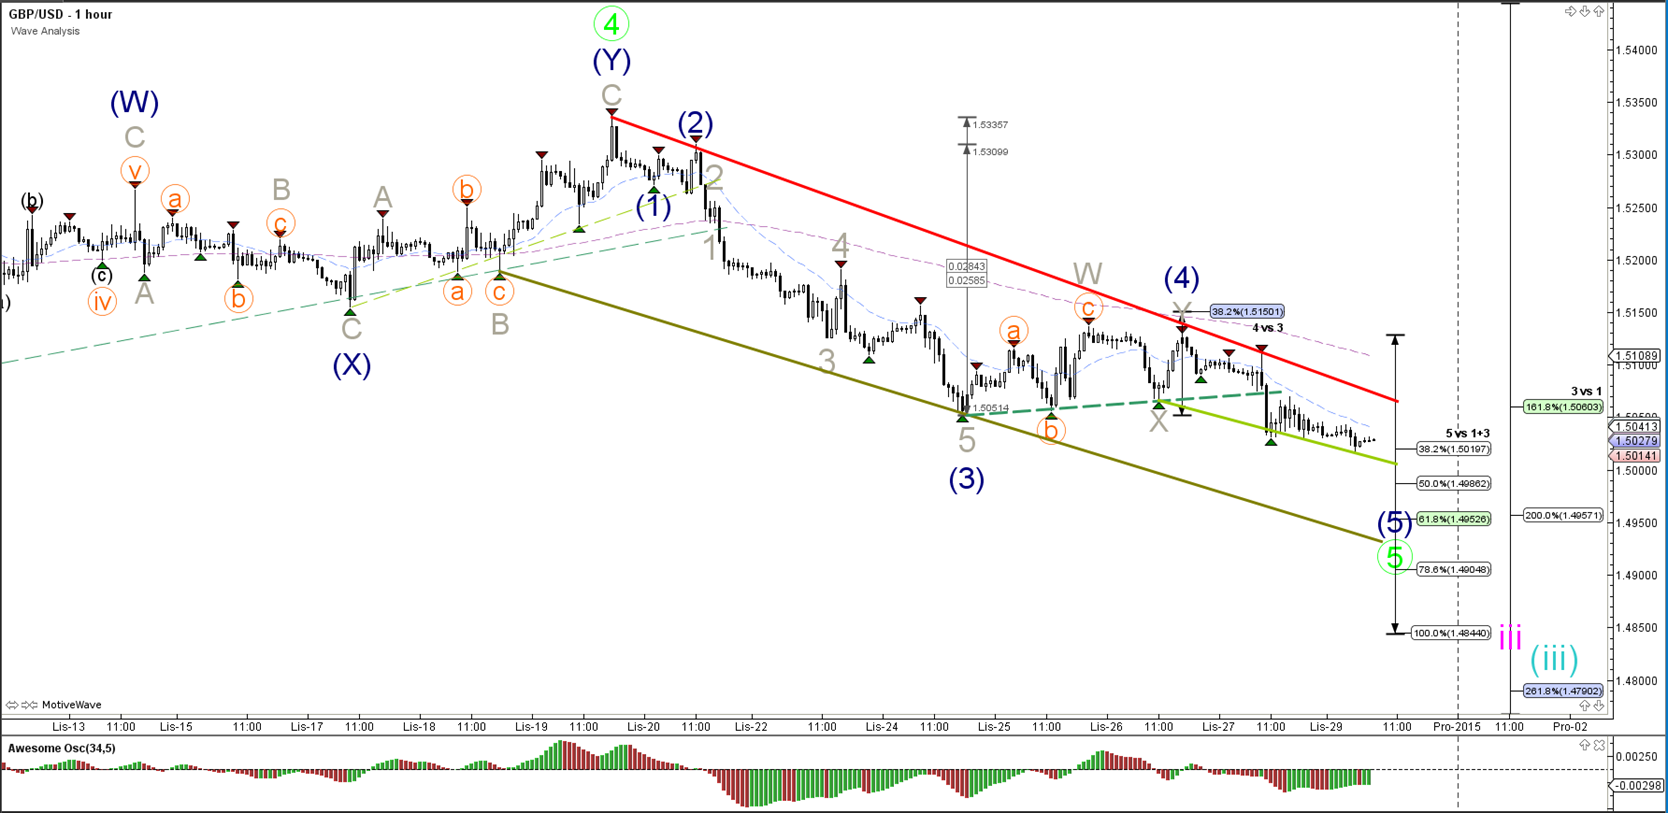
The GBP/USD needs to break below the inner support trend line (light green) before wave 5 (blue) has a chance of reaching the 61.8% target (5 vs 1+3).
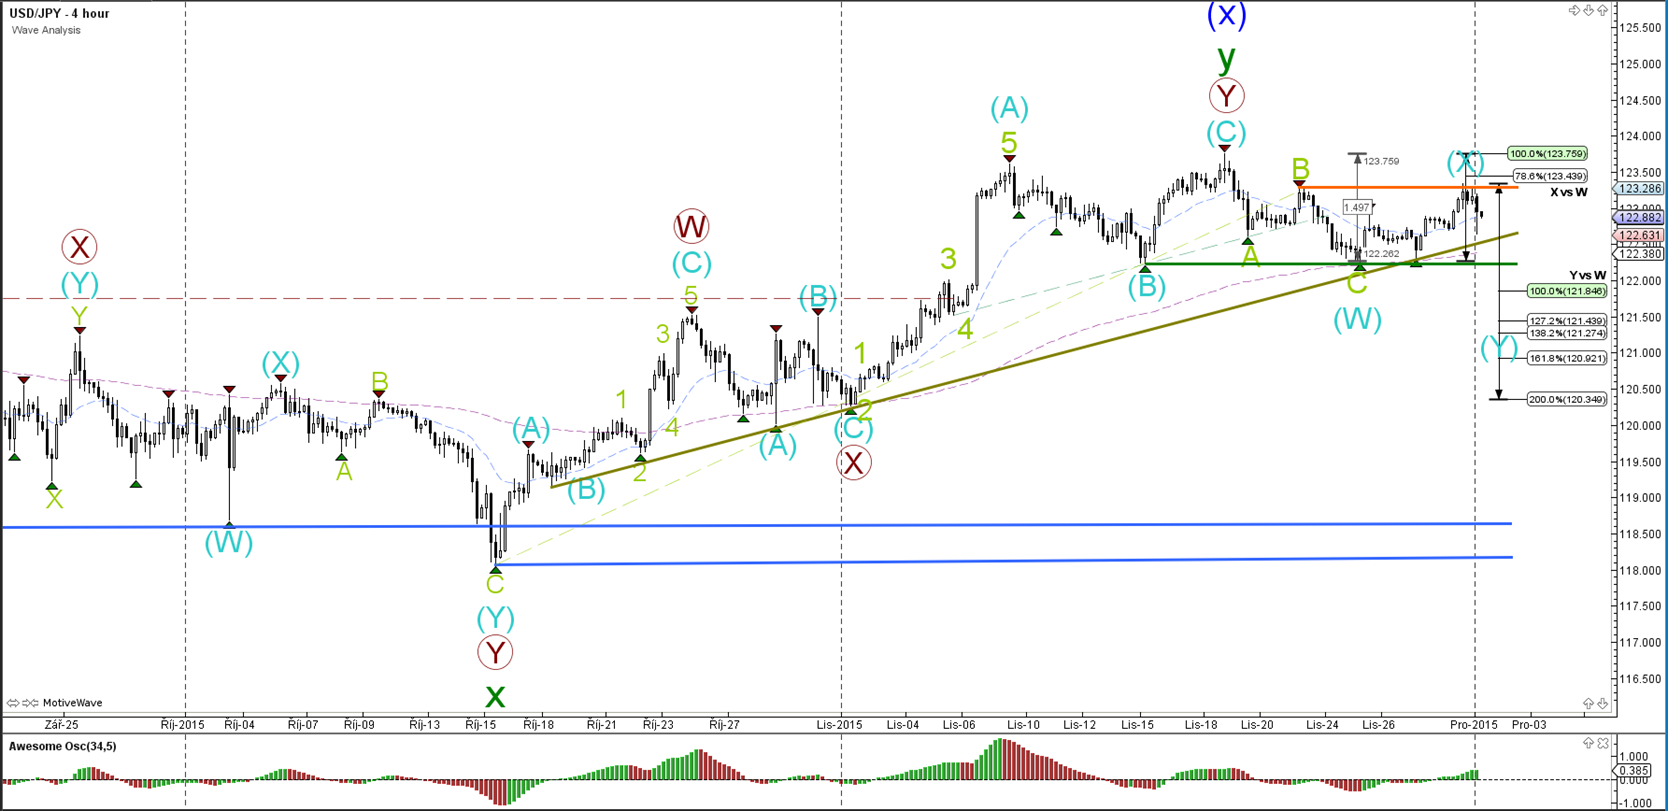
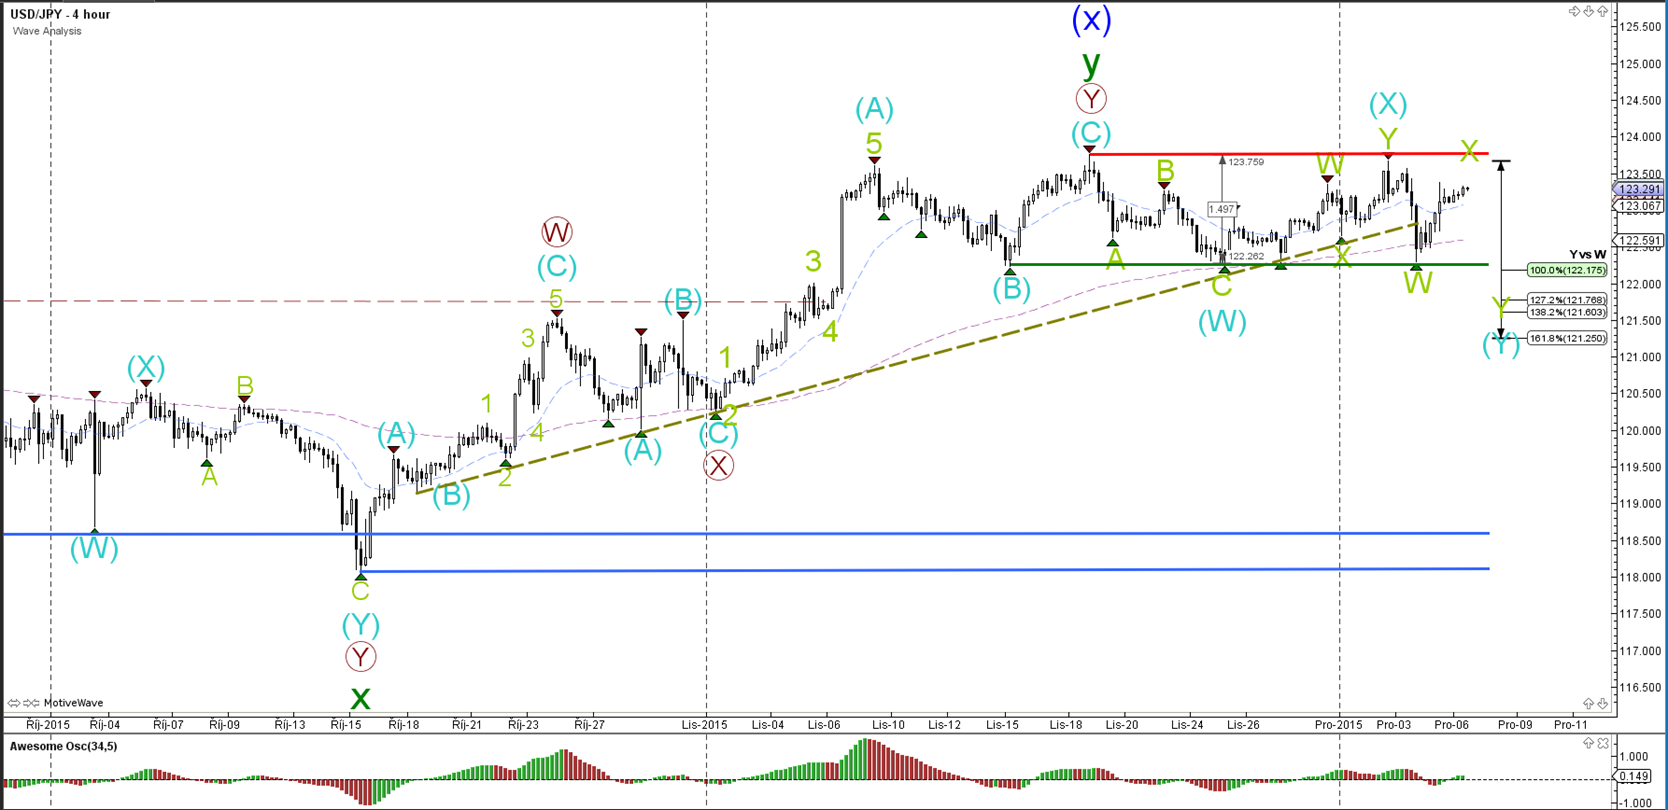
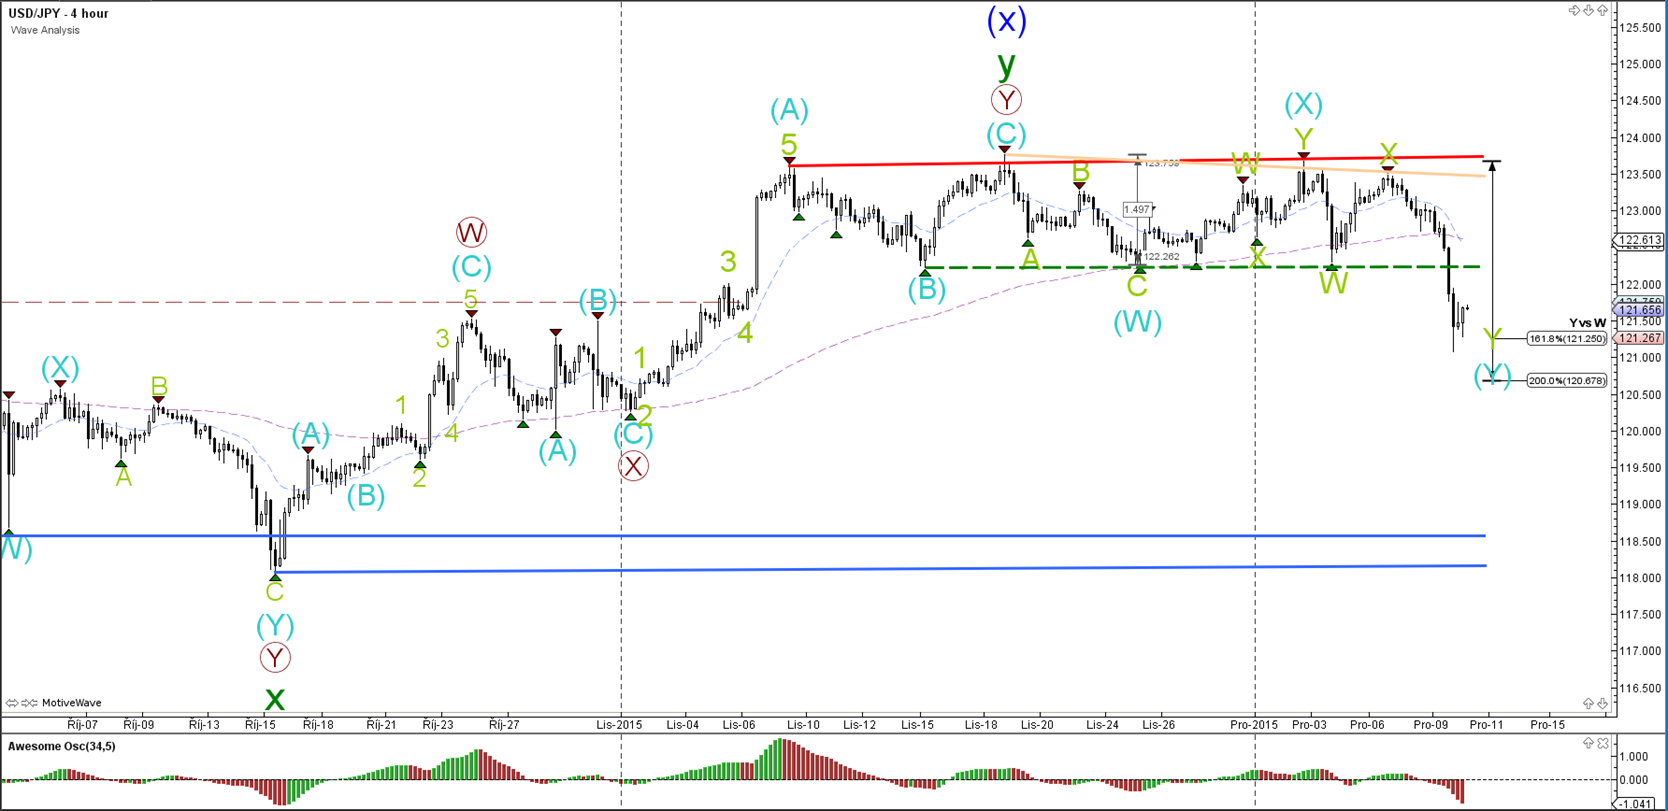
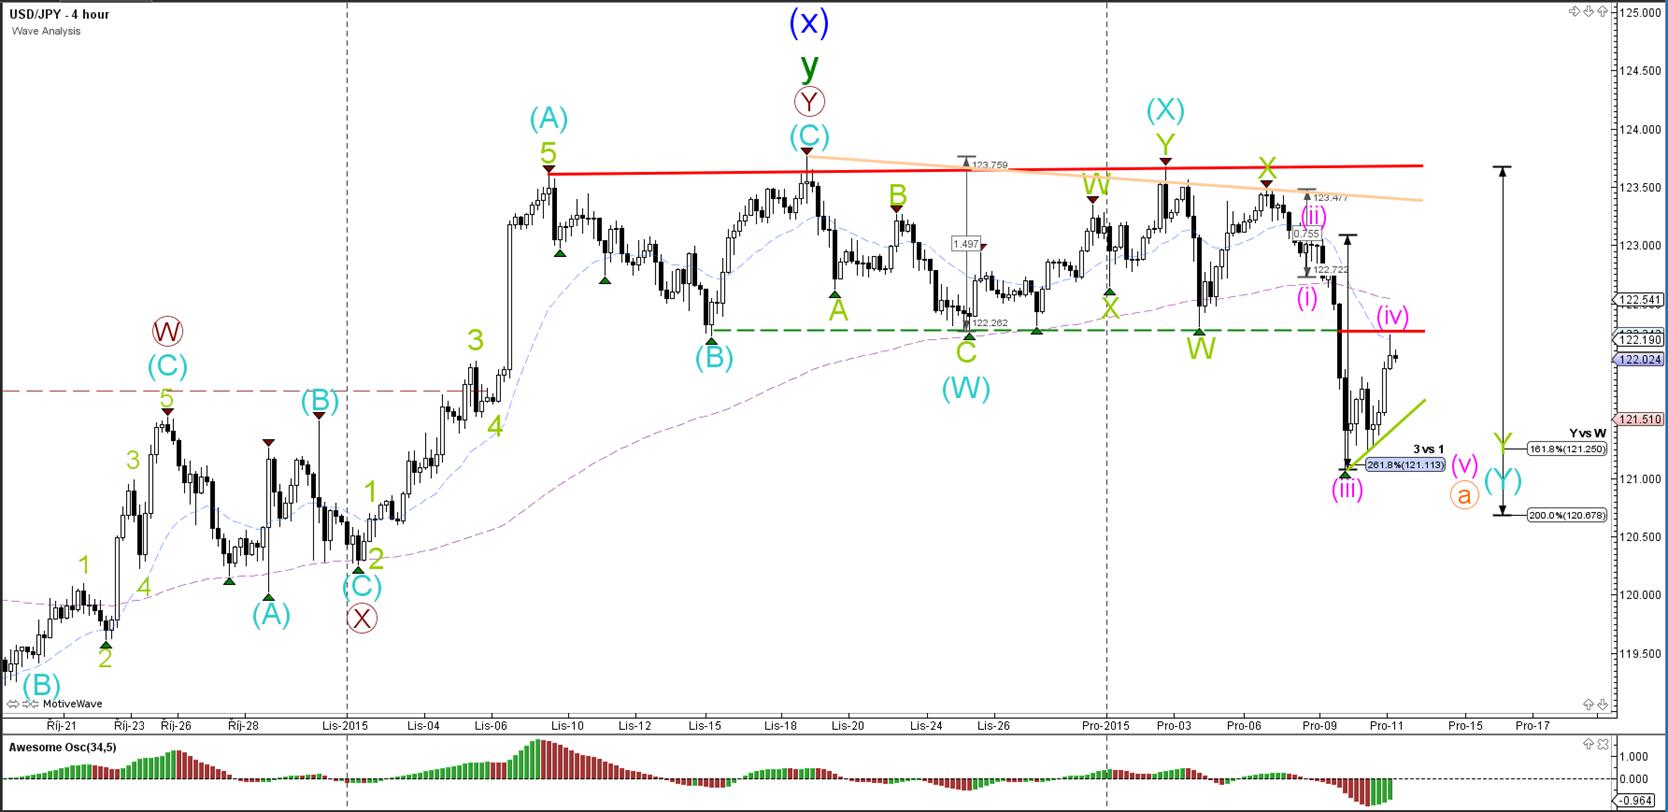
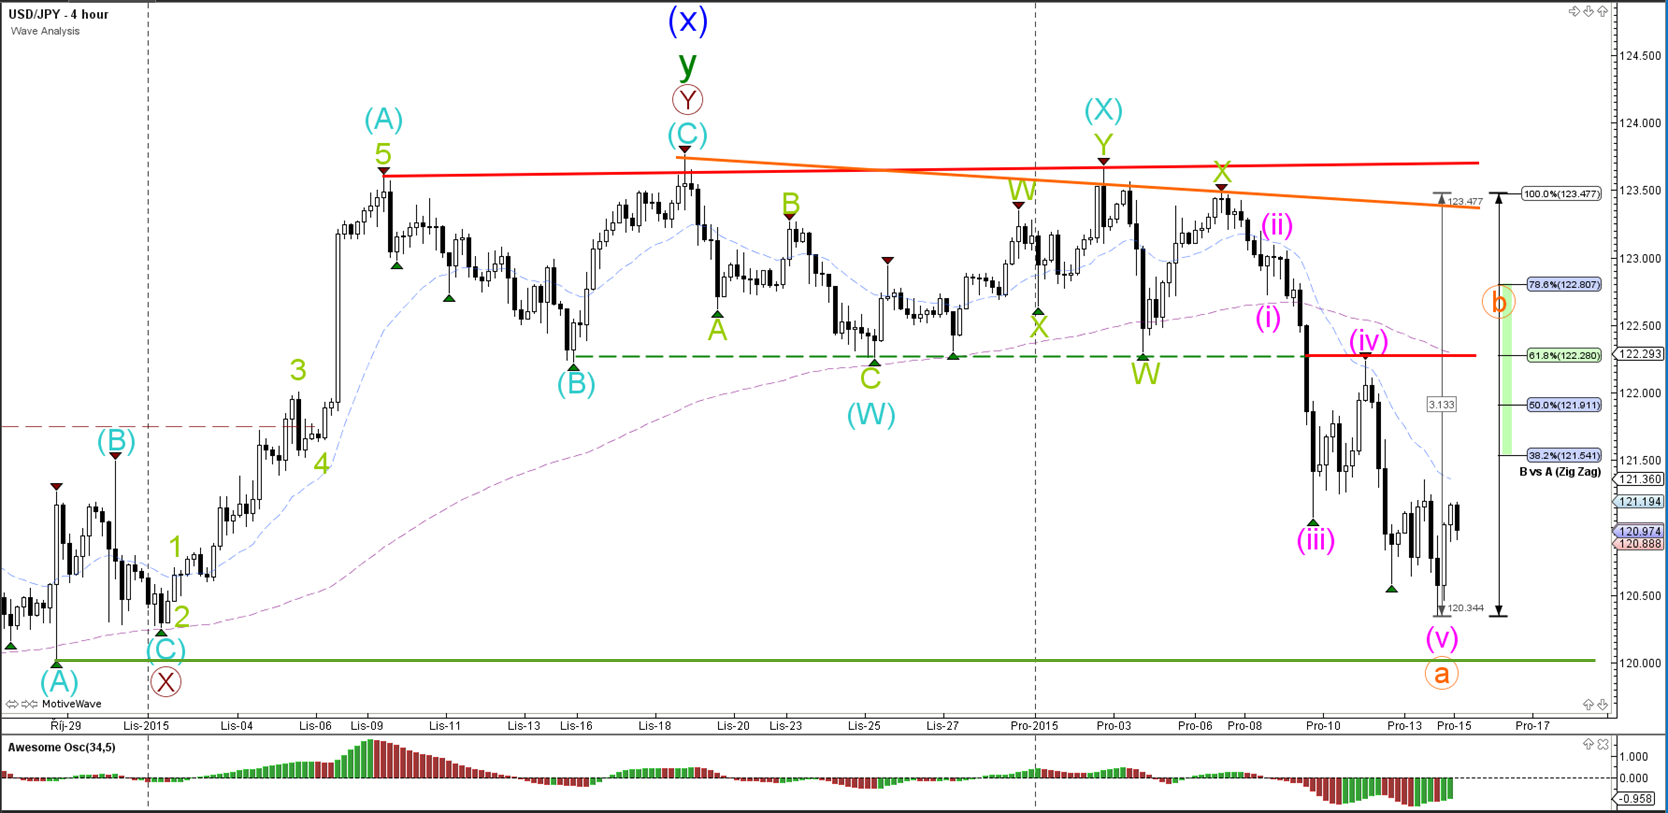
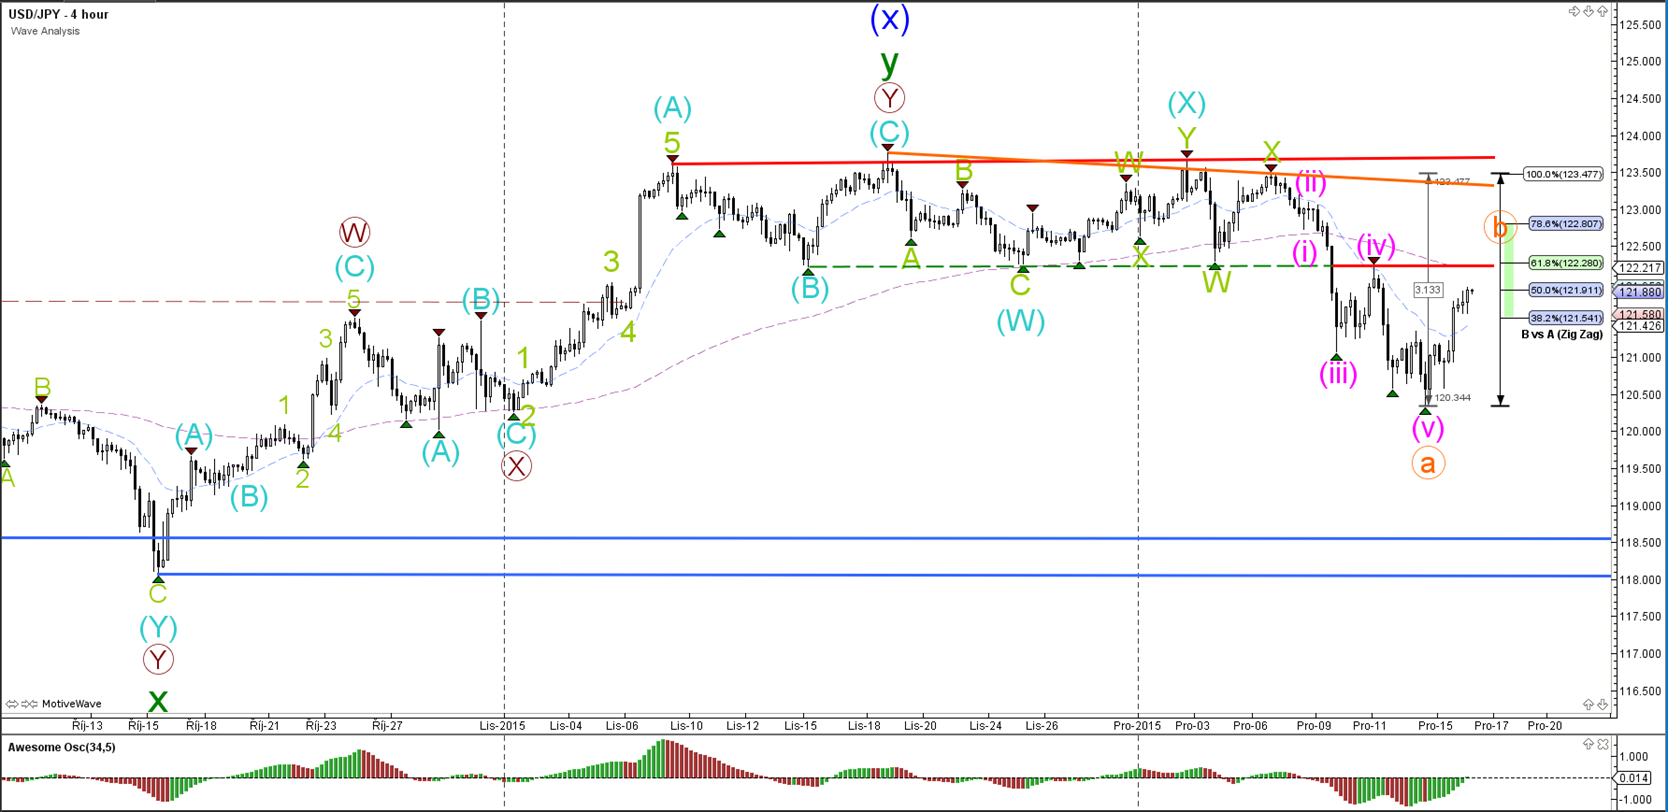
USD/JPY
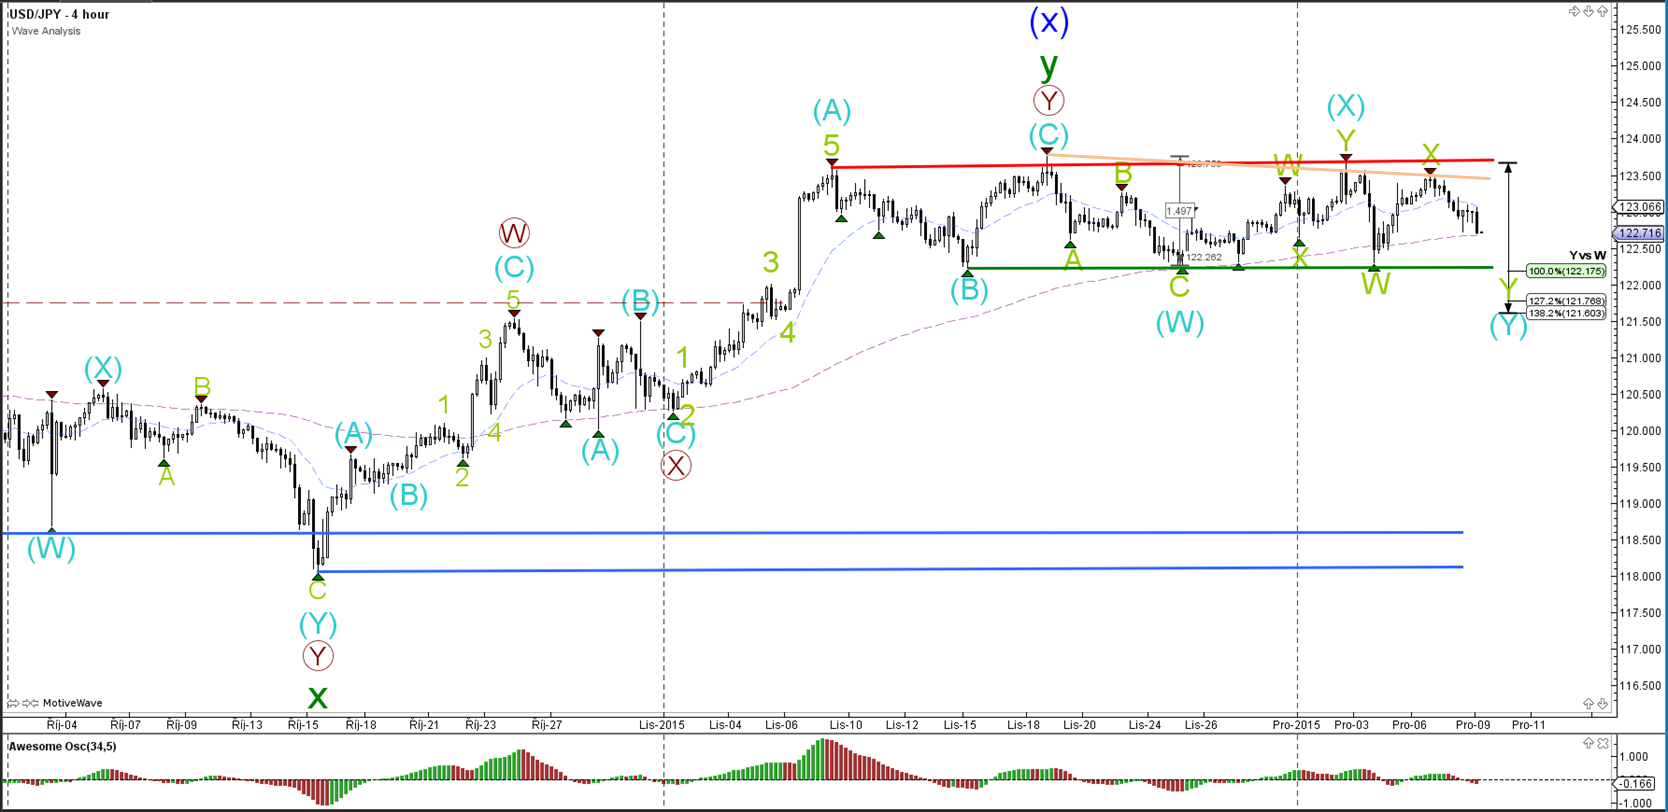
4 hour

The USD/JPY is at the support trend lines (greens), which could act as a bounce or break spot. A break of the long-term support could initiate a larger wave C (blue) correction. A break above resistance (red) could restart the uptrend.
“Original analysis is provided by Admiral Markets”
EUR/USD
4 hour
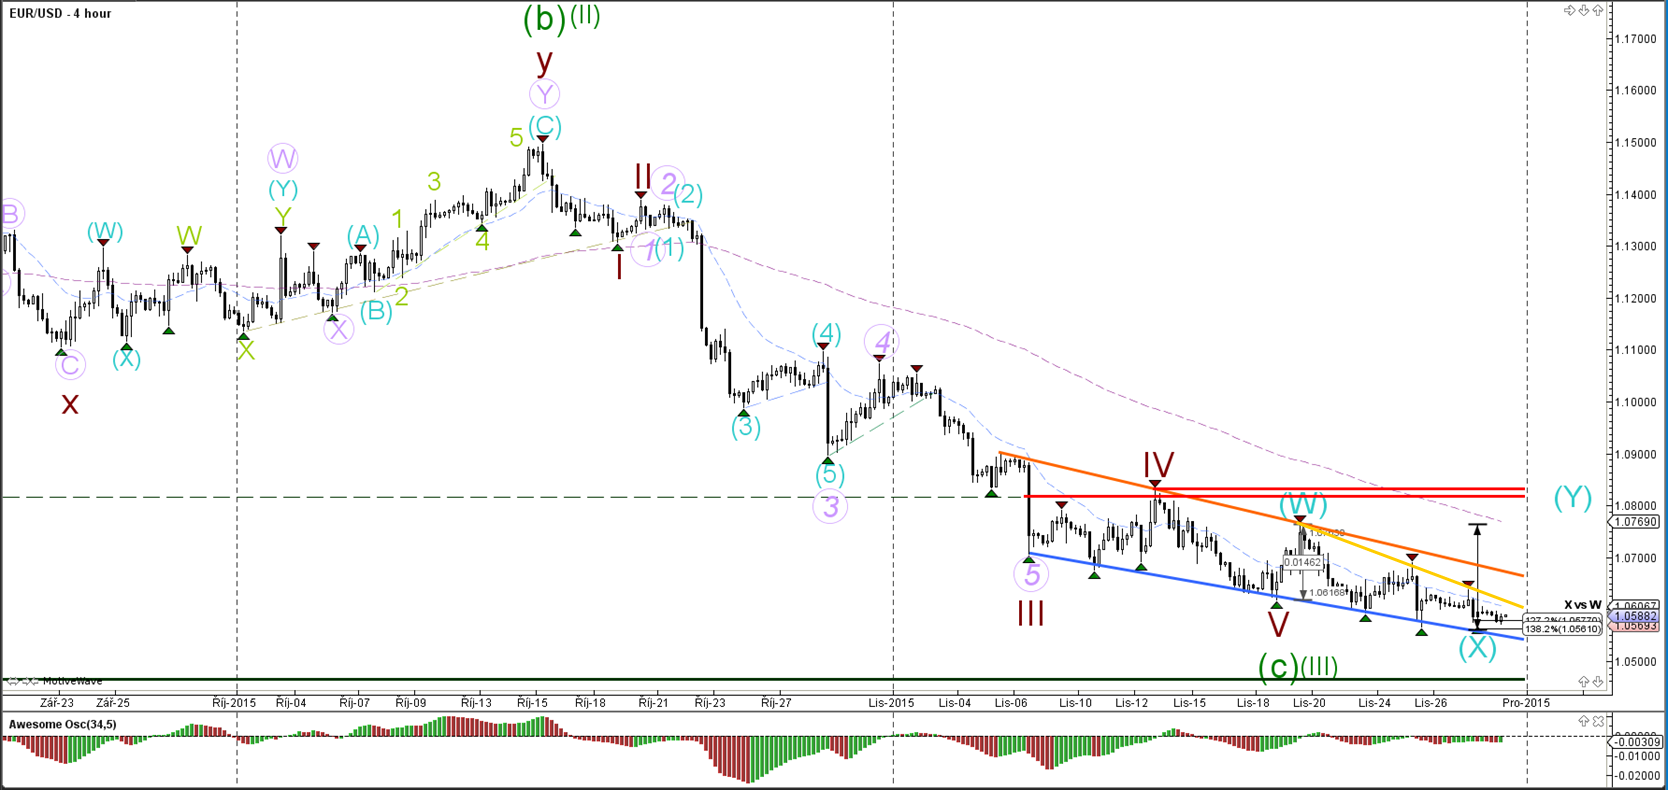
The EUR/USD has so far been unable to break below the 138.2% Fibonacci support level, which could invalidate the wave X (blue) wave count. A break above the resistance trend lines (orange/yellow) could spark a bigger bullish correction.
1 hour
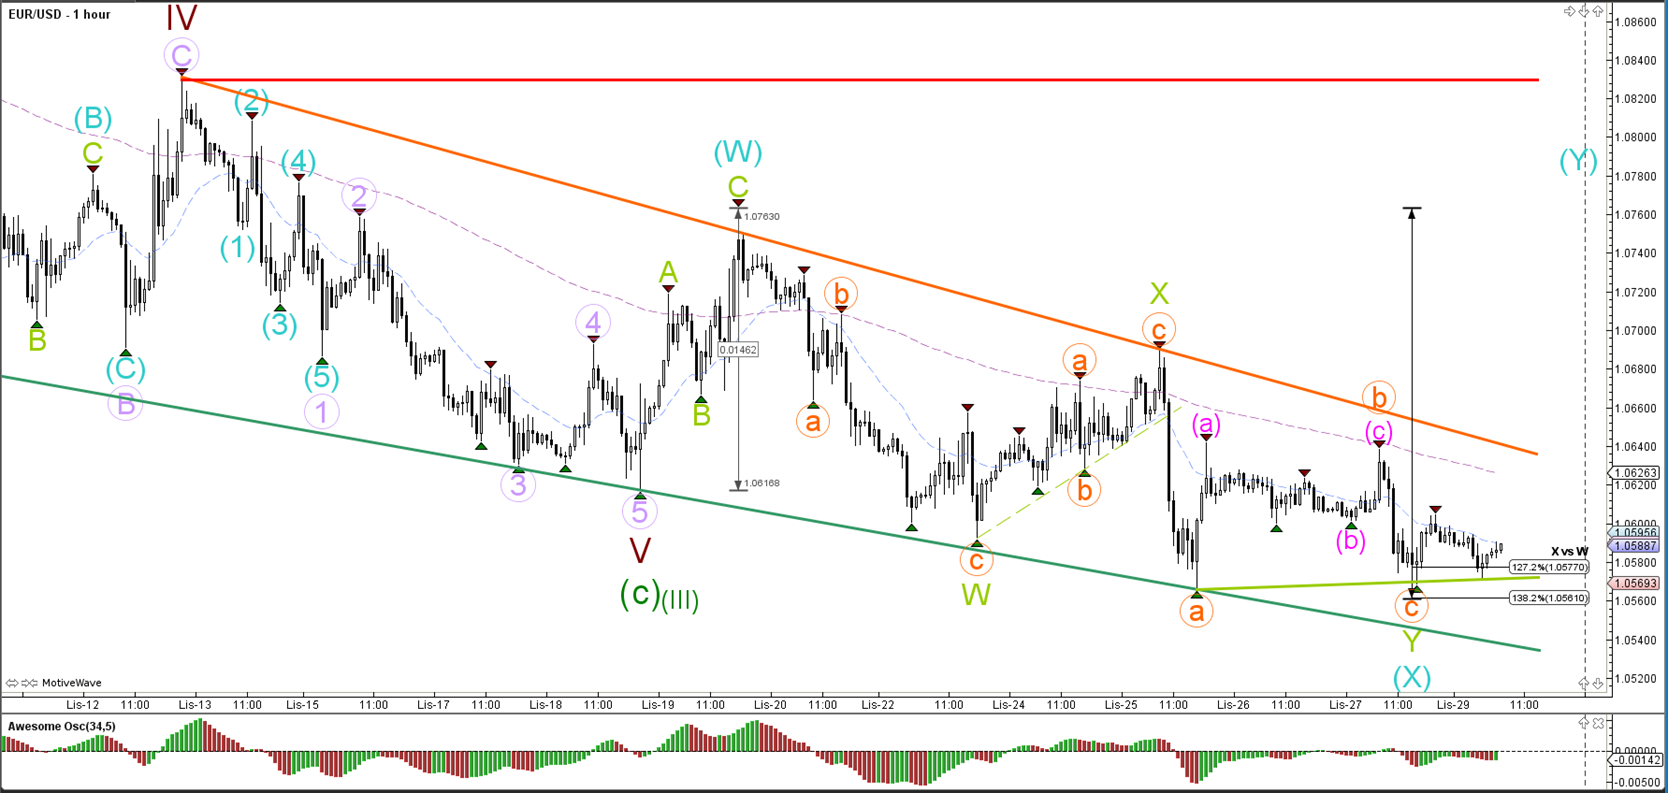
The EUR/USD completed a small ABC zigzag (pink) which was part of a wave B (orange). The bearish wave C (orange) has not been able to break the support trend line (light green), which could be an invalidation level of wave X (blue).
GBP/USD
4 hour

The GBP/USD broke below the support trend line (dotted green) and price is moving lower as part of a wave 5 bearish breakout.
1 hour

The GBP/USD needs to break below the inner support trend line (light green) before wave 5 (blue) has a chance of reaching the 61.8% target (5 vs 1+3).
USD/JPY
4 hour
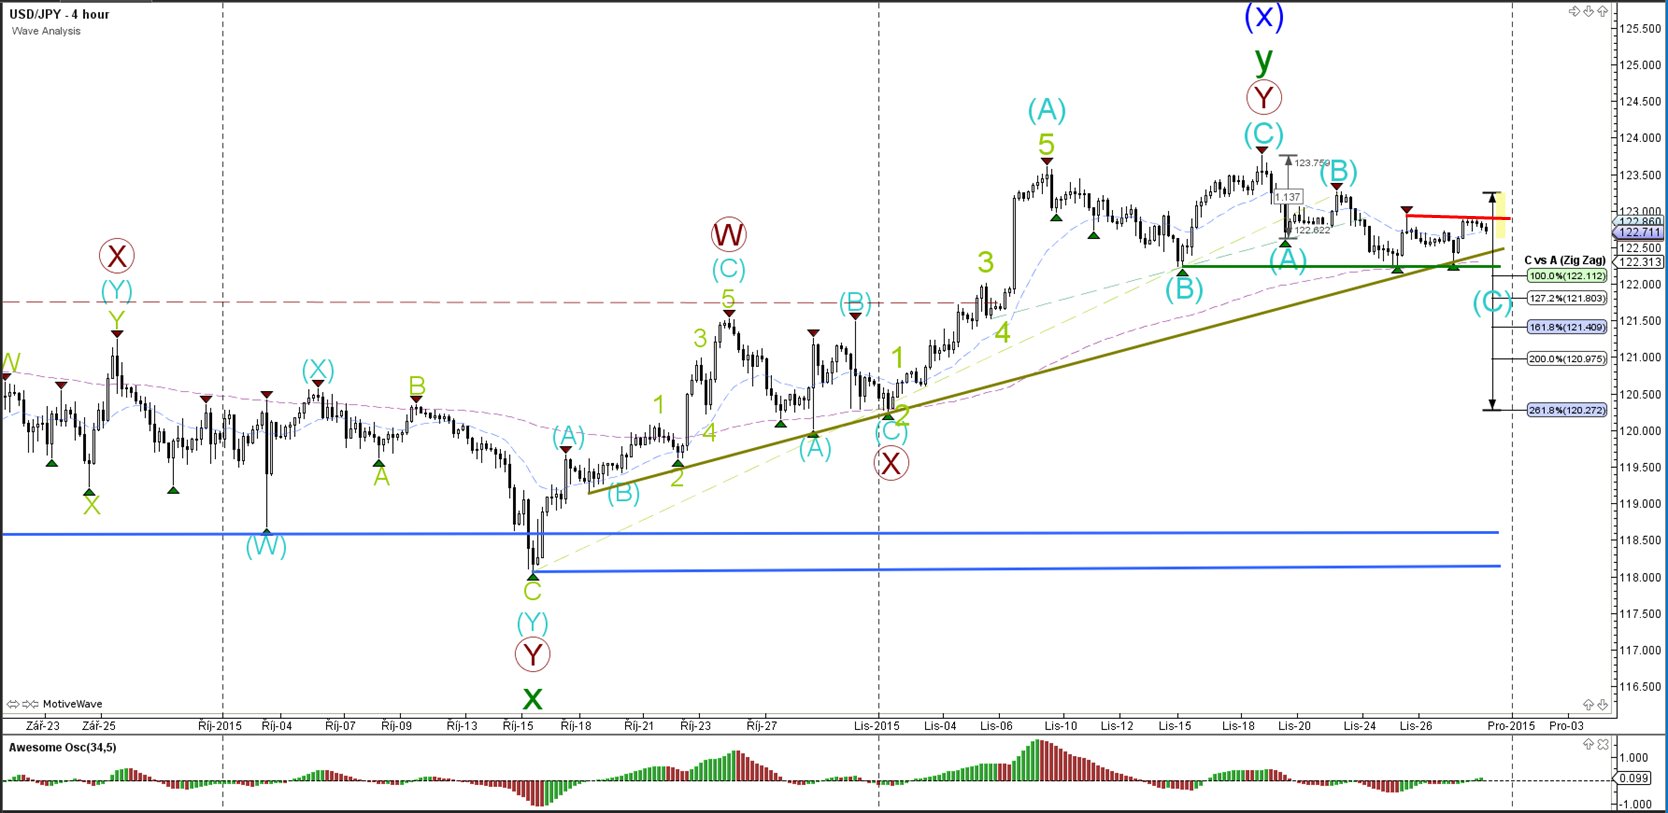
The USD/JPY is at the support trend lines (greens), which could act as a bounce or break spot. A break of the long-term support could initiate a larger wave C (blue) correction. A break above resistance (red) could restart the uptrend.
“Original analysis is provided by Admiral Markets”