Daily Technical Analysis by FxGrow

FxGrow Daily Technical Analysis – 04th Feb, 2016
By FxGrow Research & Analysis Team

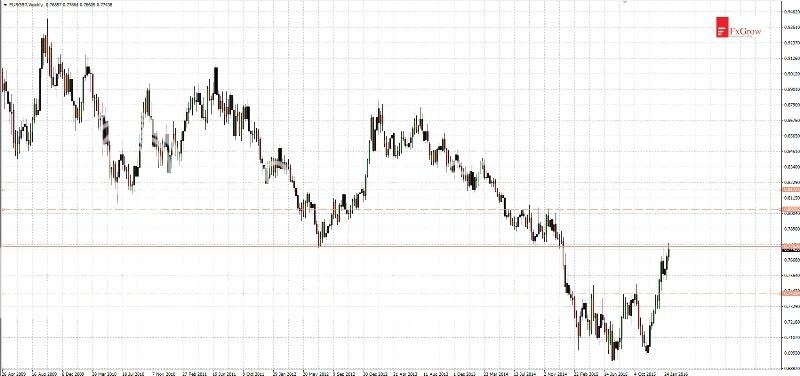
USDJPY - Sharp declines after completed reverse H&S pattern

Such technical price behaviour like last USDJPY movement can't be seen very often. First it formed reverse head and shoulders pattern and BoJ decision was an excuse for upward movement. Target for that movement coincides almost perfectly with reverse H&S potential target (it can be measured by range between the top of the head and neckline). USDJPY after reaching the target begun declines immediately and support at 118.80 didn't stop the price even for a moment.

To read this Full in depth Analysis please visit FxGrowhttp://www.fxgrow.com/analysis-educ...cal-analysis-fxgrow-free-forex-analysis-tools.

Note: This analysis is intended to provide general information and does not constitute the provision of INVESTMENT ADVICE. Investors should, before acting on this information, consider the appropriateness of this information having regard to their personal objectives, financial situation or needs. We recommend investors obtain investment advice specific to their situation before making any financial investment decision.
 
FxGrow Daily Technical Analysis – 04th Feb, 2016
By FxGrow Research & Analysis Team

GBPCAD - huge volatility after BoE decision

Today huge volatility occurred at currency pairs with GBP. It was caused by BoE decision on interest rates. That decision was consistent with forecasts which mean interest rates stayed at the same level. There were a hesitance on the market and just after decision GBPCAD sharply fell to the 1.9890 level and as quickly rebounded. That level was three months support. BoE statement was unequivocal from one side rates hike is possible and from the other lowered the forecast for inflation.

To read this Full in depth Analysis please visit FxGrowhttp://www.fxgrow.com/analysis-educ...cal-analysis-fxgrow-free-forex-analysis-tools.

Note: This analysis is intended to provide general information and does not constitute the provision of INVESTMENT ADVICE. Investors should, before acting on this information, consider the appropriateness of this information having regard to their personal objectives, financial situation or needs. We recommend investors obtain investment advice specific to their situation before making any financial investment decision.
 
FxGrow Daily Technical Analysis – 05th Feb, 2016
By FxGrow Research & Analysis Team

EURUSD - movement in 1.1500 direction, watch out on today's U.S. nonfarm payrolls

Roaring success of the bulls at EURUSD is in full swing. After broke above bearish regression channel price also broke resistances at 1.1050 and 1.1120. Next resistance is at 1.1350 however it looks like the goal for demand is at 1.1500. That level is the upper limit of big channel in which price moved since 12 months. Only once during last year that level was exceeded for two days.

To read this Full in depth Analysis please visit FxGrowhttp://www.fxgrow.com/analysis-educ...cal-analysis-fxgrow-free-forex-analysis-tools.

Note: This analysis is intended to provide general information and does not constitute the provision of INVESTMENT ADVICE. Investors should, before acting on this information, consider the appropriateness of this information having regard to their personal objectives, financial situation or needs. We recommend investors obtain investment advice specific to their situation before making any financial investment decision.
 
FxGrow Daily Technical Analysis – 05th Feb, 2016
By FxGrow Research & Analysis Team

GBPUSD - declines after U.S. nonfarm payrolls readings

After macroeconomic reading of U.S. nonfarm payrolls dollar strengthened. EURUSD and GBPUSD declined, but more interesting situation can be seen at GBPUSD. Nonfarm payrolls grew 151K in January, however that reading is almost 20% worse than the forecast. From the other side the unemployment rate edged down to 4.9% (what is also different from forecasts).

To read this Full in depth Analysis please visit FxGrowhttp://www.fxgrow.com/analysis-educ...cal-analysis-fxgrow-free-forex-analysis-tools.

Note: This analysis is intended to provide general information and does not constitute the provision of INVESTMENT ADVICE. Investors should, before acting on this information, consider the appropriateness of this information having regard to their personal objectives, financial situation or needs. We recommend investors obtain investment advice specific to their situation before making any financial investment decision.
 
FxGrow Daily Technical Analysis – 08th Feb, 2016
By FxGrow Research & Analysis Team

EUR/USD - technical analysis of popular major

In last Thursday we could spot an attempt to break the 1,1250 area, where at least two Fibonacci levels are located. First one is the 61.8% of 24th August bear move - price didn't really test it, but it was really close. Second resistance is a 100% level from the 100% pattern. Measuring the corrective move from 3rd of December we can draw the resistance line right in the place of reversal. This line was perfectly tested by the price and market reaction was perfect as well.

To read this Full in depth Analysis please visit FxGrowhttp://www.fxgrow.com/analysis-educ...cal-analysis-fxgrow-free-forex-analysis-tools.

Note: This analysis is intended to provide general information and does not constitute the provision of INVESTMENT ADVICE. Investors should, before acting on this information, consider the appropriateness of this information having regard to their personal objectives, financial situation or needs. We recommend investors obtain investment advice specific to their situation before making any financial investment decision.
 
FxGrow Daily Technical Analysis – 08th Feb, 2016
By FxGrow Research & Analysis Team

EUR/PLN – significant suport + weekly LONG signal

Single currency to Polish zloty moved above 4.3894 and 38.2% Fibonacci retracement (upward move from December lows) during few last session. Horizontal level had an important role at the end of 2014 – and now acts as the support. Monday’s session brings stronger reflection and move above 4.4300.
2i6ko4l.jpg


To read this Full in depth Analysis please visit FxGrowhttp://www.fxgrow.com/analysis-educ...cal-analysis-fxgrow-free-forex-analysis-tools.

Note: This analysis is intended to provide general information and does not constitute the provision of INVESTMENT ADVICE. Investors should, before acting on this information, consider the appropriateness of this information having regard to their personal objectives, financial situation or needs. We recommend investors obtain investment advice specific to their situation before making any financial investment decision.
 
FxGrow Daily Technical Analysis – 09th Feb, 2016
By FxGrow Research & Analysis Team

EURGBP - highest since a year and test of important resistance

Since a mid-November EURGBP moved in an uptrend. Currently demand has a tough work to do, which is break above resistance at 0.7760. If it succeeds price should gain 250 pips and reach another resistance 0.8030. However if supply is stronger nearest supports will be located at levels: 0.7540, 0.7420.
2016-02-09_analysis_EURGBP-W1_zpsbjktoqno.jpg


To read this Full in depth Analysis please visit FxGrowhttp://www.fxgrow.com/analysis-educ...cal-analysis-fxgrow-free-forex-analysis-tools.

Note: This analysis is intended to provide general information and does not constitute the provision of INVESTMENT ADVICE. Investors should, before acting on this information, consider the appropriateness of this information having regard to their personal objectives, financial situation or needs. We recommend investors obtain investment advice specific to their situation before making any financial investment decision.
 
FxGrow Daily Technical Analysis – 09th Feb, 2016
By FxGrow Research & Analysis Team

USDJPY - new week, new low

There is a black scenario in game at USDJPY and today price reached 14-months low. It have to be noted that such scenario was indicated in the last week's analysis. I wrote: "Currently price should continue previous declines. Nearest support is at 116.70 but even this year's low at 116.10 could be tested".

To read this Full in depth Analysis please visit FxGrowhttp://www.fxgrow.com/analysis-educ...cal-analysis-fxgrow-free-forex-analysis-tools.

Note: This analysis is intended to provide general information and does not constitute the provision of INVESTMENT ADVICE. Investors should, before acting on this information, consider the appropriateness of this information having regard to their personal objectives, financial situation or needs. We recommend investors obtain investment advice specific to their situation before making any financial investment decision.
 
FxGrow Daily Technical Analysis – 10th Feb, 2016
By FxGrow Research & Analysis Team

AUDCAD - rebound from support near 0.9730

Since the beginning of January AUDCAD moved down. In this particular time support at area 0.9820 - 0.9840 stopped declines. Yesterday this support was broken below and price sharply fell 100 pips reaching 0.9730. Support at 0.9730 is very strong, it can be seen at weekly TF. Price rebounded at indicated level and upward movement continues today.


To read this Full in depth Analysis please visit FxGrowhttp://www.fxgrow.com/analysis-educ...cal-analysis-fxgrow-free-forex-analysis-tools.

Note: This analysis is intended to provide general information and does not constitute the provision of INVESTMENT ADVICE. Investors should, before acting on this information, consider the appropriateness of this information having regard to their personal objectives, financial situation or needs. We recommend investors obtain investment advice specific to their situation before making any financial investment decision.
 
Back
Top