Technical Analysis by Admiral Markets

Technical Update - EURCAD, GBPCAD and CADJPY
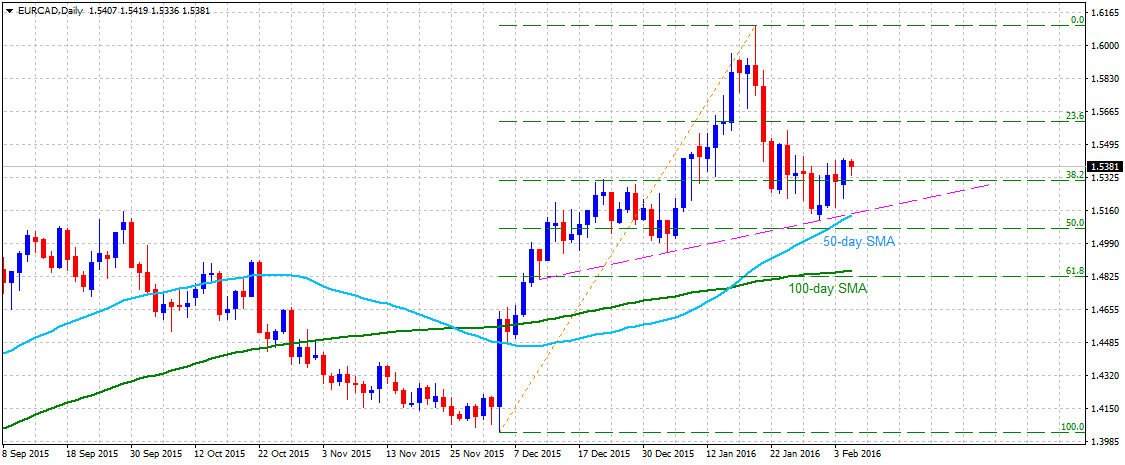
EURCAD


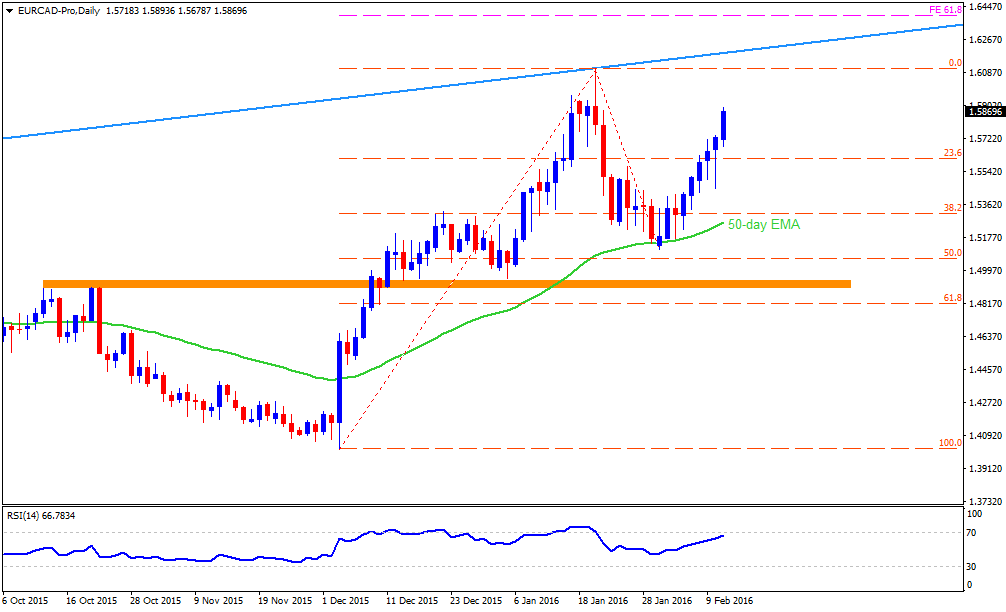
Although the pair continues to hold and rebound from a short-term ascending trend-line support, it has failed to extend the momentum 1.5410-30 immediate horizontal resistance. Sustained move above 1.5410-30 resistance, leading to a subsequent strength above 1.5500 round figure mark, is likely to assist the pair back towards 1.5600 mark resistance, representing 23.6% Fib. retracement level of it's Dec. 2015 lows to Jan. 2016 highs up-swing. On the downside, 38.2% Fib. retracement level near 1.5300 round figure mark seems to act as immediate resistance. Failure to hold this immediate support is likely to drag the pair back towards testing the short-term ascending trend-line support, currently near 1.5150 region, also coinciding with 50-day SMA support. Decisive break below 1.5150 important support confluence is likely to make the pair vulnerable to extend its near-term downward trajectory towards its next important support confluence near 1.4850-30 area, comprising of 100-day SMA and 61.8% Fib. retracement level.

GBPCAD


After falling below 200-day SMA for the first time since May 2015, the pair has increased the possibilities of confirming a bearish Double-Top chart-pattern. The bearish patterns would be confirmed once the pair decisively breaks below 1.9800 important support. From current levels, 38.2% Fib. retracement level of Apr. to Aug. 2015 upswing (1.9900 area), seems to provide immediate downside support. Sustained break below 1.9800 important support would confirm the bearish pattern, thus paving way for continuation of the pair's downward trajectory in the near-term. On the upside, move back above 200-day SMA (2.0000 psychological mark) is likely to witness a follow-up strength towards 2.0060-80 strong horizontal resistance. Although the pair could extend the up-move beyond 2.0060-80 resistance, but any further up-move might now be capped near 2.0240-60 strong resistance area, nearing 23.6% Fib. retracement level.
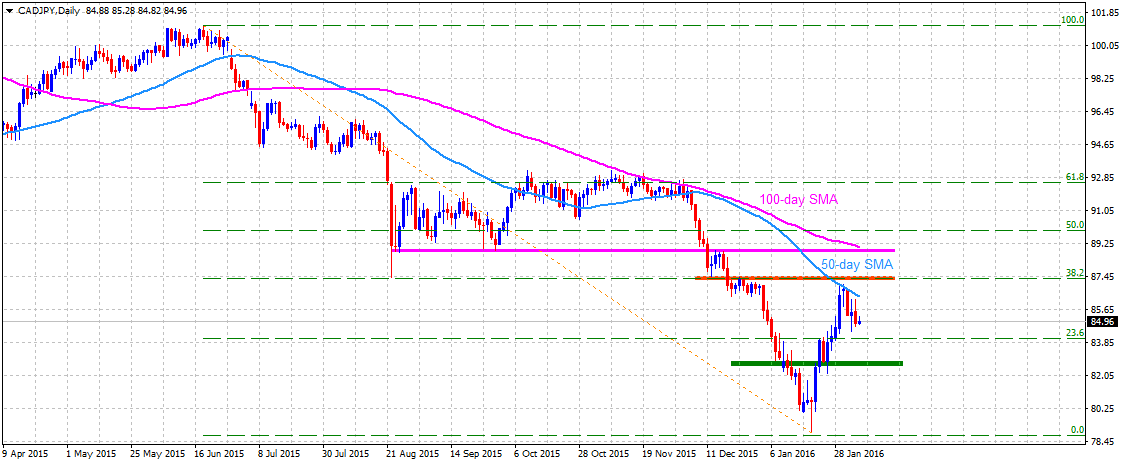
CADJPY


The pair's sharp recovery from the lowest level since Nov. 2012 failed to lift it beyond it's immediate strong resistance near 87.00-87.20 zone, comprising of 38.2% Fib. retracement level of June 2015 to Jan. 2016 down-leg and 50-day SMA. The pair subsequently has dropped back below 85.00 psychological mark. From current levels, 23.6% Fib. retracement level near 84.00 mark seems to act as immediate support, which if broken is likely to drag the pair towards its next major support near 82.60-50 horizontal area. Meanwhile on the upside, strength above 85.00 mark, leading to a momentum above 85.50 level, seems to lift the pair back towards retesting 50-day SMA resistance, currently near 86.40-50 area. Further, sustained trade above 50-day SMA might now assist the pair to surpass 38.2% Fib. retracement level resistance near 87.00-87.20 area and lift it towards its previous support now turned major resistance near 88.80-89.00 region, also nearing 100-day SMA.


“Original analysis is provided by Admiral Markets
 
US Equity Indices: Technical Check

Dow Jones Industrial Average [DJI30]


The 38.2% Fibonacci Retracement of its May – August 2015 south-run, near 16440-50 region, seems currently restricting the DJI30 bounce from 15450 mark, which if broken can quickly accelerate the index towards 16620 and the 16700 resistance levels. Should the equity gauge continue extending its march beyond 16700, the 50% Fibo, around 16800, is likely an intermediate upside level for the index to test before it could aim for 50-day SMA of 16940 and the 17090 – 17100 horizontal resistance-zone. Meanwhile, pullbacks from the current stats might fetch the gauge to 16130 immediate support before it could drop to 15980-70 region, encompassing 23.6% Fibo level. Given the index downside below 15970, the 15840-35 and the 15650 are likely numbers that it could rest around ahead of re-testing the 15450 mark. Moreover, additional decline below 15450 can make the US equity gauge vulnerable enough to plunge towards August 2015 lows of 15250.

S&P 500 [SP500]


Ever since the S&P 500 dropped below four year old ascending trend-line support, now acting as resistance near 1992, the index plunged to the lowest levels in more than a year; however, 1810-20 horizontal support-zone triggered the gauge's bounce which presently struggles between the 1992 and the 1850 range with oversold RSI favoring the upside than the otherwise case. Should the index broke above the trend-line resistance of 1992, also surpasses the 2000 psychological magnet, it can find multiple resistances within 2045-50 area. Moreover, successful break of 2050 can further propel the index towards 2080 and the 2100 mark before challenging the May 2015 highs of 2135. On the downside, a weekly close below 1850 can fetch the index to re-test 1820-10 region, breaking which it can accelerate the downside to 38.2% Fibonacci Retracement of its October 2011 to May 2015 upside, near 1730 mark. Given the gauge's inability on the part of the index to hold 1730, it can stretch the southward trajectory to 1685 and the 1630 mark prior to visiting the June 2013 lows around 1560.

Nasdaq [NQ100]


Unlike the DJI30 & SP500, the Nasdaq [NQ100] seems more inclined towards testing the 50% Fibonacci Retracement level of its April 2014 - November 2015 upside, near 4075, clearing which it can drop to more than a year old ascending trend-line support around 4013 – 4010. Should it closes below 4010 and sustains the downside break, the index can be fetched to 3920-15 area, encompassing the 61.8% Fibo, while further south-run below 3915 can make the gauge test August 2014 lows around 3830. Alternatively, the index bounce from the current level can be confined by 38.2% Fibo level of 4230, breaking which 4275 and the 4320 are likely consecutive numbers that it could print. Given the gauge's capacity to surpass 4320, it can rally to 4400 and the 23.6% Fibo, near 4425, before the 100-day and 200-day SMA confluence, near 4455-60, restricts its further north-run.


“Original analysis is provided by Admiral Markets
 
Technical Overview: EURUSD, GBPUSD, AUDUSD and NZDUSD

EURUSD


Even as the last week's rally propelled the EURUSD towards breaking 100-day and 200-day SMA, the pair's up-move seems presently confined by the 1.1240-60 resistance-zone, encompassing five month old descending trend-line and 61.8% Fibonacci Retracement of its August – December 2015 downside. Considering the overbought RSI levels, coupled with nearness to important resistance, chance are brighter that the pair may be pulled back to its 1.1100 immediate support level, clearing which 200-day SMA, at 1.1055 now, may hold its intermediate moves before the pair could re-test the 1.0980 – 1.0970 support-zone, which comprises of 100-day SMA and the 38.2% Fibo level. Moreover, pair's further downside below 1.0970 negates the chances of its near-term advance and can fetch the prices to 1.0850 and the 1.0800 support marks. Meanwhile, a daily closing above 1.1260 can quickly fuel the pair to 1.1330 and the 1.1450 upside level while successful trading above 1.1450 may further enable it to rally towards 1.1500, 1.1560 and the 1.1600 levels before targeting the August highs around 1.1715.

GBPUSD


While upbeat economics pulled back the GBPUSD from 1.4100 – 1.4080 support-zone, the pair failed to surpass the 50-day SMA level, at 1.4690 now, and is presently expected to drop towards testing the immediate ascending trend-line support of 1.4375. Given the pair's inability to hold the trend-line, renewed downside pressure to 1.4230-20 can be triggered, breaking which the pair can again be fetched to 1.4100 – 1.4080 area. Moreover, its further weakness below 1.4080 can make it vulnerable enough to test the 1.3800 region. On the upside, 23.6% Fibonacci Retracement of its June 2015 – January 2016 downside, near 1.4520, can act as immediate resistance for the pair, surpassing which can propel the pair to 50-day SMA level of 1.4690. Should he pair closes above 1.4690, also surpasses the 1.4700 mark, the 38.2% Fibo level of 1.4790, is likely an intermediate resistance for the pair to clear before it could witness the 1.4960-70 important resistance area, including 100-day SMA and the five month old descending trend-line resistance.

AUDUSD


AUDUSD presently struggles to break a month old ascending trend-channel support of 0.7060 on a Daily closing basis, clearing which it can immediately drop to 0.6980 and the 0.6925-20 supports while sustained downside below 0.6920 can extend the pair's southward trajectory to January lows of 0.6825. Moreover, pair's continued decline below 0.6825, also breaking the 0.6800 mark, can further magnify its downturn to 0.6600 area. Alternatively, a daily close above 0.7100 mark may have to clear the 0.7145-50 zone, including the 100-day SMA and the 23.6% Fibonacci Retracement of its May 2015 – January 2016 upside, in order to test the channel resistance around 0.7245-50. If the pair manages to stretch its north-run beyond 0.7250, it becomes capable enough to challenge the 0.7325-40 region, including the 200-day SMA and the 38.2% Fibo, surpassing which the pair's further rise can be capped by 0.7385 – 0.7400 important horizontal resistance.

NZDUSD


Having failed to surpass the 200-day SMA, the NZDUSD is likely declining to 0.6550-40 nearby support-zone, which if cleared can fetch the pair prices to 0.6420-25 horizontal support. Should it drops below 0.6420, coupled with a close beneath 0.6400 round figure mark, it can quickly test the 0.6300 support before resting around the September 2015 lows of 0.6235. If the manages to bounce from its 23.6% Fibonacci Retracement level of its April – September 2015 downside, near 0.6595 – 0.6600, the 0.6660 might hold its intermediate up-moves before it could re-test the 200-day SMA level of 0.6700 mark. Moreover, pair's successful advance beyond 0.6700 can propel it to 38.2% Fibo level of 0.6810 before the 0.6880 – 0.6900 horizontal resistance-zone restrict its further rise.


“Original analysis is provided by Admiral Markets
 
Technical Check - USDJPY, GBPJPY, EURJPY and CHFJPY

USDJPY


The pair finally broke through an important support near 116.00 mark and extended its weakness to nearly test 114.00 mark, representing 23.6% Fib. retracement level support of its big up-move from Oct. 2011 lows to multi-year highs touched in May 2015. The pair, however, recovered from lower levels and is now trading comfortably above 115.00 mark. From current levels, any attempts of recovery might now face resistance at the important support break-point near 116.00-116.10 area. Considering that the pair has now decisively weakened below the very important support, any further recovery might now be capped near 118.00 mark. Meanwhile on the downside, 114.00 mark might continue to provide immediate support for the pair. Decisive drop below 114.00 mark now seems to open room for further near-term depreciation towards its next major support near 110.00 psychological mark.

GBPJPY


The pair's reversal from 50% Fib. retracement level of Dec. 2015 high to Jan. 2016 down-leg dragged it back below 165.00 mark. Although the pair has managed to rebound from lower levels, attempts of further recovery might now face immediate resistance near 167.00 round figure mark. Recovery beyond 167.00 mark might now be limited at 168.50 strong resistance area, nearing 23.6% Fib. retracement level. Furthermore, resumption of weakness and a subsequent drop back below 166.00-165.80 area seems to increase the pair's vulnerability to retest Jan. 2016 lows support near 164.00 mark, which if broken has the potential to continue dragging the pair towards 61.8% Fib. expansion level support near 161.20-161.00 mark. Only a sharp rebound from current levels and a subsequent strength above 168.50 strong resistance might negate the near-term bearish outlook for the pair.

EURJPY


Extending its reversal from an important resistance confluence near 132.40-60 zone, comprising of 100-day SMA and the upper trend-line resistance of a well-established descending trend-channel formation on daily chart, the pair dropped back below 130.00 psychological mark support to test 128.40-20 intermediate support. Weakness below this intermediate support might now force the pair towards testing the lower trend-line support of the channel, currently near 125.40-30 area. Meanwhile on the upside, the pair is likely to confront immediate strong resistance near 130.00 psychological mark. This is followed by a horizontal resistance near 130.90-131.00 mark and 132.00 confluence resistance. Even if the pair manages to clear these resistance level, the near-term bearish outlook might get negated only once it decisively conquers the descending trend-channel resistance.

CHFJPY


The pair continues to oscillate within a well-established descending trend-channel formation on daily chart and now seems to face difficulty in moving back above Dec. 2015 lows. The pair is currently trading below 61.8% Fib. expansion level, support turned immediate resistance. Should the pair fail to register any meaningful bounce from current levels and continue trading below 117.60-50 support turned resistance area, it seems more likely to drift lower towards testing the lower trend-line support of the channel, currently near 115.20-115.00 psychological mark. Alternatively, move back above 117.60-50 immediate resistance might continue facing resistance near 118.60-70 area. Only a decisive strength above 118.60-70 resistance might negate the bearish outlook, and thus paving way for a retest of the very important, 100-day SMA resistance, currently near 121.00-121.20 region.


“Original analysis is provided by Admiral Markets
 
EURAUD, AUDJPY, AUDCAD And AUDCHF: Technical Update

EURAUD


Although two month old ascending trend-channel continue favoring the EURAUD up-move, pair's immediate rise seems stopped by the downward slanting trend-line, stretched from August highs, which if not cleared, can pull the pair back to 1.5700 immediate support. Should the pair extends the corrective move below 1.5700, the 1.5500 might act as intermediate halt during its decline to the channel support of 1.5430 mark, breaking which 100-day SMA, near 1.5350, is likely a small number that the pair needs to clear prior to targeting the 50% Fibonacci Retracement of its April – August 2015 upside, near 1.5130. Meanwhile, successful break above the trend-line resistance of 1.6050 can propel the pair to channel resistance-line, around 1.6300, breaking which chances of its rally to August highs of 1.6600 can't be denied.

AUDJPY


Following its failure to surpass the 100-day SMA, together with the 61.8% Fibonacci Retracement of its June 2012 – April 2013 upside, the AUDJPY was again fetched down towards testing the January month lows of 79.20. Given the pair maintains its south-run below 79.20, the channel support of 76.60 might give rise to its bounce, failing to which can further drag it down to June 2012 lows of 74.30. Should the pair reverses from current levels, 82.00 – 82.10 may provide immediate resistance to it, breaking which 83.50 and the 85.00 are expected consecutive numbers that the pair might aim for before conquering with the 85.90 – 86.10 region, encompassing the 100-day SMA and the 61.8% Fibo. If the pair manages to clear the important resistance-zone and sustains up-move above 86.10, the 87.70 may act as a buffer during its run-up to channel resistance level of 89.00 round figure mark.

AUDCAD


Since the start of the year 2016, the AUDCAD kept following a descending trend-channel formation, which recently provided a pullback to the pair's downside; however, 50-day SMA and the 23.6% Fibonacci Retracement of its September – December up-move, near 0.9930-40, could hold back its further advance. If at all the pair closes above 0.9940, the mentioned channel resistance, at 1.0010 now, may not allow the pair to rally further, failing to which can propel its upward trajectory to 1.0100 and the December highs of 1.0170. On the downside, a close below 38.2% Fibo level of 0.9780 can again force the pair to test channel support of 0.9700. Should the pair drops below 0.9700 mark, also clears the 100-day SMA level of 0.9685 and the 50% Fibo level of 0.9650, it can plunge to 0.9500 round figure mark.

AUDCHF


With repeated failures to clear the 0.7290 – 0.7300 area, comprising of 38.2% Fibonacci Retracement of its September 2014 – January 2015 downside, the AUDCHF was dragged down to the lowest level since October 2015; though, the pair failed to close below five month old trend-line support, presently at 0.6825, and is presently seems confined by the 23.6% Fibo level, near 0.6950. If the pair stretches its recent pullback beyond 0.6950, the 0.7040 and the 0.7100 – 0.7110 resistance confluence, including 100-day and 200-day SMA, are likely important upside levels to consider for the pair traders. Should it manage to clear the 0.7110 it becomes capable enough to again challenge the 0.7290 – 0.7300 area, which if broken can further fuel the pair prices towards 1.5 years old trend-line resistance of 0.7380. Alternatively, a daily closing below 0.6825 can quickly fetch the pair prices to 0.6700 mark before a year old ascending trend-line support, near 0.6630 limits its further downside. However, pair's extended southward trajectory below 0.6630 can make it weaker enough to test the January 2015 lows around 0.6400 mark.


“Original analysis is provided by Admiral Markets
 
Technical Update - NZDCAD, AUDNZD, NZDCHF and GBPCHF

NZDCAD


Bounce back from 0.9060-40 confluence support, comprising of the lower trend-line support of a descending trend-channel formation on daily chart and 38.2% Fib. retracement level of Aug. to Dec. sharp up-move, lifted the pair back to a strong resistance confluence near 0.9250-60 area, comprising of the upper trend-line of the channel and 23.6% Fib. retracement level. The short-term ascending trend-channel along-with pair's sharp up-move from Aug. 2015 lows seems to form a bullish continuation, Flag chart pattern, suggesting further upside once the pair decisively conquers 0.9250-60 resistance area. Sustained strength above 0.9250-60 resistance has the potential to lift the pair back towards an important resistance near 0.9550-60 area. Meanwhile, reversal from current resistance area and a subsequent weakness below 0.9150 level could force the pair back towards 38.2% Fib. retracement level intermediate support near 0.9060-50 zone. The downfall could further get extended towards testing the lower trend-line support of the channel, which currently is pegged near 0.8970-50 region.


AUDNZD


After failing to sustain its strength above 200-day SMA, the pair dropped to test an intermediate support near 1.0600 mark. Should the pair fail to hold 1.0600 mark support, it might continue drifting lower to retest the very important psychological mark support near 1.0500 region. Further, a decisive break below 1.0500 mark now seems to increase the pair's vulnerability to extend its near-term weakness towards 1.0320-1.0300 mark, representing 61.8% Fib. expansion level. Meanwhile on the upside, strength above 1.0700 round figure mark might now confront immediate resistance near 1.0780-90 area, marking 23.6% Fib. retracement level of Aug. to Oct. 2015 downfall. Momentum above this immediate resistance might get extended but is likely to be capped at the very important 200-day SMA resistance, currently near 1.0900-1.0920 region, also nearing 38.2% Fib. retracement level. Only a sustained strength back above 200-day SMA might negate any near-term bearish outlook for the pair.


NZDCHF


The pair's reversal from 0.6850-60 strong resistance and a subsequent break below 50-day, 100-day and 200-day SMA support, has now dragged the pair back below 0.6500 mark. The pair is currently trading near 38.2% Fib. retracement level of Aug. to Dec. 2015 up-swing. From current levels, should the pair continue trading below 200-day SMA (below 0.6500 mark) it remains vulnerable to test 50% Fib. retracement level important support near 0.6340-20 area. Below 50% Fib. retracement level support is likely to trigger a fresh leg of weakness towards 61.8% Fib. retracement level support near 0.6200-0.6190 area. Alternatively, move back above 200-day SMA might continue to face resistance at 100-day SMA, currently near 0.6550-60 area, and 0.6600-0.6620 confluence region comprising of 50-day SMA and 23.6% Fib. retracement level. Momentum above theses resistance levels should negate any bearish outlook, thus assisting the pair back towards retesting the very important resistance near 0.6850-60 area.

GBPNZD


Even as the pair has managed to hold 61.8% Fib. retracement level support of its Apr. to Aug. up-move, it continues trading below important moving averages and has also broken below a short-term ascending trend-line support. Considering that the pair has failed to register any meaningful recovery from immediate support level, it seems more likely to extend its weakness in the near-term. Hence, from current levels weakness below 61.8% Fib. retracement level support near 2.1550-30 area is likely to get extended towards the pair's next major support near 2.1000 psychological mark. Meanwhile on the upside, strength above 2.1900 round figure mark is likely to confront immediate strong resistance at 50-day SMA, currently near 2.2100 region. Any attempts of conquering 50-day SMA resistance might now be capped at 50% Fib. retracement level resistance near 2.2200-2.2220 area.


“Original analysis is provided by Admiral Markets
 
Technical Check: Important CAD Pairs

USDCAD


USDCAD's downside from 1.4690 seems successfully stopped by the 100-day EMA during last Thursday; however, 1.4080 – 1.4100 area, including the 23.6% Fibonacci Retracement of its June 2015 – January 2016 up-move, can hold the pair's immediate advance. Should the pair manage to clear the 1.4100 on a closing basis, fresh buying can propel the pair towards 1.4300 area, which if broken might enable the pair to target 1.4400 and the 1.4590 – 1.4600 resistance region prior to re-testing the 1.4690 – 1.4700 zone. On the downside, 1.3800 and the 38.2% Fibo level near 1.3700, quickly followed by the 100-day EMA, near 1.3660, are likely important support level that the pair traders should watch for. If the pair drops below 1.3660, ascending trend-line resistance, stretched from June 2015, near 1.3500, becomes an important support for the pair. Given the pair's inability to hold the 1.3500 trend-line support, it becomes weaker enough to test sub-1.3300 zone.

EURCAD


Following its reversal from 50-day EMA, the EURCAD is more likely to march towards January highs of 1.6110, breaking which fourteen month old ascending trend-line resistance, around 1.6200, followed by the 61.8% FE of its December 2015 – January 2016 upside, near 1.6400, are consecutive upside resistances that the pair might aim for. Given the extended rise beyond 1.6400, the pair can witness 1.6700 area as a follow-on resistance. Alternatively, 23.6% Fibonacci Retracement level of the said advance, near 1.5610, offers nearby support to the pair, clearing which it could dip to 1.5400; though, pair's further downside below 1.5400 needs to clear the 38.2% Fibo level of 1.5300 and the 50-day EMA number, 1.5260, in order to stretch its southward trajectory towards 1.5050 and the 1.4930 – 1.4900 broad support area.

GBPCAD


Even if the GBPCAD bounced-off from the 1.9800 – 1.9860 broad support region, pair's immediate upside seems hindered by the 100-day EMA and the 23.6% Fibonacci Retracement of its April – August 2015 rally, around 2.0270 – 2.0300. If the pair manages to clear the said resistance region, the 2.0360 and the 2.0560 are likely consecutive upside numbers that it should witness. Moreover, pair's sustained up-move beyond 2.0560 can propel it towards 2.0800 mark. Meanwhile, pair's pullback from the current level can fetch it to 2.0120 immediate support, breaking which 2.0000 psychological magnet and the 1.9900 may provide rest to the pair's extended south-run while pair's break of 1.9900 could find multiple supports between the 1.9800 – 1.9860 region. Should the pair drops decisively below 1.9800, it becomes vulnerable enough to plunge towards 50% Fibo level of 1.9550.

CADCHF


Continuing on its slide since reversing form 0.7340, the CADCHF seems heading down to test the January lows around 0.6800 mark with 0.6890 being an intermediate support level. If the pair continues on its south-move below 0.6800, 61.8% FE of its November 2015 – January 2016 downside, near 0.6760, might provide a small support during the pair's decline towards aiming the 0.6600 area. On the upside, 0.6980, followed by the 23.6% Fibo, near 0.7030, and the 0.7070, are likely immediate resistances that the pair needs to tackle before it could rally to 38.2% Fibo level of 0.7160 and the 0.7210 mark. However, pair's further up-moves beyond 0.7210 are likely to be capped by the 50% Fibo level of 0.7270 and the 0.7300 round figure mark, which also encompasses the descending trend-line resistance.


“Original analysis is provided by Admiral Markets
 
EURUSD Extended V bottom on daily time frame


EURUSD has made the Extended V Bottom on daily chart. The characteristic of this pattern is that the price of the V bottom will form a reversal that is followed by a down-sloping trend line or channel usually in the form of a triangle or pennant.

Extended V bottom on the EURUSD chart has been very distinctively followed by a bullish pennant that broke to the upside making its target at 1.1376. My previous EURUSD analysis showed that 1.1085 was indeed a very strong support and the price has been rejecting 1.1130 last 3 days. That is because price sits at H5 – previous resistance, now support that holds the price from falling further. Should 1.1085/H5 break to the downside than we could see 1.0980 - the POC zone (L4, EMA89, Bullish pennant breakout) where next bounce is expected (breakout-retest on daily time frame) towards upper Extended V bottom target 1.1370.

Please note that this is daily chart so watch for daily candles, bounces off 1.1130/1.1085 and if 1.1085 breaks, downtrend towards 1.0980.


“Original analysis is provided by Admiral Markets
 
AUDUSD ascending channel provides buying opportunities


As we know AUDUSD is a hard commodity currency.Basically, when its risk-on environment, commodities prices tend to increase, and traders go long AUD due to that factor. When commodities prices go up, Stock Markets go up and there is demand for positive swaps on AUD pairs currently as opposed to JPY (JPY weakened today). AUD bounce has also been stimulated by the PBOC, Oil and RBA. Oil is connected to commodity currencies so it gave AUD additional boost.

Technically AUDUSD is showing a possible breakout and positional trading. The pair is slowly grinding up in an ascending channel towards important levels. If the price retraces to 0.7130-40 POC (50.0, WPP, EMA89) we might see another bounce towards 0.7212. The price is currently 0.7191 so we might even see a direct test of 0.7212 before any retracement.

If the price closes above the channel and makes a breakout above the channel and H4 confluence (0.7215), next level should be 0.7267. So pay attention to any retracement towards POC for long setups or a breakout as stated above.


“Original analysis is provided by Admiral Markets
 
Technical Outlook: EURUSD, GBPUSD, USDJPY And NZDUSD

EURUSD


While corrective moves from 1.1375 fetched the EURUSD down to re-test the early month lows, an upside break above 1.1045-50 area, encompassing the short-term "Falling-Wedge" resistance and the 50% Fibonacci Retracement of its January – February surge, would confirm the bullish technical formation and can propel the pair's rise to 38.2% Fibo, near 1.1130, in a quick move. Should the pair manages to sustain its advance beyond 1.1130, the 1.1200 and the 1.1230, including 23.6% Fibo level, are likely intermediate resistances before it could aim for 1.1300 and the previous highs around 1.1375. Alternatively, the pattern support-line and the 61.8% Fibo, around 1.0960, might continue acting as immediate strong support for the pair, breaking which the bullish formation gets negated which in-turn can fetch the prices to test seven weeks old ascending trend-line support, near 1.0900 round figure mark. If at all the pair fails to respect the trend-line support, it becomes weaker enough to dive towards 1.0800 and the 1.0770 prior to revisiting the January lows around 1.0700.

GBPUSD


Present south-run by the GBPUSD might find it difficult to break nearly six month old descending trend-line support, around 1.3820 now, which if broken can drag the pair prices down to 61.8% FE level of its October 2015 – January 2016 downside, near 1.3770. If the pair continue on its downside below 1.3770, the 1.3650 is likely a buffer support during its plunge to January 2009 lows around 1.3500 psychological mark. However, oversold RSI might trigger a pullback into the pair prices towards 1.4070 immediate resistance, clearing which 1.4220-30 and the 1.4400, are consecutive upside levels that pair traders might have to look at. Should the pair clears the 1.4400 on a closing basis, the 50-day SMA, currently around 1.4500 mark, becomes a strong resistance for the pair to break, surpassing which can propel its rise to 1.4670-80 area.

USDJPY


Although short-term descending trend-channel keep favoring USDJPY downside, support-line of the channel, at 111.30 now, quickly followed by the early month lows around 111.00, might give rise to the pair's short-covering moves towards 112.60-65 zone, including the channel resistance and the descending trend-line stretched from early February month. If the pair manages to clear the 112.65 on a closing basis, 23.6% Fibonacci Retracement of its current month slide, at 113.00, and the 113.80, are expected following resistances that it could witness before reaching the 115.00 mark. Should the pair closes above 115.00, it becomes capable enough to rise towards 50% Fibo, near 115.50, and then to the 61.8% Fibo, near 116.50. Meanwhile, pair's drop below 111.00 opens the door for its southward trajectory towards 61.8% FE of the mentioned move, around 109.20.

NZDUSD


On Wednesday, the NZDUSD carried forward the previous day's losses and marked a new low of the week; though, 23.6% Fibonacci Retracement of its April 2014 – September 2015 downside, also including the short-term ascending trend-channel support, near 0.6590-85, could confine the pair's immediate decline. If the pair closes below 0.6585, it can swiftly drop to 0.6500 mark before resting around the 0.6430-20 horizontal-line. Given the pair's successive break of 0.6420, chances of its downside to 0.6300 and the September 2015 lows of 0.6236, can't be denied. On the upside, pair's pullback from the current levels may witness 0.6740 as nearby resistance, clearing which 38.2% Fibo, near 0.6815, could offer an intermediate halt to the prices before propelling the pair to witness 0.6890 – 0.6900 important resistance-confluence, encompassing channel resistance and the horizontal-line. Given the pair's ability to surpass 0.6900 mark, it can quickly rise to 0.7015-20 and the 0.7100 area.


“Original analysis is provided by Admiral Markets
 
Back
Top