This indicator same as Support resistance. This is powerful indicator. I use this trading strategy and thanks to share this indicator. Sorry for my bad englishThis is the support thread for the Powerful Buyers & Sellers Zones Indicator. We welcome any of your feedback, questions and improvement ideas here!
You are using an out of date browser. It may not display this or other websites correctly.
You should upgrade or use an alternative browser.
You should upgrade or use an alternative browser.
Powerful Buyers & Sellers Zones Indicator - support thread
- Thread starter FXTradingRevolution
- Start date
FXTradingRevolution
FxTradingRevolution.com Representative
- Messages
- 64
Thank you for this indicator. Appreciate all the help! I'll team it up with my other powerful indicators for more spot on entries.
You are welcome Leticia, I trust that the indicator will help!
")
Ryan
FXTradingRevolution
FxTradingRevolution.com Representative
- Messages
- 64
Anything for folks just trading Oanda FxTradeNow Mobile without MT4 and using graph platform TradingView(which can input all sorts of indicators)? I'm asking because I run everything off of Chromebook with chromium browser, which is very light client that does not take downloads beyond PDF, GIF, etc. What you've made sounds very interesting as a model for FPA to test, for sure. Thanks.--feaisland55
The indicator currently works only in the MT4 trading platform. However, I would like to prepare and publish more indicators here as well as upgrade the existing one. Now I am not sure how the whole TradingView platform works and whether it is possible to upload external indicators, but if there will be considerable interest, I will take a look for sure.
Ryan
FXTradingRevolution
FxTradingRevolution.com Representative
- Messages
- 64
Hi users
use that said (SR.single,double,tripple) with "Sentiment zone oscillator - averages 2"
indicator shown in lowest SW.
regardsView attachment 25552
Good idea mntiwana! Let me know the results after some time.
Ryan
FXTradingRevolution
FxTradingRevolution.com Representative
- Messages
- 64
This indicator same as Support resistance. This is powerful indicator. I use this trading strategy and thanks to share this indicator. Sorry for my bad english
You are welcome! As I wrote previously - the indicator does not work based on the support / resistance principle. Sometimes the indicator shows the buyers / sellers zones that are similar to the S/R zones, but it is not always the same.
Ryan
Bernhard33
Private, 1st Class
- Messages
- 42
Hello, thanks for your message. It does not work based on the support / resistance principle. Sometimes the indicator shows the buyers / sellers zones that are similar to the S/R zones, but it is not always the same. The reason why there are currently no buyers zones on EUR/USD is that there is a strong downside move on EUR/USD making new lows. The indicator works based on statistics and probability, so the indicator will wait until the market moves will be stabilized and draw the buyers zones then. Also, you are able to change the sensibility of the zones by changing the "Buyers & Sellers factor" in the indicator's settings. Anyway, I will be more than happy to collect all feedback and improve next versions of the indicator.
Ryan
Alright then you may have included some new ideas. To use any indicator (I'm not newbie) should understand how it works, so please give some more precise descriptions.
Second I would like to know how must look an iCustom call from an EA to import the last S1/R1 (You can send PM if this is to complicated for the post) thanks.
regards Bernhard
FXTradingRevolution
FxTradingRevolution.com Representative
- Messages
- 64
Application examples would be helpful, as well as explanation for Zone sizes, length and hight and position, why is what where and when and what to do with it?? In differnt timeframes the Zones look very different, how to read that??
The indicator shows price zones of weak / medium / strong buyers or sellers based on current time-frame. If you choose for example H1 time-frame - then the indicator will show price zones corresponding to the H1 market moves and volatility. If you choose M5 time-frame, the indicator will show price zones corresponding to the M5 volatility.
Sizes, length and height of the zones is counted based on the market volatility of the given time-frame. Also there is a pretty specific algorithm that tries to detect market moves and statistics / probability of price zones where buyers and sellers might appear.
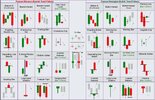
The indicator was not intended as a holy grail indicator / strategy. The usage should depend on every trader - some traders can use the zones to place Profit-Targets (below sellers zones and above buyers zones) or Stop-Losses (above sellers zones and below buyers zones). If you would like to use the indicator for market entries - basically, I wait until the market hits one of the zones and some candlestick pattern appears.
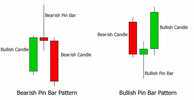
Below are the examples of candlestick patterns that should help you.
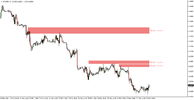
Currently, I watch the indicator with "Buyers & Sellers factor" set to 50 on EUR/USD. Below you can see how the market bounced accurately from the sellers zones. In the chart below you will also spot nice Outside Bar, Pin Bars and other candles that were bouncing from the zones.
Ryan
Attachments
FXTradingRevolution
FxTradingRevolution.com Representative
- Messages
- 64
Alright then you may have included some new ideas. To use any indicator (I'm not newbie) should understand how it works, so please give some more precise descriptions.
Second I would like to know how must look an iCustom call from an EA to import the last S1/R1 (You can send PM if this is to complicated for the post) thanks.
regards Bernhard
Basically, the indicator works with current market volatility on chosen time-frame. As I wrote - there is a pretty specific algorithm that tries to detect market moves and statistics / probability of price zones where buyers and sellers might appear. If there is a strong downtrend (like in the chart I posted in the previous post), the indicator usually doesn't draw any buyers zones as there is a low probability that there will be any nice bounce / market reverse (in case of strong uptrend there are usually no sellers zones). Usually the zones will appear near important swings, but not near all the market swings - there is a filter that tries to choose the most important ones. Basically, the higher the number is set in the Buyers & Sellers factor, the stronger and more long-term zones will be displayed.
I forwarded the iCustom question the a programmer and let you know as soon as I will get a reply.
Have a great day!
Ryan
Bernhard33
Private, 1st Class
- Messages
- 42
I forwarded the iCustom question the a programmer and let you know as soon as I will get a reply.
Have a great day!
Ryan
Excellent, thank you!
Similar threads
New Forex Stuff
Stable and profitable EA based on GPT4 development
- Replies
- 1
- Views
- 28
- Replies
- 0
- Views
- 210