FXCM/DailyFX Signals and Analysis

WTI Crude Oil Price Forecast: Bearish Price Channel Favors Downside Bias

As US Dollar Has Support, Watch Polarity Level on USOil At ~$45-46/bbl

WTI-Crude-Oil-Price-Forecast-Bearish-Price-Channel-Favors-Downside-Bias_body_Picture_5.png.full.png


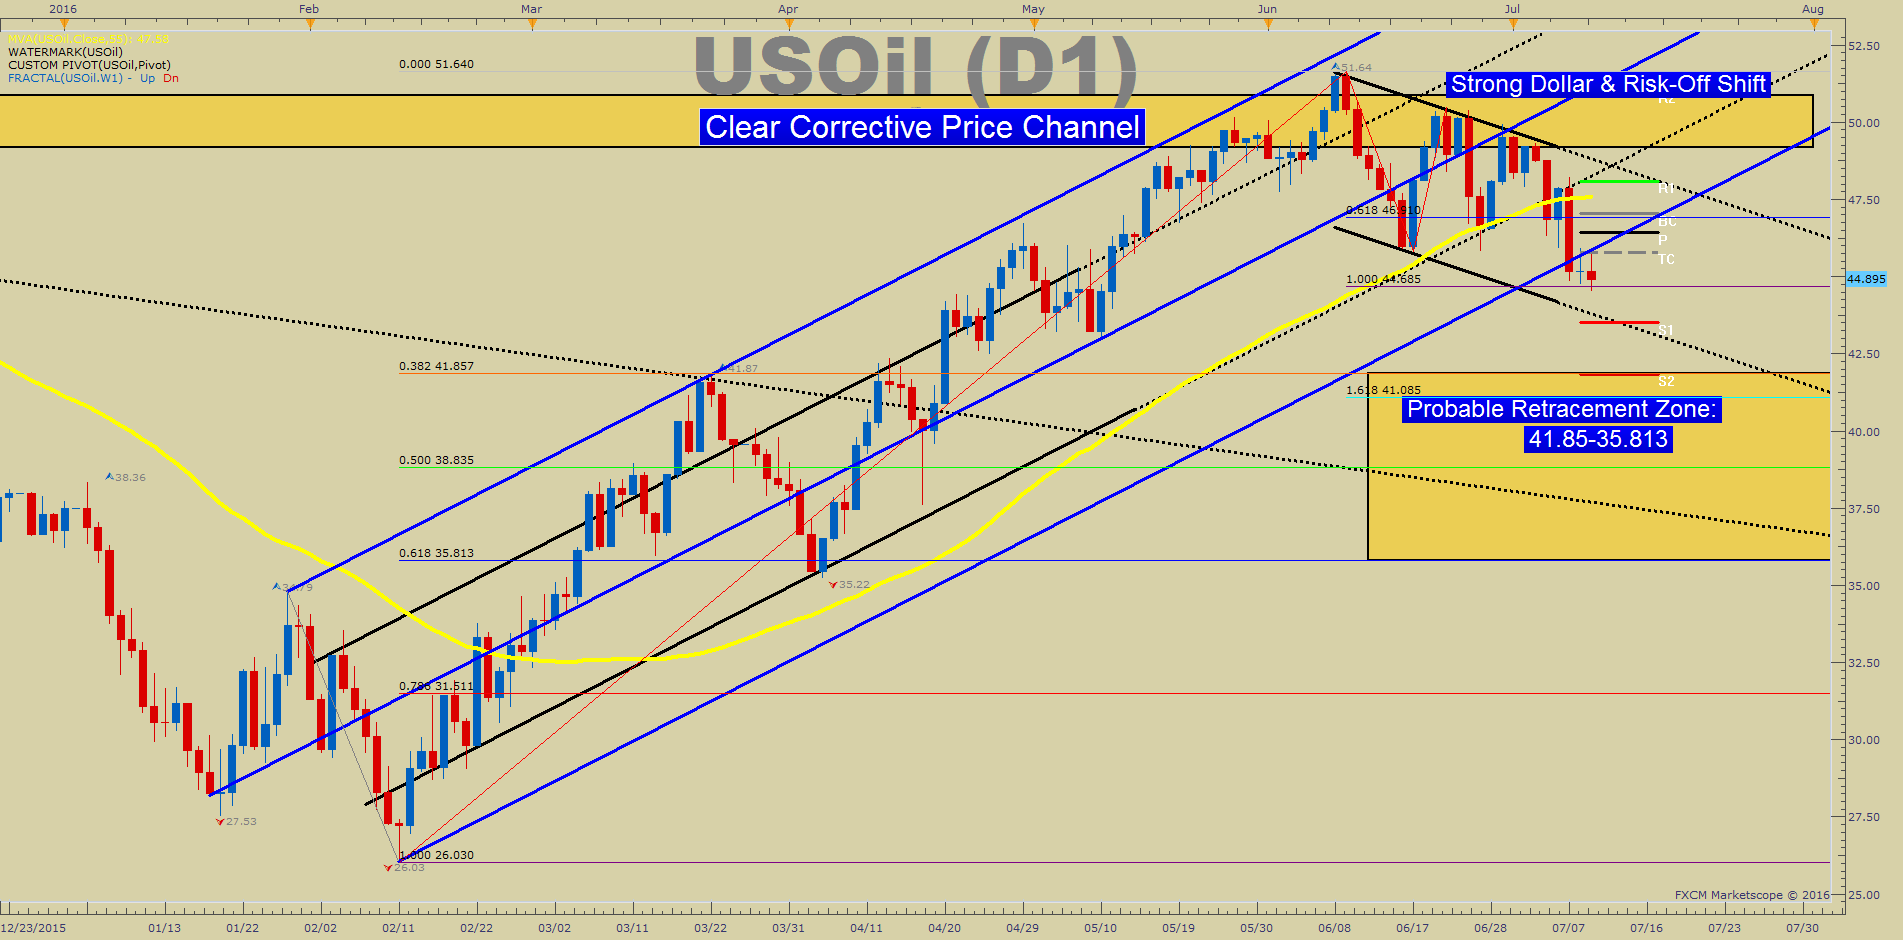
For complete technical analysis, see Tyler Yell's article on DailyFX.com
 
GBP/USD: Post Brexit Rebound at Risk Into Bank of England Meeting

Today on DailyFX.com, currency strategist Michael Boutros explains why, heading into the Bank of England interest rate decision tomorrow, the risk remains for a set-back before moving higher with a general constructive outlook in play while within this formation.

GBPUSD-Post-Brexit-Rebound-at-Risk-Into-Bank-of-England-Meeting_body_Picture_3.png.full.png
 
GBP/JPY at Brexit Levels- Elevated Risk for Declines on UK Employment


GBP/JPY has continued to straddle the Brexit close with the pair at risk for losses ahead of UK jobs data.


Daily Chart
Forex-GBPJPY-at-Brexit-Levels--Elevated-Risk-for-Declines-on-UK-Employment_body_GBPJPYDaily7-19-2016.png.full.png


Michael Boutros points out the updated targets and invalidation levels that matter in his article on DailyFX.com
 
Retail FX Traders Point to Significant Changes for Yen

Retail forex traders are now net-short the US Dollar versus the Japanese Yen for the first time since the pair traded near 120¥ through late 2015.

ssi_usd-jpy_body_Picture_4.png

The substantive shift warns the pair may be at a significant crossroads which David Rodriguez discusses today in his article on DailyFX.com
 
BoJ Rate Decision - High Volatility Risk


We have the Bank of Japan rate decision coming up this evening and anticipated Yen volatility measures are running extremely high. In fact, the overnight implied volatility on USD/JPY is at levels not seen since the Great Financial Crisis. Below is a chart to give some comparison to the anticipation that was building up in the GBP/USD overnight implied volatility reading heading into Brexit.


QK7EgST.png


John Kicklighter explains why this event is so important in his article on DailyFX.com
 
New Indicator of Trader Sentiment


FXCM has created a new Speculative Sentiment Index indicator for Trading Station. It graphs the data in real time, so you can see both current and historical trading sentiment on your charts.

One of my favorite features of the new SSI indicator is that you can view sentiment data either as an index value or a percentage. For example, you see below the Speculative Sentiment Index value for USD/JPY is 3.23 which means there are 3.23 long positions for every short position. That equates to 76.38% of traders being long.


YK5HFS8.png


SSI is a contrarian signal to price action, so the fact that more traders are buying USD/JPY is a bearish signal for the pair. Notice in the chart above how the price action in USD/JPY tends to move in the opposite direction to the SSI percentage. When traders increase their buying, the price tends to fall and vice versa. This makes trader sentiment an interesting complement to the signals you can get from technical analysis and fundamental analysis.

Past performance is not necessarily indicative of future results.
 
US Dollar Once Again Looks like it might Break Down

Retail forex traders remain aggressively long the US Dollar versus major counterparts.

ssi_table_story_body_Picture_7.png


Are further losses all but guaranteed? Read David Rodriguez's analysis in his Weekly Speculative Sentiment Index report.
 

Attachments

  • upload_2016-9-8_12-14-11.png
    upload_2016-9-8_12-14-11.png
    893 bytes · Views: 1
EUR/USD short positions up 15.6% since yesterday

CsbHQupWAAEunN7.jpg:large

The Speculative Sentiment Index (SSI) is a contrarian indicator and the fact traders are selling EUR/USD is a bullish signal for the pair. Note in the image above how the price action of the EUR/USD candles tends to mirror the histogram of short positioning in the pair.
 
Back
Top