Daily Technical Analysis by FxGrow

FxGrow Fundamental Analysis – 23rd March, 2017
By FxGrow Investment Research Desk

Gold Seeks Further Gains Over Crisp U.S Dollar, Eyes on Yellen
Gold_zps1gv9w8bu.png


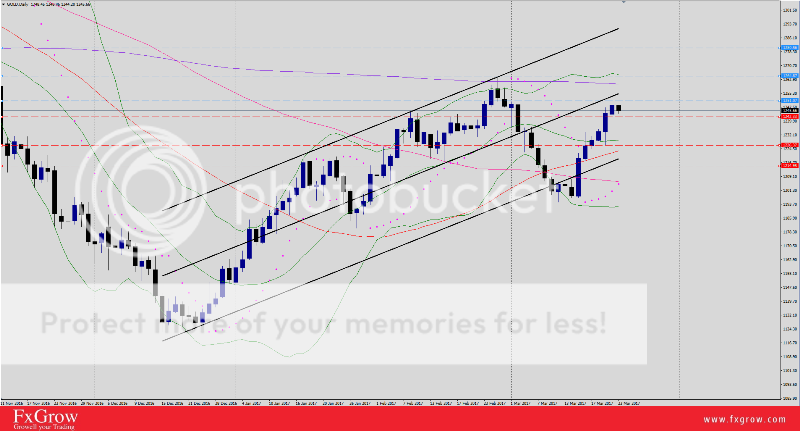
Gold has prolonged bullish trading session with a 1251.34 high yesterday and currently, XAUUSD is confined 47-pips range price action, slightly above 50-SMA (H1). Overall, gold added +$53.89 since March Fed hike. USD collapsed dramatically on Tuesday and extended losses yesterday at 99.32 low, digging deeper for 2017-new-lows at 99.19, which supported gold bullish momentum.

History and logic suggest that when the United States starts a monetary tightening cycle, gold will under-perform, since as a non-yielding asset it loses out to instruments that will enjoy higher yields from the rising rates.

According to the World Gold Council (WGC), China's gold demand has dropped this year, with third quarter consumer demand at 182.5 tons, down 22% from the same period in 2015, while India's 194.8 tons is 28% lower. Analysts are expecting China's and India's gold demand to remain steady in 2017.. China and India are the world's biggest gold-consuming nations.

Today, U.S economic data is heavy first with Unemployment claims which in case positive, should re-balance U.S index levels with upward correction, but the main focus is on Yellen speech and traders will try to decipher words and signals out of her speech.

Fundamentals:

1- USD unemployment rate today at 12:30 PM GMT.

2- USD Yellen speech today at 12:45 PM GMT.

Technical :

Trend : Bullish Sideways

Daily Pp 1247

Resistance levels : R1 1252.20, R2 1264.87, R3 1280.76

Support levels : S1 1242.33, S2 1230.62, S3 1218.83

Remark : Overall gold is bullish but U.S data today is vital especially Yellen speech in relation with low USD levels. Stalling above R1 level is a Déjà vu of last 2 weeks rallies with R2 level as target. Closing above R2 projects further bullish attacks at R3 level. A stall around 1251 could prompt setbacks, but trade should hold within Tuesday's range to maintain strong bull forces. Closing below S2 alerts for trend reversal and market to consider gold bearish. U.S index is the main player.

For more in depth Research & Analysis please visit FxGrow.http://fxgrow.com/analysis-educatio...cal-analysis-fxgrow-free-forex-analysis-tools

Note: This analysis is intended to provide general information and does not constitute the provision of INVESTMENT ADVICE. Investors should, before acting on this information, consider the appropriateness of this information having regard to their personal objectives, financial situation or needs. We recommend investors obtain investment advice specific to their situation before making any financial investment decision.
 
FxGrow Fundamental Analysis – 23rd March, 2017
By FxGrow Investment Research Desk

Wallowing U.S Index and Supper Yellen with Possible Scenarios
Yellen_zpsmcxbjqo6.jpg


Since FOMC epic decision with 0.25% hike to initial 0.75%, U.S Index has collapsed dramatically. After peeking to $102.26 Feb-highs, the Index has shed -$2.94 and anchored yesterday at $99.32, closing to 2017 lowest at $99.19. Below are the factors contributing to bearish U.S Index Foreces.

1- Markers had already priced in and traded on the fact that Fed hike was inevitable. So basically, the FOMC decision had zero contribution to the market "Buy the rumor sell the fact " fitted like the last peace of puzzle and the USD decline picture was drawn.

2- Traders were awaiting further instructions by Yellen and Co. about coming Fed hikes, but details were not listed.

3- Doubts about Trump's capacity to provide the right leadership for Republican party have been creeping into the market fueled by allegations about links of his election campaign with relation to Russian contributes and recent Trump's real estate bought by Russians as Greg Gibbs, Director at Amplifying Global FX Capital pointed yesterday. Also Trump's bombastic style including wild claims about wire taps for the white house when he addressed journalists in previous appearances.

Fact : Combine these above elements, no wonder why U.S Index has tumbled and in case of further declines, it's logic.

Now after we have briefed the above, the real question is, How will Yellen play along today when she appears preceded by U.S Unemployment Claims. If Yellen came out with promises about coming hikes, markets will start pricing in and trading on her words and the whole cycle ( U.S Index ) will be repeated again as Déjà vu. Recent speeches of FOMC's members Dudley and Evans with their declrelations supports the coming scenario further more. So, Yellen will try to avoid this scenario and turn into different aspect in which she will focus on how strong the U.S economy is supported by positive unemployment data, inflation rate, recent CPI, NFP, and retails sales which should boost U.S Index to a 100.46 where trend will make a reverse and turn bullish.

Remark: Previous unemployment claims were 240K and forecasts for today are 241, narrowing down the gaps between the number, skepticism or confusion about comparison between recent, initial, and forecasts will be tight. Traders always tend to read the data in different way when recent is more than forecasts but less then previous, along with it, bearish and bullish volatility.

For more in depth Research & Analysis please visit FxGrow.http://fxgrow.com/analysis-education/fxgrow-academia/fxgrow-blog

Note: This analysis is intended to provide general information and does not constitute the provision of INVESTMENT ADVICE. Investors should, before acting on this information, consider the appropriateness of this information having regard to their personal objectives, financial situation or needs. We recommend investors obtain investment advice specific to their situation before making any financial investment decision.
 
FxGrow Fundamental Analysis – 24th March, 2017
By FxGrow Investment Research Desk

EUR/USD Guarding Tuesday's Gains Ahead of Local Data
EURUSD_zps6mzaqi82.png


EUR/USD inaugurated Friday's trading sessions with aggressive selling and lost -26-pips after clocking a high 1.0786. The pair peeked to 1.0819 on Monday and prolonged additional 5-pips on Tuesday over arousing political optimism driven by Netherlands recent elections and French polls claiming Macron ahead of Le Pen ( Anti EU). However, the political optimism was jinxed by stingy reviving U.S Index today with a 99.79 high today.

Yesterday, U.S unemployment claims were negative with 258K compared to 241K on previous sessions but markets were focused on Yellen speech, and as always, Yellen will always be Yellen with her vague hints. Markets were expecting a support for U.S Index justified by Yellen timing and collapsing U.S Index, but the lady didn't even comment on monetary policy. Eyes today are shifted towards Trump health care program which should boost U.S Dollar up or down, depending on the final outcome.

Today, EU economic pocket is heavy from French and Germany, services and manufacturing PMI, which will give an estimate on how the EU economy is heading and it's health.

Fundamentals :

1- EUR - French Flash Manufacturing and services PMI today at 8:00 AM GMT.

2- -EUR - German Flash Manufacturing and services PMI today at 8:30 AM GMT.

3- EUR - EU Flash Manufacturing and services PMI today at 9:00 AM GMT.

4- USD - Core Durable Goods Orders today at 12:30 PM GMT.

Technical :

Trend : Bullish Sideways

Resistance levels : R1 1.0790, R2 1.0822, R3 1.0843, R4 1.0866

Support levels : S1 1.0744, S2 1.0705, S3 1.0662, S4 1.0635

Remark :Currently the pair is still considered bullish due to weaker U.S Dollar with sideways options due to the ebb and flow between EUR and USD. The above variety of economic news will decide how cable trend will settle in the coming hours. Keep an eyes on U.S index with coloration of U.S data and Trump health care voting today.

For more in depth Research & Analysis please visit FxGrow.http://fxgrow.com/analysis-education/fxgrow-academia/fxgrow-blog

Note: This analysis is intended to provide general information and does not constitute the provision of INVESTMENT ADVICE. Investors should, before acting on this information, consider the appropriateness of this information having regard to their personal objectives, financial situation or needs. We recommend investors obtain investment advice specific to their situation before making any financial investment decision.
 
FxGrow Fundamental Analysis – 24th March, 2017
By FxGrow Investment Research Desk

USD/CAD Remains Bullish Despite Bearish U.S Dollar
USDCAD_zpsqgwnsqxj.png


Although U.S Dollar is toothless for the past 12 consecutive sessions with 99.32 weekly-fresh-lows, USD/CAD remained bullish today and confined with 31-pips price action. Unlike USD rivals, the Loonie failed to take advantage of weaker U.S Dollar, tailed by collapsing crude oil levels for the past 2 weeks. The pair clocked 1.3377 high and currently shifting sail course and reversing daily bullish candle to inverse hammer candle supported by rising crude oil levels. The pair is currently trading 1.3354, slightly above its daily Pp 1.3341.

Loonie economic data is colorful today, but the main focus will be on Consumer Price Index ( CPI ), taking into consideration that inflation currently has reached 2.13%. Today's data could be an indicator for the coming BOC meeting for interest rates.

Fundamentals:

1- CAD - CPI today at 12:30 PM GMT.

2- CAD - CPI common, CPI median, and CPI trimmed y/y today at 12:30 PM GMT.

3- USD - Core Durable goods today at 12:30 PM GMT.

Technical :

Trend : Bullish sideways

Resistance levels : R1 1.3408, R2 1.3463, R3 1.3535

Support levels : S1 1.3315, S2 1.3247, S3 1.3174

Remark : Keep an eyes on U.S Index levels as its a measurement for USD/CAD performance. Also, Canadian today is vital on the short and long run.


For more in depth Research & Analysis please visit FxGrow.http://fxgrow.com/analysis-educatio...cal-analysis-fxgrow-free-forex-analysis-tools

Note: This analysis is intended to provide general information and does not constitute the provision of INVESTMENT ADVICE. Investors should, before acting on this information, consider the appropriateness of this information having regard to their personal objectives, financial situation or needs. We recommend investors obtain investment advice specific to their situation before making any financial investment decision.
 
FxGrow Fundamental Analysis – 27th March, 2017
By FxGrow Investment Research Desk

EUR/USD Gaps Upward and U.S Index Downward, Eyes on German Ifo
EURUSD_zpsssj6jveg.png


EUR/USD inaugurated Monday trading session with a +23-pips upward and added additional gains +23-pips with 1.0849 high supported by Friday's positive Data and overwhelming political optimism . On the other hand, U.S index prolonged the bearish momentum for the second week in a row, and today the Index gaped downward with -$.042, and bottomed at 99.06 11-Nov-2016 fresh lows.

On Friday, markets were awaiting for the white smoke coming from of Trump's oval office with a positive vote to replace Obamacare health program, but unfortunately, a darker smoke was instead which added more negative weight and pressured U.S Dollar facing its classic rival EURO. Currently the pair is trading 1.0849, with one pip difference to re-reach today's high indicating additional bullish waves for the cable as a reminder of 2016 glorious levels for EUR/USD. In addition to that, Firday's heathcare decision consecqunces are still to impact USD.

Analysts at ANZ explained that the failure of Donald Trump’s replacement healthcare bill to make it through congress will be viewed by the market as a major setback for the ‘Trump trade’ (although market moves late on Friday were a little surprising).

Fundamentals :

1- EUR- German Ifo Business climate today at 9:00 AM GMT.

2- EUR- M3 Money Supply y/y today at 9:00 AM GMT.

3- EUR - Private Loans y/y today at 9:00 GMT.

4- USD - FOMC member Evans speech at 6:15 AM GMT.

Technical :

Trend : Bullish

Resistance levels : R1 1.0873, R2 1.0908, R3 1.0949.

Support levels : S1 1.0819, S2 1.0759, S3 1.0673

Remark : Taking the current situation of collapsing, the market posture is bullish and signals for a larger emerging upswing, hinting for a trending drive towards R2 level. Stable action over 1.800+ will encourage follow through rallies. A full retraction of Tuesday's range is needed to flip trade to a correction page, but only a close below S3 level is needed for trend reversal and the market to consider the cable bearish. EU data not be missed today, in addition to that, FOMC member Evans speech today where markets should look for hawkish tilts which might lift or save U.S Index from further declines.

For more in depth Research & Analysis please visit FxGrow.http://fxgrow.com/analysis-educatio...cal-analysis-fxgrow-free-forex-analysis-tools

Note: This analysis is intended to provide general information and does not constitute the provision of INVESTMENT ADVICE. Investors should, before acting on this information, consider the appropriateness of this information having regard to their personal objectives, financial situation or needs. We recommend investors obtain investment advice specific to their situation before making any financial investment decision.
 
FxGrow Fundamental Analysis – 27th March, 2017
By FxGrow Investment Research Desk

Japanese Yen Holds a Ruthless Grip Over Softer US Dollar
USDJPY_zps16xyv07j.png


Japanese Yen launched Asian trading sessions with a sharp strong tone facing pale greenback supported by positive summary by BOJ and Services Producer Price Index SPPI 0.8% compared to 0.5% on previous sessions. The pair penetrated the taboo support level (110.60) aggressively with 110.25 22-Nov-2016-fresh lows, from which bull forces rallied at 103.71 7-Nov-2016 low. Overall, USD/JPY has shed -79-pips as price action, trading below 200 SMA (111.17 D1), and it is expected to drift downward further more given the current circumstances.

BOJ Summary was as follows :

1- Japan's economy has continued its moderate recovery trend and Private consumption has been resilient against the background of steady improvement in the employment and .

2- Exports and production have remained firm on the back of a global pick-up in manufacturing, mainly supported by IT-related goods.

3- Japan's economy is likely to continue to recover in line with the path we expect, backed by synergy effects of the government's large-scale stimulus package and the Bank's monetary easing measures, with improvements in overseas economies.

4- Japan's economy is projected to continue to see moderate recovery toward fiscal 2018 unless downside risks stemming from developments in overseas economies materialize, such as a rise of protectionism, political and economic instability in Europe, and an increase in geopolitical risks in the Middle East and Asia.

On the other hand, US Dollar was bearish for the second consecutive week with a clear signal for additional bearish forces as the Index gaped downward -$0.42 and dug deeper at 99.06, 2017-new-lows. Trump's health care voted with an annulment on Friday showed Republicans weak trying to replace ex-Democratic Obamacare health program, which added additional question mark around Trump's capacity to lead the free world nation (USA), and consequences are expected to dilate further more as U.S Wallstreet opens.

Fundamentals :

1- USD - FOMC Member Evans speech today at 6:15 PM GMT.

2- USD - CB Consumer Confidence tomorrow at 3:00 PM GMT.

3- USD FOMC Member Kaplan speech tomorrow at 6:00 PM GMT.

Technical:

Trend : Bearish

Resistance levels : R1 111.33, R2 112.38, R3 113.33

Support levels : S1 110.25, S2 109.33, S3 108.20

Trend : Bearish Sideways

Remark : Current situation of low U.S Index and positive Japanese Data signals for further dips for USD/JPY. Negative decision on Trump's healthcare program will still tail for the coming trading hours and market should expect further declines for US Dollar.Also, FOMC members appearance this week is heavy, traders should watch for hawkish hints regarding coming U.S Fed hikes with efforts to rescue U.S Index.

A penetration for S1 will increase further selloffs and wash towards S2 level. A close below S2 level projects additional bear forces for the cable but be careful from setback as a test on support levels. Keep in mind that below S3 level is a threat for USD/JPY Nov-2016 rallies. A close above R2 level is an alert for trend reversal and above R3, bullish trend will re-confirmed once again.

For more in depth Research & Analysis please visit FxGrow.http://fxgrow.com/analysis-educatio...cal-analysis-fxgrow-free-forex-analysis-tools

Note: This analysis is intended to provide general information and does not constitute the provision of INVESTMENT ADVICE. Investors should, before acting on this information, consider the appropriateness of this information having regard to their personal objectives, financial situation or needs. We recommend investors obtain investment advice specific to their situation before making any financial investment decision.
 
FxGrow Fundamental Analysis – 28th March, 2017
By FxGrow Investment Research Desk

GBP/USD Clocks Two Months High Ahead of Article 50 Release
GBPUSD_zpsyyeao5em.png


Sterling was the talk of the market yesterday with a 1.2615 high and extended the bearish momentum for the 10th consecutive sessions. Although the pair lost -47-pips as price action since yesterday, the pair successfully sustained the 1.25 handle and currently trading 1.2568 intraday. Overall, GBP/USD rallied 471-pis since the U.S Fed hike, till yesterday high, and the pair is preparing for additional bullish waves due to soaring U.S Index yesterday with 98.65 2017-fresh-lows.

On the other hand, UK demands a final departure politically and financially from the EU. Political is by PM May releasing article 50 on the 29th of March which will set a new course for UK, but before that, PM May met with Scottish PM Nicola Sturgeon. Sturgeon has called for a second Scotland independence referendum, against May's will, but the terror attack from last week has interrupted the tense relations between them both. After officially lunching the Brexit, the UK will have two years to negotiate new arrangements, after which it will no longer be subject to EU treaties.

On the Financial level, The EU has to make up a budget gap once the Brexit becomes official. Britain's exit from the European Union indicates that one of the bloc's biggest economies will stop making donations to its budget. This arouses questions as to how long the U.K. will proceed to pay its share of the budget and how can the EU fill the blacnk once Britain has officially left. The U.K. has already said it will not pay a 60 billion euro ($64.73 billion) bill to departure the bloc – money that according to the EU would be used for the U.K.'s share of commitments to the pensions of its workers and U.K.-based projects that have already received funding approval. At the same time, some member states have already told Brussels that the UK are not willing to pay more into the EU budget to compensate for the U.K.'s divorce. (CNBC)

Fundamentals:

1- USD - Goods Trade Balance today at 1:30 PM GMT.

2- USD- CB Consumer Confidence today at 3:00 PM GMT.

Technical :

Trend : Bullish Sideways

Resistance levels: R1 1.2598, R2 1.2640, R3 1.2682

Support levels : S1 1.2531, S2 1.2462, S3 1.2392

Remark : Given the current situation of pale greenback trading 98.96, and GBP/USD significant rallies Sterling has the upper hand which supports the pair's bullish forces. Closing above R1 restores confidence for Sterling and the pair has the tendency to climb to R2 level. On the other hand, stalling below S1 will increase further selloffs and wash towards S2 level signaling a beginning for trend reversal. Closing below S2 is a confirmation that bearish forces has taken control and market to consider GBP/USD bearish with a reminder that the pair collapses intensively on psychological level. Political issues such as article 50 and Scottish referendum are vital for Sterling levels on the fundamental level.


For more in depth Research & Analysis please visit FxGrow.http://fxgrow.com/analysis-educatio...cal-analysis-fxgrow-free-forex-analysis-tools

Note: This analysis is intended to provide general information and does not constitute the provision of INVESTMENT ADVICE. Investors should, before acting on this information, consider the appropriateness of this information having regard to their personal objectives, financial situation or needs. We recommend investors obtain investment advice specific to their situation before making any financial investment decision.
 
FxGrow Fundamental Analysis – 29th March, 2017
By FxGrow Investment Research Desk

GBP/USD Digests Monday's Gains Ahead of Article 50 Release
brexit_zpsyfv26vli.jpg


Sterling lost the sharp tone yesterday and went to a softer one today as UK gears up for the historic release for Article 50. GBP/USD bled -239-pips since Monday and plunged to 1.2376 low today over fears of consequences of what might outcome as PM releases the article. Traders has abandoned buying positions of GBP/USD high levels and left the pair to cast at lower levels with aggressive selling. On the other hand, U.S Index is showing a minor recovery today, with +$0.71 increase following positive U.S Consumer Confidence release yesterday with a positive 125.5 compared to 116.1 on previous sessions.

PM May has already signed the Article 50 letter, which will be delivered by Tim Barrow today at 11:30 GMT. Thereafter, the European Council (EC) President Donald Tusk will hold a press conference at 13:45 GMT on the UK Article 50 notification. The UK PM May finally invoking the Article 50 means the process of the Britain to exit EU’s membership commences, after the referendum vote held in June last year showed Brits favoring a Brexit by 51.9% to 48.1%.

Once the Article 50 is triggered later today, the terms of Britain's exit will have to be agreed by 27 national parliaments, a process which could take some years. Some EU leaders believe, it could take as long as 5 years to agree to new trading and immigration policies with the remaining countries In the meantime, the UK will continue to abide by EU treaties and laws.”

Once the Article 50 is released, the terms of Britain's exit will have to be approved by 27 national parliaments, a process which could take some years. Some EU leaders believe, it could take as long as 5 years to agree to new trading and immigration policies with the remaining countries In the meantime, the UK will continue to abide by EU treaties and laws.”

Timeline post-Article 50 trigger (via the Sun)

MARCH 31: Donald Tusk will give the EU’s remaining 27 member states’ initial response to Mrs May.

APRIL 29: Emergency summit of the 27 EU leaders to agree on the mandate for their lead negotiator Michel Barnier to conduct exit talks.

MAY 7: French presidential elections final run-off. Many believe serious talks cannot begin until we know who the next French president is.

MID MAY: Michel Barnier draws up EU’s negotiating guidelines based on the mandate given to him. The EU’s council of foreign ministers meets to sign them off.

LATE MAY/EARLY JUNE: Face-to-face Brexit negotiations between Britain and the EU begin.

SEPT 24: German elections, to decide if Angela Merkel continues as Chancellor or is ousted. Difficult for much to be agreed on Brexit until then.

OCTOBER 2018: Both sides want to conclude negotiations six months before Britain leaves the EU to give the Houses of Commons and Lords, as well as the European Parliament and other national assemblies, time to ratify the final Brexit deal.

We could see a ‘soft’ Brexit landing if the UK agrees to compromise on issues like the free movement of people in order to maintain access to the EU single market. Contrarily, a ‘hard’ Brexit would be inevitable, in case the UK fails to reach a deal for the single market access with the EU.

Remark: Due to uncertainties evolving currently around UK with correlation of Article 50, and U.S Index sudden recovery, market to expect high volatility for GBP/USD. A break above 1.2464 projects additional bullish waves towards Monday's range at 1.2535 & 1.2605. The opposite scenario, A penetration for 1.2337 will increase further selloffs and wash towards 1.2241 & 1.2112 intensively. UK economic data today could be ignored due to Article 50 topic being the main frame for Sterling.

For more in depth Research & Analysis please visit FxGrow.http://fxgrow.com/analysis-educatio...cal-analysis-fxgrow-free-forex-analysis-tools

Note: This analysis is intended to provide general information and does not constitute the provision of INVESTMENT ADVICE. Investors should, before acting on this information, consider the appropriateness of this information having regard to their personal objectives, financial situation or needs. We recommend investors obtain investment advice specific to their situation before making any financial investment decision.
 
FxGrow Fundamental Analysis – 29th March, 2017
By FxGrow Investment Research Desk

Oil Bullish Forces In Action Over OPEC Deal Extension, Eyes on U.S Inventories
crude_zpsmay0ffbg.jpg


The long waited deal between OPEC and Non-OPEC counties has finally saw the light as we mentioned in the last article we posted. Yesterday, oil levels surged +$0.94, with a high 48.73, highest levels for this week and today, crude extended bullish candles with 48.57 with expectations to surpass Wednesday's highs. Crude levels were confined with $1.65 price action with six consolidation consecutive sessions indicating low volatility as markets were anticipating hints from either U.S increased shale drilling or from OPEC striking a newer deal, other than Vienna.

API data showed U.S. crude supplies up 1.9 million barrels. The American Petroleum Institute late Tuesday reported a rise of 1.9 million barrels in U.S. crude supplies for the week ended March 24, according to sources. The API data also showed a decline of 1.1 million barrels in gasoline supplies and a fall of 2.0 million barrels in distillates, sources said. Supply data from the Energy Information Administration will be released Wednesday morning. Analysts polled by S&P Global Platts forecast an increase of 300,000 barrels in crude inventories.

Between the U.S and OPEC, another fundamental catalyst logged the field, (Libya) an armed protesters blocked Sharara and Wafa oil western fields, reducing output by 252,000 barrels per day (bpd), a source at the National Oil Corporation (NOC) told Reuters late on Tuesday.

MOSCOW (Reuters) - Russia and Iran have pledged to continue efforts to rein in oil production and stabilize markets, the presidents of both countries said in a joint statement on Tuesday. "Russia and Iran will continue cooperation in this sphere (in oil output cuts) in order to stabilize the global energy market and ensure stable economic growth," the statement from Russian President Vladimir Putin and Iranian counterpart Hassan Rouhani said.

According to Bank of America Merrill Lynch, U.S. oil production growth between September and December was almost entirely the result of offshore wells, which increased production by 220,000 barrels a day in that period. Offshore projects are much more long-term investments. They are far more costly to develop and take years to get started. "Those projects have an inertia," said John Kilduff of Again Capital. Total U.S. oil production peaked at 9.6 million barrels a day in 2015 and fell to 8.56 million by September, according to Energy Information Administration data. Since then, U.S. production has jumped back, reaching 9.1 million barrels a day this month, according to the latest EIA weekly data. (CNBC).

The Organization of the Petroleum Exporting Countries (OPEC), along with some other producers including Russia, have agreed to cut production by almost 1.8 million bpd during the first half of the year in order to rein in a global fuel supply overhang and prop up prices. But as markets remain bloated halfway into the cuts, there is a broad expectation that the supply cuts will be extended into the second half of the year. Despite the rising consensus of extended cuts, the OPEC-led strategy to re-balance oil markets is not without controversy. As OPEC and especially Saudi Arabia cut their production, other producers not participating in the cuts have been quick to fill the supply gap and gain market share. (Reuters).

In the United States in particular, shale oil drillers have seized the opportunity to ramp up output and exports. As a result, China became the third biggest overseas destination for U.S. crude oil in 2016, according to data from the Energy Information Administration (EIA), up from ninth position the previous year.

"In 2016, U.S. crude oil exports averaged 520,000 bpd, 12 percent above the 2015 level, despite a year-over-year decline in domestic crude oil production," the EIA said.

Conclusion: Currently, the U.S has the upper hand controlling oil bearish levels, but given the above fundamentals between Libyan oil field issues and OPEC and Non-OPEC deal waving on horizon, crude levels could steady back to $50>$52 pb, that's if and only if. Otherwise, crude levels will sustain the $47>$49 pb.

Remark : Look forward for U.S Crude inventories set to be released today at 3:30 PM GMT and forecasts are 1.2M compared to 5.2M on previous sessions. The above fundamentals are the key player and markets should pay attention about what's coming next, either from OPEC or perhaps another new fundamental other than Libyan protesters, which could tackle oil prices upward or downward.

For more in depth Research & Analysis please visit FxGrow.http://fxgrow.com/analysis-educatio...cal-analysis-fxgrow-free-forex-analysis-tools

Note: This analysis is intended to provide general information and does not constitute the provision of INVESTMENT ADVICE. Investors should, before acting on this information, consider the appropriateness of this information having regard to their personal objectives, financial situation or needs. We recommend investors obtain investment advice specific to their situation before making any financial investment decision.
 
FxGrow Fundamental Analysis – 30th March, 2017
By FxGrow Investment Research Desk

Gold Bullish Forces Decelerate By Awakening U.S Dollar, Awaiting Further Data
Gold_zpsihb1qwew.png


Gold has entered the 6th bullish consolidation session and has been jailed with 200-pips price action. The yellow metal plunged to 1248.30 low today after a long struggle with 1250 handle, and yesterday, XAUUSD couldn't overcome the 1255 hitch which still supports the bullish trend. On Tuesday, gold peeked to 1258.47 high, keeping a tight range between Monday's 1261.10 high, as U.S index sank to 98.65 2017 low, and markets expected gold to jet ride for higher levels giving the circumstances.

Gold bullish forces were tackled by positive U.S CB consumer confidence which sparked USD bearish levels and U.S index showed a minor recovery today with 99,89 high, postponing gold sky trip for another session as U.S releases today unemployment claims, but the main focus will be on the GDP as analysts tend to relate it directly to U.S fed policy and their in take. U.S GDP today will set the tone for next FOMC members speech with the possibility of hawkish or dovish tone regarding next interest hikes, and traders has to take U.S data today as articular as well gold levels will.

Note: Keep in mind that releasing Article 50 with the French coming election could provoke uncertainties around EU, and gold prices could rally as traders tend to turn to XAUUSD as a sacred haven metal instead of currencies.

Fundamentals:

USD - Unemployment Claims today at 1:30 PM GMT.

USD - Final GDP q/q today 1:30 at 1:30 PM GMT.

Technical:

Trend: Bullish Sideways

Resistance levels : R1 1263.71, R2 1275.94, R3 1284.24

Support levels : S1 1244.48, S2 1236.62, S3 1225.25

Remark: The market remains bullish and calls for additional attacks towards R1 although U.S index has showed vital signs. A break above R1 which is considered articular which projects intensive bullish waves towards R3 level due to previous retracements and setbacks from R1. Staying within Monday's range keeps bullish forces in action as well as the trend. A penetration for S2 levels, signals a beginning for bearish trend and closing below S3, market to consider gold downward. U.S economic data not to be missed today in corelation with U.S Index levels which impacts gold levels directly.

For more in depth Research & Analysis please visit FxGrow.

Note: This analysis is intended to provide general information and does not constitute the provision of INVESTMENT ADVICE. Investors should, before acting on this information, consider the appropriateness of this information having regard to their personal objectives, financial situation or needs. We recommend investors obtain investment advice specific to their situation before making any financial investment decision.
 
Back
Top