Sive Morten
Special Consultant to the FPA
- Messages
- 18,644
Greetings everybody, guys,
as I've said in Friday's video - it's time to take a look at GBP. There are really big processes stand under way, as in economical and fundamental sphere as in charts analysis.
Fundamentals
There are two points now stand on the table and both are not really supportive to GBP. Now we ignore geopolitical issues, even without them, we have a lot of topics to talk about. First topic on the table is Brexit, which is again comes on first stage. As you know legal divorce should happen in March 2019, while Brussels and London couldn't come to compromise on physical border. This is tough question guys, because border could be either between Republic of Ireland and Northern Ireland, or in the Ireland Sea between Ireland island and Great Britain island.
First case, when "hard" border will split Ireland in two parts is unacceptable, because everybody keeps memories of conflicts in 70-80's and carry on Belfast agreement (Good Friday agreement of 1998) which reduce tensions. Besides, here is tricky moment exists, that Theresa May's Conservative cub gets in dependency from N. Ireland unionists. They have just 10 seats, but they in particular provide necessary majority in parlament.
Second scenario, when border will be in Ireland Sea - this is a nightmare for all Brits and for Democratic unionists in particular. Because in this case single economic space of Great Britain will be split in two parts.
Last meeting on this subject has brought no progress on this question, but time is passing bye.
Second issue is more important in short-term perspective. This is economical data and possible rate change by BoE in May. I'm not smart enough to make fundamental analysis of GB economy (and actually do not have time and all necessary data to do this). That's why in my view I'm try to keep with Fathom consulting analysis. They have shown very good results in the past. Our followers should remember how we've traded their setups on BoE rate changes and Parliament elections last year.
Now let's see what they talk about coming BoE rate decision in May. But first, let's take a look at recent UK data.
Reuters reports that The British pound flirted with two-week lows against the dollar on Friday following comments from the Bank of England chief and soft UK retail sales data, while the yen eased as risk sentiment was on the mend.
Bank of England Governor Mark Carney dampened widespread expectations for an interest rate hike in May on Thursday, pointing out there were also “other meetings” this year.
Disappointing UK retail sales released earlier on Thursday also raised some doubts about the outlook for UK rate hikes.
Another technical impact comes from USD directly as US yields has reached new highs.
“Higher U.S. yields have contributed to the rise in the dollar,” said Chuck Tomes, senior investment analyst at Manulife Asset Management in Boston.
U.S. two-year Treasury yields reached 2.453 percent on Friday, the highest level since September 2008 as the two-year’s spread versus two-year German Bunds grew to 302 basis points, the widest in more than three decades.
As a result, this has made impact on EUR as well. Recall that we've talked about saturated long speculative positions. On Friday they were partially closed, as investors start preparation to ECB meeting next week.
The euro fell to a two-week low versus the dollar, for its biggest weekly drop in two months, as investors trimmed record high bets before a European Central Bank meeting next week where policymakers are largely expected to signal no change in policy.
This week, Federal Reserve officials signaled further interest rate increases in 2018 based on evidence of steady U.S. growth, while the heads of the ECB and the Bank of England seemed in no rush to push rates higher in the wake of disappointing economic data out of Britain and Europe.
This is totally agrees with Fathom consulting opinion that we've mentioned in our previous GBP research. Speaking in two words, Fathom's analysis point that UK economy stands in recession. January data on construction has shown 3.4% drop - the biggest in 5 years. Construction is a sphere that involves a lot of different economic processes and business in country. As Fathom wrote:
"While the UK construction industry accounts for just 6% of total UK output, it is nevertheless a useful barometer of confidence in the economy. Other recent data confirm a slowdown in consumers’ expenditure, with the Visa measure of high street spending falling by 1.1% in the twelve months to February, after adjusting for the effects of inflation."
Source: Reuters, Fathom consulting

In March report, Fathom told:
"As we explained in more detail to our clients in January, with net trade unlikely to offset domestic demand weakness (it subtracted from GDP growth in all but one quarter last year), we expect GDP growth to soften further from here. If we are right, economic activity will slow to below the pace that the UK Monetary Policy Committee regards as the “speed limit”, meaning that a rate hike in May could well be off the cards."
Their UK sentiment indicator has pointed on possible recession through 2018-2019 year.
Most recent report is dedicated to BoE voting on rate policy and also shows weaker progress in this direction.
"As we explained to clients last week, a rate hike at the Committee’s next meeting in May is not nailed on, and even if a hike does occur, it is unlikely to mark the start of a tightening cycle."
Source: Reuters, Fathom consulting

"Indeed, as confirmed by the Minutes, the latest economic indicators have been mixed and weather poor, causing Bank staff to revise down the estimate of 2018 Q1 GDP growth to 0.3%. That is far lower than the average rate (0.8%) reported at the time of past rate rises. And although Ian McCafferty and Michael Saunders were some of the first to break rank last year, voting for a rate rise with a majority forming behind them several meetings later in November 2017, that is far from always the case. If we are right, and economic activity slows to below the pace that the MPC regards as the ‘speed limit’, the next monetary policy decision in May is likely to be a close call. Contrary to the consensus, our central view is that the MPC will not hike; but if it does, it is unlikely to mark the second of many."
Now take a look again at recent comments from BOE Governor Mark Carney on Thursday, which traders interpreted as the BOE’s being less committed to raising rates in May due to recent “mixed” data.
So Cable will stand under double impact in nearest future - first is from USD strength, while second is weakness and indecision of BoE representatives, combined with poor economic statistics.
COT Report
As GBP just has dived down - there are no big changes in CFTC data yet. But, take a look what has happened on 10-year US bonds and US dollar:
Reuters reports that:
"Speculators’ net bearish bets on U.S. 10-year Treasury note futures rose earlier this week prior to a bond market sell-off that lifted the 10-year yield to its highest since January 2014 on Friday, according to Commodity Futures Trading Commission data released on Friday.
"Speculators' net short dollar position surged to the highest since August 2011 in the latest week, according to calculations by Reuters and Commodity Futures Trading Commission data released on Friday."
So, short position is highly saturated on USD and could be unwind on coming week.
"U.S. dollar positioning has reached an extreme that could lead to a pullback in short bets, especially given the greenback's recovery this week."
"There was not one, but four main catalysts for the U.S. dollar's recovery this past week," said Kathy Lien, managing director of FX strategy, at BK Asset Management in New York. She cited the rise in Treasury yields, softer global data, solid U.S. retail sales and a more upbeat Beige Book report, including a generally quiet environment on the geopolitical front.
"If President Trump stays relatively quiet, U.S. data beats (forecasts) and 10-year Treasury yields edge closer to 3 percent, the U.S. dollar can extend its gains," Lien added.
As USD positions is overextended down, it means that positions on other currencies, including GBP are overextended up:
Euro net longs, meanwhile, rose to a record high of 151,476 contracts, CFTC data showed.
GBP net speculative positions have not reached yet absolute high, but flirt around it. Last data shows ~47K, while absolute high is 56.4K contracts on GBP/USD:

Technicals
Monthly
In our previous analysis we said - "That's being said, monthly chart shows that GBP stands at some moment of truth. Downside reversal here could bring far-going consequences of bearish kind. While upside breakout of this area will indicate trend shift because price will break harmonic swing retracement and YPR1 area."
Although price is coiling around YPR1 for 4th month in a row after completion upside harmonic swing and reaching of 1/2 Fib resistance, in April we probably will get very important bearish pattern here. This pattern doesn't promise yet the global collapse, it will just put foundation for pullback. But who knows, what will happen later.
Fundamental background is not really positive for UK now. As we read above, in Fathom's release, they expect some recession in 2018 and no rate increase from BoE.
There is just one week till the end of the April and here we could point the fact that GBP has failed to break YPR1. We probably will get "gravestone doji" on monthly chart and - W&R of previous top, which will be visible better on weekly chart.
Previously we've mentioned that overall upside shape of price doesn't show real thrusting signs. It is rather gradual and major answer we will get as soon as harmonic retracement will be completed. Now time has come, and we see mostly bearish price action. This let's us to recall our bearish targets.
First, GBP has uncompleted very long-term AB-CD target around 1.1650 area. Market has turned up just 350 pips above it, which is small distance for monthly scale. When such turning happens, this creates friable background of upside action. In fact, you never know where precisely market could stepped out and start dropping again, tending to uncompleted target. The same situation we have here.
Market right now stands near overbought and inside resistance cluster of Fib level, YPR1 and natural area of monthly lows of 2007-2009 around 1.42 area.
In our previous analysis we've suggested that GBP could turn down somewhere around 1.39-1.41 and now we're just watching for response. Definitely market feels some barrier around it.
Finally, reaching of yearly Pivot resistance 1 will be a moment of particular interest. Pivots are not just support or resistance. They are sentiment indicators. And if GBP will fail to break it - this could become clear signal of coming downside reversal.

Weekly
Here, guys, if we remember, we were watching for bearish reversal within last 4-5 weeks, when market has completed major XOP target right around monthly resistance and later we also have got two bearish grabbers.
When later market has turned up again and destroyed our bearish setup, we again has turned to "stand by" mode. Mostly recent rally on GBP was due expectation of rate increase. Now this background has fragile foundation and this also impacts on technical picture.
Although last week's bar is not a grabber, but nevertheless, it is bearish enough. First - it should clear W&R of previous top, second - this is bearish engulfing pattern and, finally - this is reversal week, because price has made new top but closed below the lows of previous candle.
As market is not at oversold, this opens road at least to 1.3750-1.3765 support area. But, I suspect that drop will get more extended scale and this will be just a beginning. It really could be Double Top.

Daily
Daily time frame also shows picture that is far from bullish. Recent sell-off was really dramatic, here we probably could talk about rather rare "3 Black crows" pattern, although I prefer to look for it on weekly and higher time frames.
Most important issue here is 1.40 area. This is strong support of MPP, Fib level, daily OS. In fact we have bullish DiNapoli "Stretch" pattern. As there are some time till BoE meeting, market could get relief within 1-2 weeks, especially if some verbal intervention will come from BoE representatives.
As a result, I do not exclude possible H&S pattern here, with pullback to 1.4220-1.4240 area, or slightly weaker, as drop was really very strong.
Anyway some pullback is needed for taking short position, because right now it is not good idea to sell, when price stands at strong support and OS area:

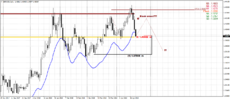
Intraday
Right now we do not have clear bullish signs, which might indicate upside retracement. Market has completed rather steep AB=CD OP target, which makes daily Fib Level as Agreement support. Right now there are two major upside levels, that could be reached. First is K-area around 1.4150 and WPP, second is 1.4230 Fib level and weekly PR1.
Second level is interesting, because it corresponds to top of left arm on daily chart.

Conclusion:
GB now is involving in multiple processes as political as economical. Financially, UK economy now stands in a difficult period. This gives a lot of uncertainty even in nearest future, including BoE policy.
Finally GBP starts to show clear bearish signs of solid strength which could have far going consequences.On coming week we're mostly interested in upside pullback, which could give better conditions for short entry.
The technical portion of Sive's analysis owes a great deal to Joe DiNapoli's methods, and uses a number of Joe's proprietary indicators. Please note that Sive's analysis is his own view of the market and is not endorsed by Joe DiNapoli or any related companies.
as I've said in Friday's video - it's time to take a look at GBP. There are really big processes stand under way, as in economical and fundamental sphere as in charts analysis.
Fundamentals
There are two points now stand on the table and both are not really supportive to GBP. Now we ignore geopolitical issues, even without them, we have a lot of topics to talk about. First topic on the table is Brexit, which is again comes on first stage. As you know legal divorce should happen in March 2019, while Brussels and London couldn't come to compromise on physical border. This is tough question guys, because border could be either between Republic of Ireland and Northern Ireland, or in the Ireland Sea between Ireland island and Great Britain island.
First case, when "hard" border will split Ireland in two parts is unacceptable, because everybody keeps memories of conflicts in 70-80's and carry on Belfast agreement (Good Friday agreement of 1998) which reduce tensions. Besides, here is tricky moment exists, that Theresa May's Conservative cub gets in dependency from N. Ireland unionists. They have just 10 seats, but they in particular provide necessary majority in parlament.
Second scenario, when border will be in Ireland Sea - this is a nightmare for all Brits and for Democratic unionists in particular. Because in this case single economic space of Great Britain will be split in two parts.
Last meeting on this subject has brought no progress on this question, but time is passing bye.
Second issue is more important in short-term perspective. This is economical data and possible rate change by BoE in May. I'm not smart enough to make fundamental analysis of GB economy (and actually do not have time and all necessary data to do this). That's why in my view I'm try to keep with Fathom consulting analysis. They have shown very good results in the past. Our followers should remember how we've traded their setups on BoE rate changes and Parliament elections last year.
Now let's see what they talk about coming BoE rate decision in May. But first, let's take a look at recent UK data.
Reuters reports that The British pound flirted with two-week lows against the dollar on Friday following comments from the Bank of England chief and soft UK retail sales data, while the yen eased as risk sentiment was on the mend.
Bank of England Governor Mark Carney dampened widespread expectations for an interest rate hike in May on Thursday, pointing out there were also “other meetings” this year.
Disappointing UK retail sales released earlier on Thursday also raised some doubts about the outlook for UK rate hikes.
Another technical impact comes from USD directly as US yields has reached new highs.
“Higher U.S. yields have contributed to the rise in the dollar,” said Chuck Tomes, senior investment analyst at Manulife Asset Management in Boston.
U.S. two-year Treasury yields reached 2.453 percent on Friday, the highest level since September 2008 as the two-year’s spread versus two-year German Bunds grew to 302 basis points, the widest in more than three decades.
As a result, this has made impact on EUR as well. Recall that we've talked about saturated long speculative positions. On Friday they were partially closed, as investors start preparation to ECB meeting next week.
The euro fell to a two-week low versus the dollar, for its biggest weekly drop in two months, as investors trimmed record high bets before a European Central Bank meeting next week where policymakers are largely expected to signal no change in policy.
This week, Federal Reserve officials signaled further interest rate increases in 2018 based on evidence of steady U.S. growth, while the heads of the ECB and the Bank of England seemed in no rush to push rates higher in the wake of disappointing economic data out of Britain and Europe.
This is totally agrees with Fathom consulting opinion that we've mentioned in our previous GBP research. Speaking in two words, Fathom's analysis point that UK economy stands in recession. January data on construction has shown 3.4% drop - the biggest in 5 years. Construction is a sphere that involves a lot of different economic processes and business in country. As Fathom wrote:
"While the UK construction industry accounts for just 6% of total UK output, it is nevertheless a useful barometer of confidence in the economy. Other recent data confirm a slowdown in consumers’ expenditure, with the Visa measure of high street spending falling by 1.1% in the twelve months to February, after adjusting for the effects of inflation."
Source: Reuters, Fathom consulting
In March report, Fathom told:
"As we explained in more detail to our clients in January, with net trade unlikely to offset domestic demand weakness (it subtracted from GDP growth in all but one quarter last year), we expect GDP growth to soften further from here. If we are right, economic activity will slow to below the pace that the UK Monetary Policy Committee regards as the “speed limit”, meaning that a rate hike in May could well be off the cards."
Their UK sentiment indicator has pointed on possible recession through 2018-2019 year.
Most recent report is dedicated to BoE voting on rate policy and also shows weaker progress in this direction.
"As we explained to clients last week, a rate hike at the Committee’s next meeting in May is not nailed on, and even if a hike does occur, it is unlikely to mark the start of a tightening cycle."
Source: Reuters, Fathom consulting
"Indeed, as confirmed by the Minutes, the latest economic indicators have been mixed and weather poor, causing Bank staff to revise down the estimate of 2018 Q1 GDP growth to 0.3%. That is far lower than the average rate (0.8%) reported at the time of past rate rises. And although Ian McCafferty and Michael Saunders were some of the first to break rank last year, voting for a rate rise with a majority forming behind them several meetings later in November 2017, that is far from always the case. If we are right, and economic activity slows to below the pace that the MPC regards as the ‘speed limit’, the next monetary policy decision in May is likely to be a close call. Contrary to the consensus, our central view is that the MPC will not hike; but if it does, it is unlikely to mark the second of many."
Now take a look again at recent comments from BOE Governor Mark Carney on Thursday, which traders interpreted as the BOE’s being less committed to raising rates in May due to recent “mixed” data.
So Cable will stand under double impact in nearest future - first is from USD strength, while second is weakness and indecision of BoE representatives, combined with poor economic statistics.
COT Report
As GBP just has dived down - there are no big changes in CFTC data yet. But, take a look what has happened on 10-year US bonds and US dollar:
Reuters reports that:
"Speculators’ net bearish bets on U.S. 10-year Treasury note futures rose earlier this week prior to a bond market sell-off that lifted the 10-year yield to its highest since January 2014 on Friday, according to Commodity Futures Trading Commission data released on Friday.
"Speculators' net short dollar position surged to the highest since August 2011 in the latest week, according to calculations by Reuters and Commodity Futures Trading Commission data released on Friday."
So, short position is highly saturated on USD and could be unwind on coming week.
"U.S. dollar positioning has reached an extreme that could lead to a pullback in short bets, especially given the greenback's recovery this week."
"There was not one, but four main catalysts for the U.S. dollar's recovery this past week," said Kathy Lien, managing director of FX strategy, at BK Asset Management in New York. She cited the rise in Treasury yields, softer global data, solid U.S. retail sales and a more upbeat Beige Book report, including a generally quiet environment on the geopolitical front.
"If President Trump stays relatively quiet, U.S. data beats (forecasts) and 10-year Treasury yields edge closer to 3 percent, the U.S. dollar can extend its gains," Lien added.
As USD positions is overextended down, it means that positions on other currencies, including GBP are overextended up:
Euro net longs, meanwhile, rose to a record high of 151,476 contracts, CFTC data showed.
GBP net speculative positions have not reached yet absolute high, but flirt around it. Last data shows ~47K, while absolute high is 56.4K contracts on GBP/USD:
Technicals
Monthly
In our previous analysis we said - "That's being said, monthly chart shows that GBP stands at some moment of truth. Downside reversal here could bring far-going consequences of bearish kind. While upside breakout of this area will indicate trend shift because price will break harmonic swing retracement and YPR1 area."
Although price is coiling around YPR1 for 4th month in a row after completion upside harmonic swing and reaching of 1/2 Fib resistance, in April we probably will get very important bearish pattern here. This pattern doesn't promise yet the global collapse, it will just put foundation for pullback. But who knows, what will happen later.
Fundamental background is not really positive for UK now. As we read above, in Fathom's release, they expect some recession in 2018 and no rate increase from BoE.
There is just one week till the end of the April and here we could point the fact that GBP has failed to break YPR1. We probably will get "gravestone doji" on monthly chart and - W&R of previous top, which will be visible better on weekly chart.
Previously we've mentioned that overall upside shape of price doesn't show real thrusting signs. It is rather gradual and major answer we will get as soon as harmonic retracement will be completed. Now time has come, and we see mostly bearish price action. This let's us to recall our bearish targets.
First, GBP has uncompleted very long-term AB-CD target around 1.1650 area. Market has turned up just 350 pips above it, which is small distance for monthly scale. When such turning happens, this creates friable background of upside action. In fact, you never know where precisely market could stepped out and start dropping again, tending to uncompleted target. The same situation we have here.
Market right now stands near overbought and inside resistance cluster of Fib level, YPR1 and natural area of monthly lows of 2007-2009 around 1.42 area.
In our previous analysis we've suggested that GBP could turn down somewhere around 1.39-1.41 and now we're just watching for response. Definitely market feels some barrier around it.
Finally, reaching of yearly Pivot resistance 1 will be a moment of particular interest. Pivots are not just support or resistance. They are sentiment indicators. And if GBP will fail to break it - this could become clear signal of coming downside reversal.
Weekly
Here, guys, if we remember, we were watching for bearish reversal within last 4-5 weeks, when market has completed major XOP target right around monthly resistance and later we also have got two bearish grabbers.
When later market has turned up again and destroyed our bearish setup, we again has turned to "stand by" mode. Mostly recent rally on GBP was due expectation of rate increase. Now this background has fragile foundation and this also impacts on technical picture.
Although last week's bar is not a grabber, but nevertheless, it is bearish enough. First - it should clear W&R of previous top, second - this is bearish engulfing pattern and, finally - this is reversal week, because price has made new top but closed below the lows of previous candle.
As market is not at oversold, this opens road at least to 1.3750-1.3765 support area. But, I suspect that drop will get more extended scale and this will be just a beginning. It really could be Double Top.
Daily
Daily time frame also shows picture that is far from bullish. Recent sell-off was really dramatic, here we probably could talk about rather rare "3 Black crows" pattern, although I prefer to look for it on weekly and higher time frames.
Most important issue here is 1.40 area. This is strong support of MPP, Fib level, daily OS. In fact we have bullish DiNapoli "Stretch" pattern. As there are some time till BoE meeting, market could get relief within 1-2 weeks, especially if some verbal intervention will come from BoE representatives.
As a result, I do not exclude possible H&S pattern here, with pullback to 1.4220-1.4240 area, or slightly weaker, as drop was really very strong.
Anyway some pullback is needed for taking short position, because right now it is not good idea to sell, when price stands at strong support and OS area:
Intraday
Right now we do not have clear bullish signs, which might indicate upside retracement. Market has completed rather steep AB=CD OP target, which makes daily Fib Level as Agreement support. Right now there are two major upside levels, that could be reached. First is K-area around 1.4150 and WPP, second is 1.4230 Fib level and weekly PR1.
Second level is interesting, because it corresponds to top of left arm on daily chart.
Conclusion:
GB now is involving in multiple processes as political as economical. Financially, UK economy now stands in a difficult period. This gives a lot of uncertainty even in nearest future, including BoE policy.
Finally GBP starts to show clear bearish signs of solid strength which could have far going consequences.On coming week we're mostly interested in upside pullback, which could give better conditions for short entry.
The technical portion of Sive's analysis owes a great deal to Joe DiNapoli's methods, and uses a number of Joe's proprietary indicators. Please note that Sive's analysis is his own view of the market and is not endorsed by Joe DiNapoli or any related companies.

")