Sive Morten
Special Consultant to the FPA
- Messages
- 18,659
Fundamentals
(Reuters) - The dollar fell to a five-week low on Friday, remaining under pressure for a third straight session after the Federal Reserve quashed hopes for a further currency bull run by keeping a gradual rate-hiking pace.
"At the moment, the dollar remains in correction mode, which we had fully expected," said Fawad Razaqzada, market analyst, Forex.com in London. "But we remain fundamentally bullish on the greenback because the Fed remains the only major central bank which is actively tightening its policy."
James Chen, head of research at Forex.com in Bedminster, New Jersey, also pointed out that the pace of Fed rate hikes and policy outlooks can change extremely quickly.
He noted that only a few weeks before Wednesday's Fed announcement, expectations for a March hike were exceptionally low. But Fed officials made a concerted effort to warn the markets of the high likelihood of a Fed rate hike and expectations then soared to a near-certainty, Chen said.
"This same rapid change in expectations could very likely occur again at any time, assuming the Trump administration's fiscal plans begin to take root."
With the Fed policy meeting out of the way, investors focused on Friday's G20 financial leaders meeting in Baden Baden. It will be one of the most closely-watched G20 meetings for the currency market.
Any hints of a broader push by Washington against an appreciating dollar are likely to weaken the currency.
The surge in the dollar in the weeks after the U.S. election last November was largely due to expectations of increased spending. But a higher U.S. budget deficit is likely to dampen that view.
Jane Foley, senior FX strategist at Rabobank in London, said she sees the risk that any additional spending may not happen until the end of the year, or potentially 2018.
"That disappointment over the reflationary outlook could weigh on the dollar in the coming months," she added.
In late trading, the dollar index slipped 0.1 percent to 100.30, after earlier falling to a five-week low. The index was down almost 1 percent overall for the week and 1.2 percent since the Fed raised rates on Wednesday.
Against the yen, the dollar fell to a two-week low and last traded down 0.6 percent at 112.68 yen.
The euro, meanwhile, fell against the dollar after a poll showed far-right anti-EU leader Marine Le Pen extending her lead over centrist Emmanuel Macron in the first round of France's presidential elections. The euro was last down 0.2 percent at $1.0740.
Is there a Brexit-related upside for the UK?
by Fathom Consulting
Will Brexit turn out to be a storm in a teacup, or is there worse to come? Our view is that UK GDP growth will slow more dramatically than the consensus believes. But what if we are wrong? We use our global economic model, GESAM, to construct a scenario where the UK leaves the EU on good terms. Surprisingly, even the benefits of this rosy scenario, to which we attach little weight, appear small.

We considered only a downside scenario, where increasing isolationism across Europe brought the ‘Draghi put’ to an end. In this scenario, Europe entered a renewed banking crisis, peripheral yields rose substantially and growth was materially weaker.
But could there be a Brexit-related upside?
We have used our Global Economic and Strategic Allocation Model, GESAM, to analyse the potential consequences of a reduction in ‘red tape’ that occurs alongside an improvement in the UK’s trading relationships with the rest of the world.
Every five years, the OECD publishes an index of product market regulation (PMR). Based on responses to more than 800 questions, the survey yields an overall index of PMR that is bounded by zero and six, where a reading of zero indicates a near-absence of PMR.
We find a statistically significant role for the OECD’s PMR index in our model of an economy’s productive potential, with an index point rise in PMR lowering potential output by just over 3%. And yet, in 2013 the burden of red tape in the UK was already low. Indeed, it was lower than in most other EU countries.
Were the UK able to cut red tape following its departure from the EU to such a degree that its index of PMR matched the Netherlands – the state of the art in terms of light-touch regulation – we find that the level of potential output in the UK would rise by little more than 0.5%.

Our model of an economy’s potential output also includes a role for trade linkages, with countries that trade more enjoying a higher level of potential output, just as David Ricardo predicted 200 years ago. We find that, were the UK to negotiate a series of new trade deals on departure from the EU, allowing the historic upward trend in UK trade to resume, then this would add just 0.1 percentage points to UK growth.

In our view, the biggest obstacle to a return to pre-crisis rates of growth is not excessive product market regulation, nor is it a slowdown in the pace of globalisation. Our growing belief is that monetary policy is to blame with interest rates having been ‘too low, for too long’. We estimate that UK TFP growth has slowed by around half a percentage point as a result of a reduction in the pace of corporate failures – or “creative destruction”. In this environment, our advice remains to sell the pound and buy inflation protection.
COT Report
CFTC data this week brings very important picture on GBP. GBP has renewed absolute lows for net speculative position. Thus, right now speculators' shorts stand at maximum level since 2008. Open interest is also extremely high. It means that all investors keep shorts and nobody's buying. Although fundamental picture stands bearish for GBP and we also think that we could get another one leg down in long-term perspective. In short-term perspective we could get tactical bounce up to off-load extreme shorts speculative positions:

Once we had similar situation on gold market, when it was on 1380 top. Right now we have in on GBP but in opposite direciton. Taking in consideration this picture - GBP currently just has no power to continue move down and needs some relief...
Technicals
Monthly
Right now monthly trend is bearish, but market is not at oversold on monthly chart. Market has completed all-time 0.618 AB=CD target and right now stands around it. Overall consolidation remains bearish flag pattern. Now meaningul upside reaction has followed yet on completion of the target.
Overall picture looks bearish by some signs. First is - acceleration down to AB-CD target. Usually fast drop on this point tells that market has chances to continue to AB=CD target, which stands at 1.06 area. Currently it seems too brave suggestion, but at least some minor continuation down is very probable.
The point is if you will take a look at all-time GBP chart, you'll see that market already has broken major 5/8 Fib support and on a way down, drop is really fast since first leg was on 2008 crisis. Overall fundamental situation is mostly supportive to this scenario, besides, 20 points is not really big distance to GBP that is more volatile than many other major currencies. Fundamentally, as we've read above, Fathom consulting also supports idea of further GBP weakness.
But right now we're mostly interested in possible short-term tactical upside bounce. Currently it is difficult to judge on probability that it will happen and on possible targets, but we will try...
Here we have two factors that in general support idea of possible upside bounce. First is - sentiment analsys as GBP is extremely oversold according to CFTC data. Second - on monthly chart we have small W&R of 1.2020 lows. This is very weak context, but we need to take in consideration all details.

Weekly
On weekly chart we have another pattern that could push cable slightly higher. This is bullish grabber that was formed last week. In general, since October market shows signs of bearish dynamic pressure. Another risk factor is untouched 1.618 AB-CD target. That's why, as we've said overall bullish setup is arguable or at least brings more risks to fail than usual.
Still, although untouched targets exist - speculative position is too short. Markets needs more shorts to come to complete AB-CD, but it doesn't have it. That's why there are chances exist that first we will get upside bounce and only after that GBP will drop to next downward target:

Minimum upside potential stands around 300 pips, as price should take out previous top by grabber. More extended targets could take the shape of upside AB-CD, but right now all of them stand above weekly overbought, that's why they are not interesting for us by far.
Due existing of the grabber, invalidation point also becomes clear - this is 1.21 area.
Also it is clear that we mostly should focus on most recent upside candle for trading, we do not need swings of larger scale for this setup.
Daily
Here we also have bullish trend. Daily picture is important as it brings array of patterns. First one that we will deal with is upside AB-CD to 1.2830 area. Mostly it matches to grabber pattern and leads to completion of its target.
In general, sideways consolidation since September reminds the shape of H&S pattern. Yes, it doesn't hold ratios, but still, shoulders are rather equal, head also is well recognizable. If upside action will continue by some reason, we could pay attention to more extended patterns that are 1.618 AB-CD and upside butterfly.
Finally here we have very large potential pattern as well - this also could be reverse H&S. Left butterfly is a shoulder, while current consolidation is the head...
As you can see, potentially picture looks impressive. But to trigger all these targets, market has to make first step, i.e. keep standing above 1.20 lows and start upside action:

Hourly
So, as we've said, we're mostly interested in recent upside thrust, which is weekly grabber. If price will erase it, our setup will be destroyed.
In general our tactic here is to buy some deep, as closer to the bottom as possible. Most attractive level is 1.23 K-support and WPP.
Retracement could start as soon as GBP will completed 1.618 AB-CD target. As usual, we want to see gradual retracement. If market will start dropping very fast - do not go long, or at least wait for deeper levels. It would be nice if we will get also some pattern or downward AB-CD that will coincide with our level.

Conclusion:
Currently we do not want to look too far in the future. Yes, market shows strong bearish action, especially on very long-term charts, drops down indeed look miserable, and from that standpoint GBP could reach even 1.06 target, but right now we're mostly interested in tactical weekly/daily setup.
Currently cable is forming the background that looks supportive for upside bounce. Another advantage of our setup is its scale - it is not too large. But, at the same time, we have some additional risk factors as major weekly target has not been hit yet.
The technical portion of Sive's analysis owes a great deal to Joe DiNapoli's methods, and uses a number of Joe's proprietary indicators. Please note that Sive's analysis is his own view of the market and is not endorsed by Joe DiNapoli or any related companies.
(Reuters) - The dollar fell to a five-week low on Friday, remaining under pressure for a third straight session after the Federal Reserve quashed hopes for a further currency bull run by keeping a gradual rate-hiking pace.
"At the moment, the dollar remains in correction mode, which we had fully expected," said Fawad Razaqzada, market analyst, Forex.com in London. "But we remain fundamentally bullish on the greenback because the Fed remains the only major central bank which is actively tightening its policy."
James Chen, head of research at Forex.com in Bedminster, New Jersey, also pointed out that the pace of Fed rate hikes and policy outlooks can change extremely quickly.
He noted that only a few weeks before Wednesday's Fed announcement, expectations for a March hike were exceptionally low. But Fed officials made a concerted effort to warn the markets of the high likelihood of a Fed rate hike and expectations then soared to a near-certainty, Chen said.
"This same rapid change in expectations could very likely occur again at any time, assuming the Trump administration's fiscal plans begin to take root."
With the Fed policy meeting out of the way, investors focused on Friday's G20 financial leaders meeting in Baden Baden. It will be one of the most closely-watched G20 meetings for the currency market.
Any hints of a broader push by Washington against an appreciating dollar are likely to weaken the currency.
The surge in the dollar in the weeks after the U.S. election last November was largely due to expectations of increased spending. But a higher U.S. budget deficit is likely to dampen that view.
Jane Foley, senior FX strategist at Rabobank in London, said she sees the risk that any additional spending may not happen until the end of the year, or potentially 2018.
"That disappointment over the reflationary outlook could weigh on the dollar in the coming months," she added.
In late trading, the dollar index slipped 0.1 percent to 100.30, after earlier falling to a five-week low. The index was down almost 1 percent overall for the week and 1.2 percent since the Fed raised rates on Wednesday.
Against the yen, the dollar fell to a two-week low and last traded down 0.6 percent at 112.68 yen.
The euro, meanwhile, fell against the dollar after a poll showed far-right anti-EU leader Marine Le Pen extending her lead over centrist Emmanuel Macron in the first round of France's presidential elections. The euro was last down 0.2 percent at $1.0740.
Is there a Brexit-related upside for the UK?
by Fathom Consulting
Will Brexit turn out to be a storm in a teacup, or is there worse to come? Our view is that UK GDP growth will slow more dramatically than the consensus believes. But what if we are wrong? We use our global economic model, GESAM, to construct a scenario where the UK leaves the EU on good terms. Surprisingly, even the benefits of this rosy scenario, to which we attach little weight, appear small.
We considered only a downside scenario, where increasing isolationism across Europe brought the ‘Draghi put’ to an end. In this scenario, Europe entered a renewed banking crisis, peripheral yields rose substantially and growth was materially weaker.
But could there be a Brexit-related upside?
We have used our Global Economic and Strategic Allocation Model, GESAM, to analyse the potential consequences of a reduction in ‘red tape’ that occurs alongside an improvement in the UK’s trading relationships with the rest of the world.
Every five years, the OECD publishes an index of product market regulation (PMR). Based on responses to more than 800 questions, the survey yields an overall index of PMR that is bounded by zero and six, where a reading of zero indicates a near-absence of PMR.
We find a statistically significant role for the OECD’s PMR index in our model of an economy’s productive potential, with an index point rise in PMR lowering potential output by just over 3%. And yet, in 2013 the burden of red tape in the UK was already low. Indeed, it was lower than in most other EU countries.
Were the UK able to cut red tape following its departure from the EU to such a degree that its index of PMR matched the Netherlands – the state of the art in terms of light-touch regulation – we find that the level of potential output in the UK would rise by little more than 0.5%.
Our model of an economy’s potential output also includes a role for trade linkages, with countries that trade more enjoying a higher level of potential output, just as David Ricardo predicted 200 years ago. We find that, were the UK to negotiate a series of new trade deals on departure from the EU, allowing the historic upward trend in UK trade to resume, then this would add just 0.1 percentage points to UK growth.
In our view, the biggest obstacle to a return to pre-crisis rates of growth is not excessive product market regulation, nor is it a slowdown in the pace of globalisation. Our growing belief is that monetary policy is to blame with interest rates having been ‘too low, for too long’. We estimate that UK TFP growth has slowed by around half a percentage point as a result of a reduction in the pace of corporate failures – or “creative destruction”. In this environment, our advice remains to sell the pound and buy inflation protection.
COT Report
CFTC data this week brings very important picture on GBP. GBP has renewed absolute lows for net speculative position. Thus, right now speculators' shorts stand at maximum level since 2008. Open interest is also extremely high. It means that all investors keep shorts and nobody's buying. Although fundamental picture stands bearish for GBP and we also think that we could get another one leg down in long-term perspective. In short-term perspective we could get tactical bounce up to off-load extreme shorts speculative positions:
Once we had similar situation on gold market, when it was on 1380 top. Right now we have in on GBP but in opposite direciton. Taking in consideration this picture - GBP currently just has no power to continue move down and needs some relief...
Technicals
Monthly
Right now monthly trend is bearish, but market is not at oversold on monthly chart. Market has completed all-time 0.618 AB=CD target and right now stands around it. Overall consolidation remains bearish flag pattern. Now meaningul upside reaction has followed yet on completion of the target.
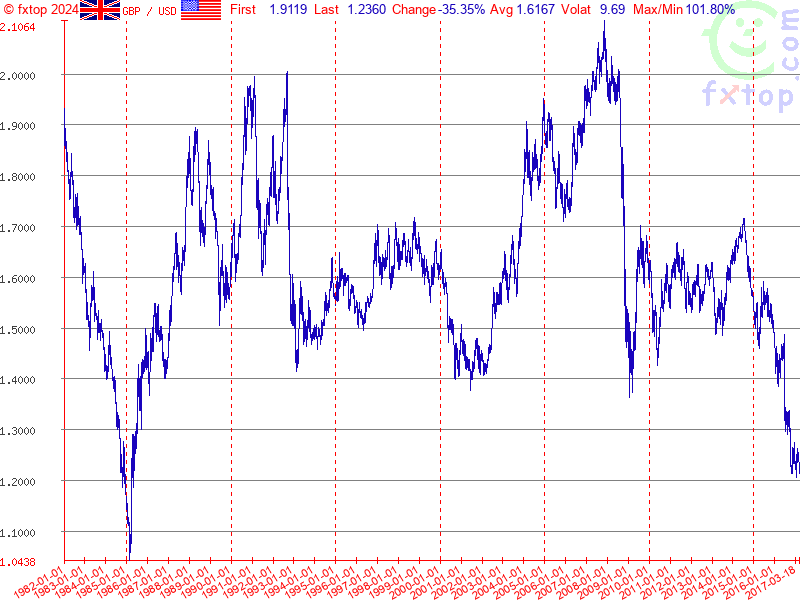
Overall picture looks bearish by some signs. First is - acceleration down to AB-CD target. Usually fast drop on this point tells that market has chances to continue to AB=CD target, which stands at 1.06 area. Currently it seems too brave suggestion, but at least some minor continuation down is very probable.
The point is if you will take a look at all-time GBP chart, you'll see that market already has broken major 5/8 Fib support and on a way down, drop is really fast since first leg was on 2008 crisis. Overall fundamental situation is mostly supportive to this scenario, besides, 20 points is not really big distance to GBP that is more volatile than many other major currencies. Fundamentally, as we've read above, Fathom consulting also supports idea of further GBP weakness.
But right now we're mostly interested in possible short-term tactical upside bounce. Currently it is difficult to judge on probability that it will happen and on possible targets, but we will try...
Here we have two factors that in general support idea of possible upside bounce. First is - sentiment analsys as GBP is extremely oversold according to CFTC data. Second - on monthly chart we have small W&R of 1.2020 lows. This is very weak context, but we need to take in consideration all details.
Weekly
On weekly chart we have another pattern that could push cable slightly higher. This is bullish grabber that was formed last week. In general, since October market shows signs of bearish dynamic pressure. Another risk factor is untouched 1.618 AB-CD target. That's why, as we've said overall bullish setup is arguable or at least brings more risks to fail than usual.
Still, although untouched targets exist - speculative position is too short. Markets needs more shorts to come to complete AB-CD, but it doesn't have it. That's why there are chances exist that first we will get upside bounce and only after that GBP will drop to next downward target:
Minimum upside potential stands around 300 pips, as price should take out previous top by grabber. More extended targets could take the shape of upside AB-CD, but right now all of them stand above weekly overbought, that's why they are not interesting for us by far.
Due existing of the grabber, invalidation point also becomes clear - this is 1.21 area.
Also it is clear that we mostly should focus on most recent upside candle for trading, we do not need swings of larger scale for this setup.
Daily
Here we also have bullish trend. Daily picture is important as it brings array of patterns. First one that we will deal with is upside AB-CD to 1.2830 area. Mostly it matches to grabber pattern and leads to completion of its target.
In general, sideways consolidation since September reminds the shape of H&S pattern. Yes, it doesn't hold ratios, but still, shoulders are rather equal, head also is well recognizable. If upside action will continue by some reason, we could pay attention to more extended patterns that are 1.618 AB-CD and upside butterfly.
Finally here we have very large potential pattern as well - this also could be reverse H&S. Left butterfly is a shoulder, while current consolidation is the head...
As you can see, potentially picture looks impressive. But to trigger all these targets, market has to make first step, i.e. keep standing above 1.20 lows and start upside action:
Hourly
So, as we've said, we're mostly interested in recent upside thrust, which is weekly grabber. If price will erase it, our setup will be destroyed.
In general our tactic here is to buy some deep, as closer to the bottom as possible. Most attractive level is 1.23 K-support and WPP.
Retracement could start as soon as GBP will completed 1.618 AB-CD target. As usual, we want to see gradual retracement. If market will start dropping very fast - do not go long, or at least wait for deeper levels. It would be nice if we will get also some pattern or downward AB-CD that will coincide with our level.
Conclusion:
Currently we do not want to look too far in the future. Yes, market shows strong bearish action, especially on very long-term charts, drops down indeed look miserable, and from that standpoint GBP could reach even 1.06 target, but right now we're mostly interested in tactical weekly/daily setup.
Currently cable is forming the background that looks supportive for upside bounce. Another advantage of our setup is its scale - it is not too large. But, at the same time, we have some additional risk factors as major weekly target has not been hit yet.
The technical portion of Sive's analysis owes a great deal to Joe DiNapoli's methods, and uses a number of Joe's proprietary indicators. Please note that Sive's analysis is his own view of the market and is not endorsed by Joe DiNapoli or any related companies.
")