Sive Morten
Special Consultant to the FPA
- Messages
- 18,648
Fundamentals
(Reuters FX news) - The euro rose against the U.S. dollar on Friday after strong euro zone inflation figures, while the dollar edged higher against the yen after U.S. wages data suggested the Federal Reserve would still hike interest rates two more times this year.
Official flash estimates put euro zone inflation at 1.9 percent in the first quarter, on the verge of crossing over the European Central Bank's target of below but close to 2 percent, and above estimates for a rise of 1.8 percent. According to standard EU measures, in Italy it was 2 percent.
That helped drive the euro as high as $1.0947, just below a 5-1/2-month high of $1.0950 struck earlier in the week.
Analysts said the latest inflation figures could prompt the ECB to take a more hawkish stance in its June statements by either upgrading its assessment of the European economy or suggesting less need for stimulus.
"There was a reminder this morning that maybe inflationary pressures will be coming through and maybe the ECB will have to go away from its super easy policy," said Axel Merk, president and chief investment officer of Palo Alto, California-based Merk Investments.
The dollar rose as much as 0.4 percent against the yen to a session high of 111.71 yen, just below a nearly four-week high of 111.77 touched April 26, after U.S. Labor Department data showed private wages and salaries accelerated 0.9 percent in the first quarter. That marked the largest increase in 10 years.
The data suggested firming inflation and helped boost the dollar even as the Commerce Department said U.S. gross domestic product increased at a 0.7 percent annual rate. That was the weakest performance since the first quarter of 2014.
"The GDP data won’t alter the view that the Fed may raise rates in June and then ultimately again in September," said Omer Esiner, chief market analyst at Commonwealth Foreign Exchange Inc in Washington.
The dollar index .DXY, which measures the greenback against a basket of six major rivals, was slightly lower at 99.015.
The euro was on track to gain 2.3 percent for the month to mark its second straight monthly rise against the dollar, while the dollar was set to end the month little changed against the yen. The dollar index was set to fall about 1.3 percent to mark its second straight monthly drop.
Fathom’s Chart of the Week: Brexit weighs on UK economy
by Fathom Consulting
According to Fathom’s model, which combines monthly production data with information from surveys, UK economic growth slowed to 0.4% in the first quarter of 2017. If correct, this would represent a marked slowdown from the 0.7% recorded in the final quarter of 2016.

Both survey and non-survey indicators point to a deceleration, suggesting that Brexit is beginning to weigh on the economy. The downturn in output over the first two months of this year appears to have been widespread, with some sectors witnessing outright contraction. Indeed, activity in the production and construction sectors fell by 0.9% and 1.8% in the two months to February, respectively. In spite of this, with October’s dip weighing on the fourth quarter average, UK production industries may manage to eke out positive quarterly growth of 0.7% in Q1. Meanwhile, we estimate that private service sector activity, which accounts for 55% of output, expanded by around 0.4% over the first quarter.
For the year as a whole, we forecast real GDP growth of 1.1%, slowing to 0.4% in 2018. This compares unfavourably with most forecasts, which have been revised higher in light of the unexpected resilience of the UK economy post Brexit vote. The divergence between our forecast and the consensus reflects our view that developments through the second half of last year were a case of ‘pain deferred’, rather than ‘pain avoided’. To that end, British Prime Minister Theresa May’s call for a snap general election to strengthen her position before the slowdown materially feeds through makes sense from a timing perspective.
COT Report
Today, guys we will take a look at cable while on EUR we do not see a lot of changes. We think that rally on EUR will hold around elections only but then big difference of Fed and ECB policies will take the lead and EUR will return to downward action to our target around the parity.
Meantime we refresh our GBP view. Those who are followed our weekly researches should remember that we have medium-term bullish setup and minimal targets that we've specified were achieved 2 weeks ago. Scenario that we follow has diversified background, including sentiment. As you can see GBP stands at all-time record of net short position with high level of open interest. It means that everybody keeps short position. When market strongly oversold it just can't go down further. That's why 2-3 weeks ago we said that GBP stands on the edge of big relief rally. And indeed it has started, but it seems that it is not over yet.
Last CFTC data shows that situation has started to change gradually, but changes are too shy yet. Net short position has decreased a bit, while open interest stands at the same record levels. It means that after just closing of shorts - replacement to longs has started. This process still has a signifcant potential by CFTC chart:

At least sentiment analysis tells that rally has not bad chances to be continued...
Technicals
Monthly
Monthly trend has turned bullish finally, but market is not at OBought on monthly chart. Market has completed all-time 0.618 AB=CD target and right shows reasonable upside reaction.
Overall long-term picture still looks bearish by some signs. First is - acceleration down to AB-CD target. Usually fast drop on this point tells that market has chances to continue to AB=CD target, which stands at 1.06 area. Currently it seems too brave suggestion, but at least some minor continuation down is very probable. Once we've mentioned HSBC bank forecast that it suggests to see pound around 1.10 area by the end of 2017. Thus, may be our view is not absolutely crackpot...
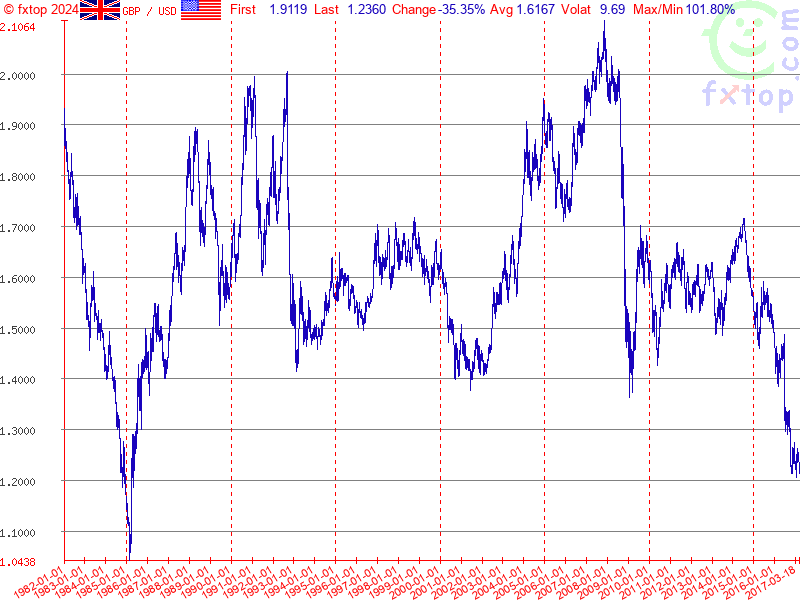
The point is if you will take a look at all-time GBP chart, you'll see that market already has broken major 5/8 Fib support and on a way down, drop is really fast since first leg was on 2008 crisis. Overall fundamental situation is mostly supportive to this scenario, besides, 20 points is not really big distance to GBP that is more volatile than many other major currencies. Fundamentally, as we've read above, Fathom consulting also supports idea of further GBP weakness.
But right now we're mostly interested in possible short-term tactical upside bounce. Actually may this is the one that we were waitng since drop to 1.18 as a part of our Volatility Breakout (VOB) trading. Based on VOB scenario, after upside relief downside continuation should follow as residual effect of bearish momentum.
Here we have two factors that in general support idea of possible upside bounce. First is - sentiment analysis as GBP is extremely oversold according to CFTC data, as we've specified above.
Second - on monthly chart we have small W&R of 1.2020 lows. Now we see that it has started to work as price has started upside action and took out previous top. Nearest destination point that will be important for coming week is Yearly Pivot around 1.3130 area:

Weekly
Here situation has changed since our last discussion. As you can see market has completed our bullish grabber pattern as previous tops around 1.27 area were exceeded. Now the reasonable question that we have to ask here - what's next?
On weekly chart we have three important issues. First one is weekly Overbought - price has reached it last week. It means that upside potential of cable will be limited on coming week. Thus, it would be better to not count on reaching some extended targets and focus on YPP @ 1.3130.
Second - we have untouched 1.618 extension of major AB-CD pattern that has started right at the 1.73 top area. Sooner or later but it should be hit. It means that although upside action looks solid by far, but it has a flaw and greater risk than it seems at first glance. Thus, we should be very careful to any bearish patterns that could be formed on daily chart.
Finally, speaking on more extended targets, using of harmonic swing points on 1.3350 area, but definitely it will not be reached on coming week as it stand beyond OB area.
That' being said, weekly combination suggests that we should be ready for retracement either before reaching of YPP or right after it.

Daily
Trend here is also bullish, but market is not at overbought. Daily patterns point approximately at the same 1.3130 area. Last week market has broken through very important and strong resistance area. Take a look - this was hard cluster of targets and levels, including 0,618 AB-CD, 1.27 butterfly, 5/8 Fib resistance (not shown) around 1.2850, and natural support/resistance area that has started in June 2016. Also minor butterly inner AB=CD pattern has been completed.
As a respect on this resistance area market has shown just minor consolidation without solid pullback. This fact shows that market is strong and really could continue upside action.
Still, as we've estimated above - let's focus on 1.3130 target on coming week. This will be Yearly Pivot, Fib level and 1.618 butterfly target. All this stuff will be at weekly Overbought. Combining all issues together, it is logical to suggest that market definitely will have problems to pass through this level immediately. Most probable scenario is completion of targets around 1.3130-1.3140 and then starting of retracement down.

4-hour
Currently guys, 4-hour chart shows clear picture only till 1.30 area. But as our major targets stand around 1.3130-1.3150, it means that market probably will take compound shape of retracement. For example, as 1.30 area will be hit, GBP will show minor pullback, say to MPP @ 1.2750, then there will be another leg up right to 1.3140 area and only after that major retracement will start.
Hardly price will leave untouched targets and start dropping immediately. Besides, weekly overbought is rather flexible range. It let's price to fluctuate on lower time frames inside the week, thus our target still could be reached.
Another reason why we think that market should complete target first is the fact that price already stands above previous major extensions. Take a look at daily chart - price stands above 1.27 butterfly extension and 0.618 of major AB-CD. Also Fib level has been broken. That's why more probable action seems target completion first and retracement second.

Conclusion:
Currently we do not want to look too far in the future. Yes, market shows strong bearish action, especially on very long-term charts, drops down indeed look miserable, and from that standpoint GBP could reach even 1.06 target, but right now we're mostly interested in tactical weekly/daily setup.
On short-term charts we continue to follow our upside scenario and now look for next target around 1.3130-1.3150 area. Advantage of our setup is its scale - it is not too large. But, at the same time, we have some additional risk factors as major weekly target has not been hit yet.
The technical portion of Sive's analysis owes a great deal to Joe DiNapoli's methods, and uses a number of Joe's proprietary indicators. Please note that Sive's analysis is his own view of the market and is not endorsed by Joe DiNapoli or any related companies.
(Reuters FX news) - The euro rose against the U.S. dollar on Friday after strong euro zone inflation figures, while the dollar edged higher against the yen after U.S. wages data suggested the Federal Reserve would still hike interest rates two more times this year.
Official flash estimates put euro zone inflation at 1.9 percent in the first quarter, on the verge of crossing over the European Central Bank's target of below but close to 2 percent, and above estimates for a rise of 1.8 percent. According to standard EU measures, in Italy it was 2 percent.
That helped drive the euro as high as $1.0947, just below a 5-1/2-month high of $1.0950 struck earlier in the week.
Analysts said the latest inflation figures could prompt the ECB to take a more hawkish stance in its June statements by either upgrading its assessment of the European economy or suggesting less need for stimulus.
"There was a reminder this morning that maybe inflationary pressures will be coming through and maybe the ECB will have to go away from its super easy policy," said Axel Merk, president and chief investment officer of Palo Alto, California-based Merk Investments.
The dollar rose as much as 0.4 percent against the yen to a session high of 111.71 yen, just below a nearly four-week high of 111.77 touched April 26, after U.S. Labor Department data showed private wages and salaries accelerated 0.9 percent in the first quarter. That marked the largest increase in 10 years.
The data suggested firming inflation and helped boost the dollar even as the Commerce Department said U.S. gross domestic product increased at a 0.7 percent annual rate. That was the weakest performance since the first quarter of 2014.
"The GDP data won’t alter the view that the Fed may raise rates in June and then ultimately again in September," said Omer Esiner, chief market analyst at Commonwealth Foreign Exchange Inc in Washington.
The dollar index .DXY, which measures the greenback against a basket of six major rivals, was slightly lower at 99.015.
The euro was on track to gain 2.3 percent for the month to mark its second straight monthly rise against the dollar, while the dollar was set to end the month little changed against the yen. The dollar index was set to fall about 1.3 percent to mark its second straight monthly drop.
Fathom’s Chart of the Week: Brexit weighs on UK economy
by Fathom Consulting
According to Fathom’s model, which combines monthly production data with information from surveys, UK economic growth slowed to 0.4% in the first quarter of 2017. If correct, this would represent a marked slowdown from the 0.7% recorded in the final quarter of 2016.
Both survey and non-survey indicators point to a deceleration, suggesting that Brexit is beginning to weigh on the economy. The downturn in output over the first two months of this year appears to have been widespread, with some sectors witnessing outright contraction. Indeed, activity in the production and construction sectors fell by 0.9% and 1.8% in the two months to February, respectively. In spite of this, with October’s dip weighing on the fourth quarter average, UK production industries may manage to eke out positive quarterly growth of 0.7% in Q1. Meanwhile, we estimate that private service sector activity, which accounts for 55% of output, expanded by around 0.4% over the first quarter.
For the year as a whole, we forecast real GDP growth of 1.1%, slowing to 0.4% in 2018. This compares unfavourably with most forecasts, which have been revised higher in light of the unexpected resilience of the UK economy post Brexit vote. The divergence between our forecast and the consensus reflects our view that developments through the second half of last year were a case of ‘pain deferred’, rather than ‘pain avoided’. To that end, British Prime Minister Theresa May’s call for a snap general election to strengthen her position before the slowdown materially feeds through makes sense from a timing perspective.
COT Report
Today, guys we will take a look at cable while on EUR we do not see a lot of changes. We think that rally on EUR will hold around elections only but then big difference of Fed and ECB policies will take the lead and EUR will return to downward action to our target around the parity.
Meantime we refresh our GBP view. Those who are followed our weekly researches should remember that we have medium-term bullish setup and minimal targets that we've specified were achieved 2 weeks ago. Scenario that we follow has diversified background, including sentiment. As you can see GBP stands at all-time record of net short position with high level of open interest. It means that everybody keeps short position. When market strongly oversold it just can't go down further. That's why 2-3 weeks ago we said that GBP stands on the edge of big relief rally. And indeed it has started, but it seems that it is not over yet.
Last CFTC data shows that situation has started to change gradually, but changes are too shy yet. Net short position has decreased a bit, while open interest stands at the same record levels. It means that after just closing of shorts - replacement to longs has started. This process still has a signifcant potential by CFTC chart:
At least sentiment analysis tells that rally has not bad chances to be continued...
Technicals
Monthly
Monthly trend has turned bullish finally, but market is not at OBought on monthly chart. Market has completed all-time 0.618 AB=CD target and right shows reasonable upside reaction.
Overall long-term picture still looks bearish by some signs. First is - acceleration down to AB-CD target. Usually fast drop on this point tells that market has chances to continue to AB=CD target, which stands at 1.06 area. Currently it seems too brave suggestion, but at least some minor continuation down is very probable. Once we've mentioned HSBC bank forecast that it suggests to see pound around 1.10 area by the end of 2017. Thus, may be our view is not absolutely crackpot...
The point is if you will take a look at all-time GBP chart, you'll see that market already has broken major 5/8 Fib support and on a way down, drop is really fast since first leg was on 2008 crisis. Overall fundamental situation is mostly supportive to this scenario, besides, 20 points is not really big distance to GBP that is more volatile than many other major currencies. Fundamentally, as we've read above, Fathom consulting also supports idea of further GBP weakness.
But right now we're mostly interested in possible short-term tactical upside bounce. Actually may this is the one that we were waitng since drop to 1.18 as a part of our Volatility Breakout (VOB) trading. Based on VOB scenario, after upside relief downside continuation should follow as residual effect of bearish momentum.
Here we have two factors that in general support idea of possible upside bounce. First is - sentiment analysis as GBP is extremely oversold according to CFTC data, as we've specified above.
Second - on monthly chart we have small W&R of 1.2020 lows. Now we see that it has started to work as price has started upside action and took out previous top. Nearest destination point that will be important for coming week is Yearly Pivot around 1.3130 area:
Weekly
Here situation has changed since our last discussion. As you can see market has completed our bullish grabber pattern as previous tops around 1.27 area were exceeded. Now the reasonable question that we have to ask here - what's next?
On weekly chart we have three important issues. First one is weekly Overbought - price has reached it last week. It means that upside potential of cable will be limited on coming week. Thus, it would be better to not count on reaching some extended targets and focus on YPP @ 1.3130.
Second - we have untouched 1.618 extension of major AB-CD pattern that has started right at the 1.73 top area. Sooner or later but it should be hit. It means that although upside action looks solid by far, but it has a flaw and greater risk than it seems at first glance. Thus, we should be very careful to any bearish patterns that could be formed on daily chart.
Finally, speaking on more extended targets, using of harmonic swing points on 1.3350 area, but definitely it will not be reached on coming week as it stand beyond OB area.
That' being said, weekly combination suggests that we should be ready for retracement either before reaching of YPP or right after it.
Daily
Trend here is also bullish, but market is not at overbought. Daily patterns point approximately at the same 1.3130 area. Last week market has broken through very important and strong resistance area. Take a look - this was hard cluster of targets and levels, including 0,618 AB-CD, 1.27 butterfly, 5/8 Fib resistance (not shown) around 1.2850, and natural support/resistance area that has started in June 2016. Also minor butterly inner AB=CD pattern has been completed.
As a respect on this resistance area market has shown just minor consolidation without solid pullback. This fact shows that market is strong and really could continue upside action.
Still, as we've estimated above - let's focus on 1.3130 target on coming week. This will be Yearly Pivot, Fib level and 1.618 butterfly target. All this stuff will be at weekly Overbought. Combining all issues together, it is logical to suggest that market definitely will have problems to pass through this level immediately. Most probable scenario is completion of targets around 1.3130-1.3140 and then starting of retracement down.
4-hour
Currently guys, 4-hour chart shows clear picture only till 1.30 area. But as our major targets stand around 1.3130-1.3150, it means that market probably will take compound shape of retracement. For example, as 1.30 area will be hit, GBP will show minor pullback, say to MPP @ 1.2750, then there will be another leg up right to 1.3140 area and only after that major retracement will start.
Hardly price will leave untouched targets and start dropping immediately. Besides, weekly overbought is rather flexible range. It let's price to fluctuate on lower time frames inside the week, thus our target still could be reached.
Another reason why we think that market should complete target first is the fact that price already stands above previous major extensions. Take a look at daily chart - price stands above 1.27 butterfly extension and 0.618 of major AB-CD. Also Fib level has been broken. That's why more probable action seems target completion first and retracement second.
Conclusion:
Currently we do not want to look too far in the future. Yes, market shows strong bearish action, especially on very long-term charts, drops down indeed look miserable, and from that standpoint GBP could reach even 1.06 target, but right now we're mostly interested in tactical weekly/daily setup.
On short-term charts we continue to follow our upside scenario and now look for next target around 1.3130-1.3150 area. Advantage of our setup is its scale - it is not too large. But, at the same time, we have some additional risk factors as major weekly target has not been hit yet.
The technical portion of Sive's analysis owes a great deal to Joe DiNapoli's methods, and uses a number of Joe's proprietary indicators. Please note that Sive's analysis is his own view of the market and is not endorsed by Joe DiNapoli or any related companies.
")