Sive Morten
Special Consultant to the FPA
- Messages
- 18,664
Fundamentals
(Reuters) Sterling plunged on Friday after what traders called a "flash crash" knocked the currency to a 31-year low, while the dollar slipped on news of unexpectedly weak U.S. jobs growth in September.
Even before a sudden plunge that briefly shaved off a tenth of the pound's value during Asian trading, sterling was headed for its worst week since January 2009 as some national leaders called for Britain to make a "hard" exit from the European Union.
"I think it’s a warning shot from the markets to the UK about what type of potential volatility in sterling we may see down the line," said Shahab Jalinoos, global head of FX strategy at Credit Suisse in New York.
With the focus on sterling, the U.S. non-farm payrolls report took something of a back seat. At 156,000 new U.S. jobs for the month of September, the headline number was softer than the market forecast, but strong enough to keep the Federal Reserve on track to raise rates in December.
On Friday, the pound plunged about 10 percent from levels around $1.2600 to $1.1378 in a matter of minutes in thin early Asian trading.
Thomson Reuters later revised that low to $1.1491, which was still the weakest level for sterling since 1985. The company, which owns the Reuters foreign exchange brokerage platform RTSL, said an outlying trade had been canceled.
In late trading, sterling recouped some of its losses to trade at $1.2442, still down 1.5 percent on the day.
The pound pared earlier losses as other currencies strengthened against the dollar in reaction to data showing U.S. nonfarm payrolls rising 156,000 in September, below the 175,000 increase forecast among analysts polled by Reuters.
"Although the initial reading of the September employment market was lower than estimates..., it is likely in the sweet spot for FOMC (Federal Open Market Committee) hawks that would like to get a second rate hike in before year-end," said Marvin Loh, senior global markets strategist, at BNY Mellon in Boston.
"Other internals of the current report are also supportive for the case of a December hike."
In late trading, the dollar index .DXY was down 0.3 percent at 96.501. It rose to a more than two-month high shortly before the release of the payrolls report.
The greenback fell sharply against the yen, down 1 percent at 102.91 yen.
The euro rose 0.4 percent to $1.1198 but fell 0.6 percent against the Japanese currency to 115.26 yen.
Encouraging aspects of the September payrolls report, which showed a higher participation rate and steady 0.2 percent rise in wages, limited the dollar's loss and supported market expectations for a Fed hike at its Dec. 13-14 policy meeting.
Fathom consulting also tells that overall US data stands in trend to more agressive rate policy. Although they have missed expectation a bit on NFP release, but their comments on ISM Manufacturing are interesting:
ISM report suggests US service sector in good shape

The very strong figures in today's ISM Non-Manufacturing survey for September suggest that the shockingly weak report in August was probably just an aberration.
Although both the ISM Non-Manufacturing composite and Business Activity indices have been poor predictors of US GDP growth since 2009, the much-improved figures for September will give the FOMC more confidence to raise US interest rates this year.
The Business Activity Index jumped 8.5 points to 60.3, more than reversing the decline last month. It hit an eleven-month high, as did the composite index and the index for employment.
Looking ahead, we expect Friday's nonfarm payrolls report to show that 180,000 net new jobs were added last month and that average hourly earnings rose by 0.3% - missed an expectation")
US jobs report consistent with December rate hike
Although the unemployment rate edged up from 4.9% to 5.0%, and net jobs growth was a slightly-lower-than expected 156,000, today's US jobs report provided more evidence that the labour market continues to tighten.
The labour force rose 444,000, which pushed the participation rate up to a six-month high of 62.9%. Average hourly earnings climbed 0.2% in the month and the annual rate edged up from 2.4% to 2.6%.
Notwithstanding today's rise in the labour force, we suspect that there is little slack left in the US labour market and that higher wages will strengthen the case for tighter monetary policy later this year and into 2017.
A range of other labour market indicators, such as the NFIB Single Most Important Problem, Cost of Labour Index, also point to accelerating wage growth.
Today's US nonfarm payrolls report for September may not be enough to convince the FOMC to raise rates when it meets next month, but a rate hike is still on the cards in December.
That's being said, following this logic, negative dollar reaction on Friday across the board should not become a stable tendency and mostly should be short-term. That's why based on fundamental data and comments it is difficult to count on any uptrend on dollar-related currencies, EUR, GBP etc...
COT Report
CFTC data in general shows moderately bearish sentiment. Net speculative position stands short, but not at extreme levels. Within last 3 weeks open interest is growing. But if 2 weeks ago open interest has grown on new long positions, last week - it was grown even stronger but on new shorts that overcome even those longs that were opened 2 weeks ago. Currently COT report doesn't bring any strong tendency and doesn't let us to use it in trading directly, but it suggests that uspide reaction has no real chances on strong continuation. Still this data stands on Tue, we will see what will happen on next week when it will include position changes after NFP release:

Technical
Monthly
Despite strong interweek volatility, close price has not changed significantly. Thus, major picture that we see on the monthly chart is the same - important bearish reversal candle and flag-shaped consolidation within last 3-4 months. This combination doesn't look really bullish for EUR here.
Currently EUR stands at rather strong support area. This is lower border of downward channel and all-time 5/8 Fib support. Here EUR has formed Butterfly "buy" and it has reached first 1.27 extension here. Probably it needs some time to pass through this level and supportive fundamental background of US strength.
EUR is forming typical reversal candle in May. Price has moved above April top and closed below April's lows. It could not get extended continuation, but usually market shows downward continuation within next 1-3 candles.
Sometimes reversal candles lead to collapse, as it was on EUR around 1.40 area. Thrust down has started particularly by reversal candle in March 2014.
Speaking on big scale bearish signs, we have these ones:
EUR was not able to reach YPR1 and returned right back down to YPP. Following this logic next destination could be YPS1 right around parity and 1.618 butterfly target. This is just another destination point that we have here.
Appearing of reversal candle brings nothing good to bulls. Currently we can't precisely forecast the consequences of its appearing, but even minor results will bring some months of downward action inside current 1.04 -1.15 consolidation... Although potential bearish impact could be even stronger.
Finally we have another bearish sign that looks like bearish dynamic pressure. Take a look that although trend holds bullish - market shows inablitity to move up, even from strong support area. Next strong support stands precisely at parity and will become a culmination of downward action, since this level includes support line, YPS1 and butterfly 1.618 target. Brexit results hardly will bring prosperity to EU and probably will become another bearish driving factor for EUR. We aleardy see consequences of Brexit on GBP, so, some negative impact on EUR also will happen, this is just a question of time.
Finally expectation of rate hike in US in Dec and continuation in 2017 will make additional pressure on EUR/USD rate in medium-term perspective.
Also take a look at different behavior near low border of channel. Previously when market has touched it - it shows immediate upside pullback, it was V-shape reversal. Right now behavior is absolutely different, price just hangs on the border and shows no upside action. Any tight consolidation near trendline could become a sign of coming breakout.
Thus, based on monthly chart we could make two major conclusions. First is - real bullish trend will be re-established only when EUR will erase reversal candle and overcome its top above 1.16. Second, if EUR will still keep moderate bearish sentiment, downside potential hardly will be lower than parity, due recent Fed dovish adjustments to its policy for 2017-2018.

Weekly
Last month situation here was mostly "indecision", as market was keeping valid as bullish patterns as some bearish signs that now still exist here. Previously we've talked about it a lot and now I just briefly recall them.
Thus, major support around 1.09 area has not been broken down and this keeps door open for bullish patterns. For example - weekly "222" Buy pattern with 1.16 target.
From the other side, EUR consequently has broken two sloped trend lines. As first line was re-tested after breakout, as second one also has been re-tested 4 weeks ago. In last 4-6 weeks EUR forms something that reminds bearish dynamic pressure on weekly chart. Trend stands bullish, but price action is not.
Besides overall action from 1.09 low doesn't look like thrust and re-establishing of upside trend. It mostly reminds reaction or respect of some strong support area. From perspectives of AB-CD pattern, this action is too heavy, since EUR even has not reached minor 0.618 extension.
If we suggest that market has formed Double bottom pattern here - current action is also irrational, as EUR has pulled back from neckline and now couldn't return right back up to it.
That's being said, EUR has formed a lot of different hints on patterns in both sides, but all action mostly stands in sideway direction and price doesn't show any meaningful progress neither upside nor downside.
Last week EUR has done two opposite things. First, in the beginning of the week as drop has started it has erased weekly grabber and some daily bullish patterns. But on Friday, as we've got a bit worse NFP data it has replaced old grabber by new one. As a result weekly chart remains at the same situation as it was last week. This new pattern again suggests at least 1.1365 top breakout. Invalidation point is the same, our favorite 1.1130 level.
Appearing of this pattern obliges us to not go short, until grabber is valid. Also we have formal reasons even to go long, although I do not like this kind of grabbers, that stand in opposite direction to previous action.
That's being said, on first weekly chart you see the same pattern and it is still valid, since price hasn't dropped below it's low.

But since we've discussed some flaws in so-called "bullish scenario" as well - on next chart I will show you, what could happen, if EUR will drop below 1.11 area and then below 1.09:
Here is one of possible scenarios:

So, as you can see current choice of direction will make impact on long-term perspective and currently EUR stands precisely at red line between them keeping valid patterns for both directions by far. But this will not last forever, especially as we will come closer to Fed December meeting and end of financial year.
To be honest guys, my choice is a bearish view on EUR. And I do not believe in perspectives of new weekly grabber. Because bullish market should behave differently. What we see right now is something different.
That's why my personal choice do not trade EUR on long side, but at the same time wait when bearish road will become clear - we should not have valid bullish patterns if we intend to go short. That's why only real breakout of 1.11 area will make possible short entry.
Daily
Although EUR was rather active last week, this activity was not able to bring clarity on medium-term perspective. Yes, price has erased short-term patterns as daily bullish grabbers, that were formed last week, potential upside butterfly. Still, as EUR wasn't able to show real 1.11 breakout - it keeps valid H&S pattern and "222" Buy.
Friday action shows two important moments - price was able to hold above MPS1. And this moment doesn't let us to speak about new bear trend. Second - it seems that we've got W&R here.
On daily chart most important pattern is triangle. So on Friday EUR has shown failure breakout, taking out former lows and returned right back up, inside the pattern. It even almost has formed upside reversal candle, since it shows new lows but just missed few pips to close above Thu candle.
Although trend is still bearish here, market was not at oversold during Fri drop, but short-term sentiment has turned bullish and EUR could make an attempt to show some upside continuation during 1-2 days on next week.
We do not call to trade EUR on long side of the market, at least on daily chart. Actually, on daily we have no trading setup, until major levels stand intact, mostly I'm speaking about 1.11-1.1130. That's why daily analysis
and facts that we've put above suggest that upside reaction should not be extended and keep moderately bearish view on EUR.

4-hour
Our Friday analysis was simultaneously right and wrong. Right - because market indeed has shown upside reaction from an area WPS1 and inner trendline that we've discussed. Wrong - is because reaction was too strong and it was not a retracement that we've intended to get for short entry. As a result no patterns have been formed that could let us to go short. B&B that we've discussed also was not formed.
Currently for scalp trading here only recent swing is suitable. We have some bullish divergence with MACD, upside reversal was very fast and strong. That's why EUR could show some minor upside continuation, say, 0.618 target of small AB-CD pattern that could bring it back to upper border of triangle. If you still plan to trade EUR long, don't count on some more extended targets.
Also I have to repeat here that trading EUR long stands beyond of our daily trading plan. That's why we provide here some assitance with marking levels etc., but we do not call you to buy EUR.

Please read conclusion carefully to avoid any misapprehension.
Conclusion:
Our long-term view mostly bearish for EUR, based on action that it shows around major support and due anticipation of more agressive Fed policy. Bearish view will be valid until market will stand below 1.16 top.
In shorter -term perspective our conclusion stands as follows:
- Upside reaction on poor NFP data probably will be short-term, but could continue on Mon-Tue.
- We do not call to Buy EUR and personally I will not trade it long but intraday long position is possible, if you satisfy with background - bullish weekly grabber, and short-term upside momentum. Use very close targets, such as intraday 0.618 AB-CD etc.
- do not take shorts, until market holds above 1.11-1.1130 lows;
In general guys, although we have multiple patterns here, but all of them are rather weak, mostly because they are not preceded by strong directional price action. Such patterns are always weaker.
The technical portion of Sive's analysis owes a great deal to Joe DiNapoli's methods, and uses a number of Joe's proprietary indicators. Please note that Sive's analysis is his own view of the market and is not endorsed by Joe DiNapoli or any related companies.
(Reuters) Sterling plunged on Friday after what traders called a "flash crash" knocked the currency to a 31-year low, while the dollar slipped on news of unexpectedly weak U.S. jobs growth in September.
Even before a sudden plunge that briefly shaved off a tenth of the pound's value during Asian trading, sterling was headed for its worst week since January 2009 as some national leaders called for Britain to make a "hard" exit from the European Union.
"I think it’s a warning shot from the markets to the UK about what type of potential volatility in sterling we may see down the line," said Shahab Jalinoos, global head of FX strategy at Credit Suisse in New York.
With the focus on sterling, the U.S. non-farm payrolls report took something of a back seat. At 156,000 new U.S. jobs for the month of September, the headline number was softer than the market forecast, but strong enough to keep the Federal Reserve on track to raise rates in December.
On Friday, the pound plunged about 10 percent from levels around $1.2600 to $1.1378 in a matter of minutes in thin early Asian trading.
Thomson Reuters later revised that low to $1.1491, which was still the weakest level for sterling since 1985. The company, which owns the Reuters foreign exchange brokerage platform RTSL, said an outlying trade had been canceled.
In late trading, sterling recouped some of its losses to trade at $1.2442, still down 1.5 percent on the day.
The pound pared earlier losses as other currencies strengthened against the dollar in reaction to data showing U.S. nonfarm payrolls rising 156,000 in September, below the 175,000 increase forecast among analysts polled by Reuters.
"Although the initial reading of the September employment market was lower than estimates..., it is likely in the sweet spot for FOMC (Federal Open Market Committee) hawks that would like to get a second rate hike in before year-end," said Marvin Loh, senior global markets strategist, at BNY Mellon in Boston.
"Other internals of the current report are also supportive for the case of a December hike."
In late trading, the dollar index .DXY was down 0.3 percent at 96.501. It rose to a more than two-month high shortly before the release of the payrolls report.
The greenback fell sharply against the yen, down 1 percent at 102.91 yen.
The euro rose 0.4 percent to $1.1198 but fell 0.6 percent against the Japanese currency to 115.26 yen.
Encouraging aspects of the September payrolls report, which showed a higher participation rate and steady 0.2 percent rise in wages, limited the dollar's loss and supported market expectations for a Fed hike at its Dec. 13-14 policy meeting.
Fathom consulting also tells that overall US data stands in trend to more agressive rate policy. Although they have missed expectation a bit on NFP release, but their comments on ISM Manufacturing are interesting:
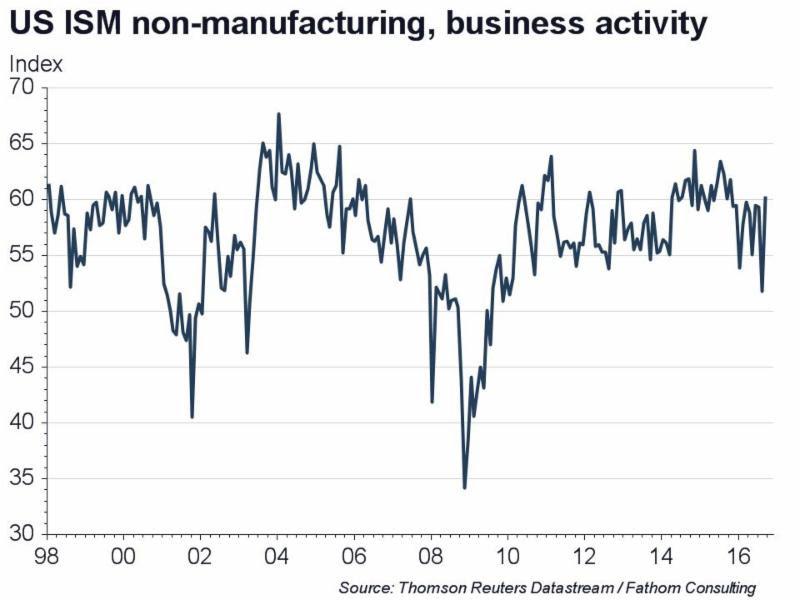
ISM report suggests US service sector in good shape
The very strong figures in today's ISM Non-Manufacturing survey for September suggest that the shockingly weak report in August was probably just an aberration.
Although both the ISM Non-Manufacturing composite and Business Activity indices have been poor predictors of US GDP growth since 2009, the much-improved figures for September will give the FOMC more confidence to raise US interest rates this year.
The Business Activity Index jumped 8.5 points to 60.3, more than reversing the decline last month. It hit an eleven-month high, as did the composite index and the index for employment.
Looking ahead, we expect Friday's nonfarm payrolls report to show that 180,000 net new jobs were added last month and that average hourly earnings rose by 0.3% - missed an expectation
US jobs report consistent with December rate hike
Although the unemployment rate edged up from 4.9% to 5.0%, and net jobs growth was a slightly-lower-than expected 156,000, today's US jobs report provided more evidence that the labour market continues to tighten.
The labour force rose 444,000, which pushed the participation rate up to a six-month high of 62.9%. Average hourly earnings climbed 0.2% in the month and the annual rate edged up from 2.4% to 2.6%.
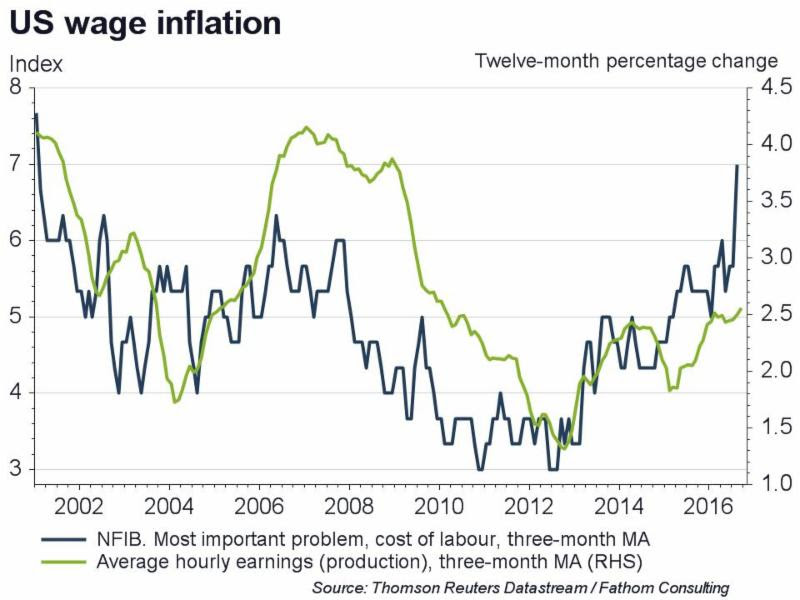
Notwithstanding today's rise in the labour force, we suspect that there is little slack left in the US labour market and that higher wages will strengthen the case for tighter monetary policy later this year and into 2017.
A range of other labour market indicators, such as the NFIB Single Most Important Problem, Cost of Labour Index, also point to accelerating wage growth.
Today's US nonfarm payrolls report for September may not be enough to convince the FOMC to raise rates when it meets next month, but a rate hike is still on the cards in December.
That's being said, following this logic, negative dollar reaction on Friday across the board should not become a stable tendency and mostly should be short-term. That's why based on fundamental data and comments it is difficult to count on any uptrend on dollar-related currencies, EUR, GBP etc...
COT Report
CFTC data in general shows moderately bearish sentiment. Net speculative position stands short, but not at extreme levels. Within last 3 weeks open interest is growing. But if 2 weeks ago open interest has grown on new long positions, last week - it was grown even stronger but on new shorts that overcome even those longs that were opened 2 weeks ago. Currently COT report doesn't bring any strong tendency and doesn't let us to use it in trading directly, but it suggests that uspide reaction has no real chances on strong continuation. Still this data stands on Tue, we will see what will happen on next week when it will include position changes after NFP release:
Technical
Monthly
Despite strong interweek volatility, close price has not changed significantly. Thus, major picture that we see on the monthly chart is the same - important bearish reversal candle and flag-shaped consolidation within last 3-4 months. This combination doesn't look really bullish for EUR here.
Currently EUR stands at rather strong support area. This is lower border of downward channel and all-time 5/8 Fib support. Here EUR has formed Butterfly "buy" and it has reached first 1.27 extension here. Probably it needs some time to pass through this level and supportive fundamental background of US strength.
EUR is forming typical reversal candle in May. Price has moved above April top and closed below April's lows. It could not get extended continuation, but usually market shows downward continuation within next 1-3 candles.
Sometimes reversal candles lead to collapse, as it was on EUR around 1.40 area. Thrust down has started particularly by reversal candle in March 2014.
Speaking on big scale bearish signs, we have these ones:
EUR was not able to reach YPR1 and returned right back down to YPP. Following this logic next destination could be YPS1 right around parity and 1.618 butterfly target. This is just another destination point that we have here.
Appearing of reversal candle brings nothing good to bulls. Currently we can't precisely forecast the consequences of its appearing, but even minor results will bring some months of downward action inside current 1.04 -1.15 consolidation... Although potential bearish impact could be even stronger.
Finally we have another bearish sign that looks like bearish dynamic pressure. Take a look that although trend holds bullish - market shows inablitity to move up, even from strong support area. Next strong support stands precisely at parity and will become a culmination of downward action, since this level includes support line, YPS1 and butterfly 1.618 target. Brexit results hardly will bring prosperity to EU and probably will become another bearish driving factor for EUR. We aleardy see consequences of Brexit on GBP, so, some negative impact on EUR also will happen, this is just a question of time.
Finally expectation of rate hike in US in Dec and continuation in 2017 will make additional pressure on EUR/USD rate in medium-term perspective.
Also take a look at different behavior near low border of channel. Previously when market has touched it - it shows immediate upside pullback, it was V-shape reversal. Right now behavior is absolutely different, price just hangs on the border and shows no upside action. Any tight consolidation near trendline could become a sign of coming breakout.
Thus, based on monthly chart we could make two major conclusions. First is - real bullish trend will be re-established only when EUR will erase reversal candle and overcome its top above 1.16. Second, if EUR will still keep moderate bearish sentiment, downside potential hardly will be lower than parity, due recent Fed dovish adjustments to its policy for 2017-2018.
Weekly
Last month situation here was mostly "indecision", as market was keeping valid as bullish patterns as some bearish signs that now still exist here. Previously we've talked about it a lot and now I just briefly recall them.
Thus, major support around 1.09 area has not been broken down and this keeps door open for bullish patterns. For example - weekly "222" Buy pattern with 1.16 target.
From the other side, EUR consequently has broken two sloped trend lines. As first line was re-tested after breakout, as second one also has been re-tested 4 weeks ago. In last 4-6 weeks EUR forms something that reminds bearish dynamic pressure on weekly chart. Trend stands bullish, but price action is not.
Besides overall action from 1.09 low doesn't look like thrust and re-establishing of upside trend. It mostly reminds reaction or respect of some strong support area. From perspectives of AB-CD pattern, this action is too heavy, since EUR even has not reached minor 0.618 extension.
If we suggest that market has formed Double bottom pattern here - current action is also irrational, as EUR has pulled back from neckline and now couldn't return right back up to it.
That's being said, EUR has formed a lot of different hints on patterns in both sides, but all action mostly stands in sideway direction and price doesn't show any meaningful progress neither upside nor downside.
Last week EUR has done two opposite things. First, in the beginning of the week as drop has started it has erased weekly grabber and some daily bullish patterns. But on Friday, as we've got a bit worse NFP data it has replaced old grabber by new one. As a result weekly chart remains at the same situation as it was last week. This new pattern again suggests at least 1.1365 top breakout. Invalidation point is the same, our favorite 1.1130 level.
Appearing of this pattern obliges us to not go short, until grabber is valid. Also we have formal reasons even to go long, although I do not like this kind of grabbers, that stand in opposite direction to previous action.
That's being said, on first weekly chart you see the same pattern and it is still valid, since price hasn't dropped below it's low.
But since we've discussed some flaws in so-called "bullish scenario" as well - on next chart I will show you, what could happen, if EUR will drop below 1.11 area and then below 1.09:
Here is one of possible scenarios:
So, as you can see current choice of direction will make impact on long-term perspective and currently EUR stands precisely at red line between them keeping valid patterns for both directions by far. But this will not last forever, especially as we will come closer to Fed December meeting and end of financial year.
To be honest guys, my choice is a bearish view on EUR. And I do not believe in perspectives of new weekly grabber. Because bullish market should behave differently. What we see right now is something different.
That's why my personal choice do not trade EUR on long side, but at the same time wait when bearish road will become clear - we should not have valid bullish patterns if we intend to go short. That's why only real breakout of 1.11 area will make possible short entry.
Daily
Although EUR was rather active last week, this activity was not able to bring clarity on medium-term perspective. Yes, price has erased short-term patterns as daily bullish grabbers, that were formed last week, potential upside butterfly. Still, as EUR wasn't able to show real 1.11 breakout - it keeps valid H&S pattern and "222" Buy.
Friday action shows two important moments - price was able to hold above MPS1. And this moment doesn't let us to speak about new bear trend. Second - it seems that we've got W&R here.
On daily chart most important pattern is triangle. So on Friday EUR has shown failure breakout, taking out former lows and returned right back up, inside the pattern. It even almost has formed upside reversal candle, since it shows new lows but just missed few pips to close above Thu candle.
Although trend is still bearish here, market was not at oversold during Fri drop, but short-term sentiment has turned bullish and EUR could make an attempt to show some upside continuation during 1-2 days on next week.
We do not call to trade EUR on long side of the market, at least on daily chart. Actually, on daily we have no trading setup, until major levels stand intact, mostly I'm speaking about 1.11-1.1130. That's why daily analysis
and facts that we've put above suggest that upside reaction should not be extended and keep moderately bearish view on EUR.
4-hour
Our Friday analysis was simultaneously right and wrong. Right - because market indeed has shown upside reaction from an area WPS1 and inner trendline that we've discussed. Wrong - is because reaction was too strong and it was not a retracement that we've intended to get for short entry. As a result no patterns have been formed that could let us to go short. B&B that we've discussed also was not formed.
Currently for scalp trading here only recent swing is suitable. We have some bullish divergence with MACD, upside reversal was very fast and strong. That's why EUR could show some minor upside continuation, say, 0.618 target of small AB-CD pattern that could bring it back to upper border of triangle. If you still plan to trade EUR long, don't count on some more extended targets.
Also I have to repeat here that trading EUR long stands beyond of our daily trading plan. That's why we provide here some assitance with marking levels etc., but we do not call you to buy EUR.
Please read conclusion carefully to avoid any misapprehension.
Conclusion:
Our long-term view mostly bearish for EUR, based on action that it shows around major support and due anticipation of more agressive Fed policy. Bearish view will be valid until market will stand below 1.16 top.
In shorter -term perspective our conclusion stands as follows:
- Upside reaction on poor NFP data probably will be short-term, but could continue on Mon-Tue.
- We do not call to Buy EUR and personally I will not trade it long but intraday long position is possible, if you satisfy with background - bullish weekly grabber, and short-term upside momentum. Use very close targets, such as intraday 0.618 AB-CD etc.
- do not take shorts, until market holds above 1.11-1.1130 lows;
In general guys, although we have multiple patterns here, but all of them are rather weak, mostly because they are not preceded by strong directional price action. Such patterns are always weaker.
The technical portion of Sive's analysis owes a great deal to Joe DiNapoli's methods, and uses a number of Joe's proprietary indicators. Please note that Sive's analysis is his own view of the market and is not endorsed by Joe DiNapoli or any related companies.