WaveRider - Back to Basics - S/R, Price Action, MM, Smart Exits, One Indicator, and patience...

A winner and little predictions

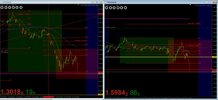
Here is a triple bottom on USDCAD turning into a quadruple bottom or it will bust out. I think it will break lower. Got the bounce off this trend line for about 25 pips. Will watch for a break on the daily or 4h or will sell again off the trend line.
failure swing high.png

This is the EURGBP failing to make a new high. Will look for a break down out of this chop.
quadruple bottom.png

Yesterday saw some crazy whipping around on the EURUSD. Glad I was out.

Very curious about NFP tomorrow and where it will go...
 
Waverider, a little explanation about Craig system:

The horizontal line with the value of 1.2326 in the first chart of the tutorial, does it signify shift in market sentiment as sma 20 moved across it and cross down again? In essence it is the beginning of the move for sma crossing?

Is the arrow firing on your indicator related to this phenomenon?

Does it means that if the particular sma crosses the line back the third time that market sentiment has changed and trade should be exited?

Pls share your thoughts.
 
Hi ayoayo,
I never noticed that line. I'm not sure what it does or what it means. It is possible it is just a line he snapped as a support or resistance for himself and it doesn't mean anything for his system. Or maybe it's the key to the whole thing. And sorry, I haven't had a chance to investigate that indicator. I'm thinking the key to his system is possibly going to the higher TF's, seeing how the MA's and price behave, then applying that to the lower TF's. The reason he created his indicator was because he saw the market behaving a certain predictable way while watching these different TF's and he thought it would be helpful to have an indi clue him in faster. I think that means we should also be able to observe that consistent market bahavior and possibly get an indicator that does similar but if not we still have the basic function of the MA's. Nice to see you sticking with it. I would guess some back testing and forward testing are needed to answer these questions. I think even if he told us, we'd still have to sit at the charts and see it for ourselves.
.
His system is really unusual because he will buy or sell counter trend to get maximum pips. Probably most scalpers take a very sure 5-10 pips for the whole session but he will get all the thrusts, all the retracements and trade multiple pairs to get his 200 pips in a trading day. He also is there for Japan opening bid and Sunday's open and trades the gaps. He lives at the computer eating pips for breakfast lunch and dinner and his indicator facilitates that. If the MA's themselves could net a consitent 30 pips per day, that would still be a very succcessful system.
 
hello waverider.
interesting name. maybe you are inspirational by elliot's wave theorie?
do you know dr. alexander elder? he write about something near of your three MA's.
regards from germany
 
Hi Kool. No my name is because I surf, when I can get into the ocean. Hopefully I'm surfing charts too. Thanks for the tip. I'll look him up.
 
GBPUSD looks like it will tank.

NY has been dropping this pair for the last few trading days. Asia has been trying to prop it up but can't get past the WPP. Another little up in asia's last session the WPP but it was weak. NY dropped again and it's sitting at the edge of a cliff with several hundred pips below.

Will wait for Asia to retace NY drop by 70%, at 1.6031 then sell. Will leave a pending order in over night and hope it takes. If not, it's okay. SL is above the WPP which has held pretty reliably for weeks. I'll close 1/3 position at 30 pips, move stop to BE, close 1/3 again at the cliff's edge and leave the last position open hopping for the big drop. This is a live trade. Risk is about 1% acct val. There is no British or US news to stop me out all week.
 

Attachments

  • Cable 10-22-12.jpg
    Cable 10-22-12.jpg
    121.1 KB · Views: 6
I changed my screen. Something I learned from Brian Craig is the importance of understanding the market sessions. I think I knew but I guess I really know now? New screeen indicates an old school trend in the top left. Got that from Hector Trading's website. Another indicator added is called Seesions. It tells me the different trading sessions in a visually appealing manner. This is important because Asia trades asian currencies and NY doesn't. I can see right away if I'm trading a ranging market or a moving one based on which session I'm in. You can see where to the market movers are sending the price too.
 
Stops to BE

I'm short both the Fiber and the Cable. Cable had a lot of obvious down pressure. Both sets of stops are at break even and I took a little profit from the GBP position already. I think the Cable will really tank today. Hopefully it comes back up and I can renter.
 

Attachments

  • This morning.jpg
    This morning.jpg
    116.1 KB · Views: 7
Closed the rest of the Fiber at +35. Will wait for pull back to reenter. Part of me says I should have left it in and part says take your profit and go. I'm positive for the day and the Cable is still in.
 
Back
Top