Elliot Wave Theory in Forex Trading

The Elliot wave theory was developed by an experienced accountant named Ralph Nelson Elliot in the 1930s. After digging through decades of financial data, he discovered that the markets, which were thought to move in a disordered and unpredictable manner, actually didn’t.
According to him, the financial markets move in repetitive cycles, which are largely influenced by the collective psychology of traders. Elliot called the upward and downward swings, which yield the repetitive patterns, “waves”.
Elliot advanced the idea that if traders can properly identify these repetitive patterns, then they can profitably forecast the subsequent market direction.
This is what makes the Elliot wave theory interesting to many forex traders.
Advantages and disadvantages
The key objective of any trading strategy is to assist traders in correctly identifying possible market turning places, either highs for placing short orders or lows for placing long orders.
The main advantage of the Elliot wave theory is that it plays a critical role in assisting traders discover potential market reversal points.
If you can determine where a currency pair is likely to form a top or bottom, then placing profitable buy or sell orders will be much easier.
By correctly determining the repeating cycles in the prices of currency pairs, you can confidently forecast their next direction, and gather profits along the way.
On the other hand, a main disadvantage of the Elliot wave theory is that it tends to be very subjective, something that makes pinpointing the start and end of the repetitive patterns difficult.
However, with some practice and commitment, you can improve your skills at identifying these patterns. Remember, “Nothing good comes easy”.
Explaining the Elliot wave theory
The Elliot wave theory holds that the market will move in what is referred to as a five and three-wave pattern in any trading timeframe.
Broadly speaking, the 8-wave pattern can be divided into two sections:
- The impulse period
- The corrective period
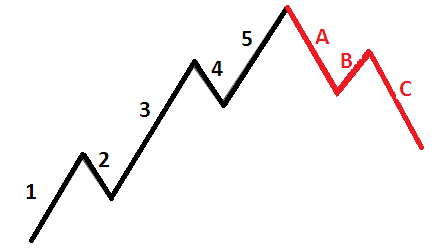
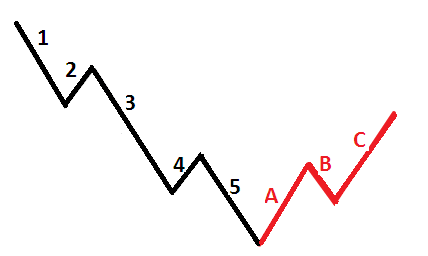
The initial five-wave period (impulse period) forms the main market trend whereas the second three-wave period (corrective period) forms a counter-trend.
In a bullish market, the Elliot waves would look like the following:
In a bearish market, the Elliot waves would look like the following:
An important aspect of Elliot waves is that the repetitive patterns are fractals. In other words, every bigger wave is composed of smaller sub-waves.
As such, every impulse wave can be divided into five smaller waves and every corrective wave can be divided into three smaller sections of a counter-trend move. Nonetheless, it’s usually not very important to label every single section of the wave on all time frames.
a) The impulse period
The impulse period consists of five waves—where wave 1, 3, and 5 move in the direction of the overall trend and wave 2 and 4 are corrective waves. These two retracing waves in the impulse period are not the same as the waves in the corrective phase, which are identified by the letters A, B, and C.
Here are how the waves in the impulse period could be formed during an uptrend:
- Wave 1: The price of the currency pair starts to rise because of some buying behavior.
- Wave 2: Some buyers start to take profits, leading to a slight drop in price.
- Wave 3: More traders notice the currency pair and decide to place buy orders, leading to an increase in price. According to the Elliot wave theory, this wave is normally the strongest of all the impulse, which also makes it to be higher than the peak of Wave 1.
- Wave 4: Once more, some traders take profits, leading to a slight drop in price (even though others are still placing buy orders). According to the theory, this is normally the weakest of the other waves.
- Wave 5: At this stage, the currency pair has received a lot of attention, and even more traders place buy orders, which makes it to be overpriced. Consequently, sellers enter the market, leading to a reversal of the trend and a start the corrective period.
Three rules and guidelines of Elliot waves
You might be contemplating: “How can I be sure that an actual Elliot wave pattern has formed?”. If you are doubting, here are the three main rules to look for in the impulse period:
- First rule: Wave 2 should never retrace by over 100% of wave 1.
- Second rule: The length of wave 3 should never be the shortest of the three impulse waves (they are 1, 3, and 5).
- Third rule: Speaking in terms of price, wave 4 should never enter the region of wave 1. This rule may only fail to apply when a diagonal triangle occurs, which is a very rare occurrence.
In most cases, wave 2 and wave 4 tend to make alternate patterns. For instance, if wave 2 moves sharply, then wave 4 can just make some mild movements. Wave 4 can also make sharp moves while wave 2 makes mild ones.
a) The corrective period
The corrective period entails market movements that are contrary to the impulse period. The corrective patterns tend to be smaller in terms of price change and require more time before developing. As such, most traders prefer trading the impulse patterns as opposed to the corrective patterns.
If the overall market trend is bullish, then a bearish correction will be seen, and vice versa. Letters A, B, and C are utilized, rather than numbers, to identify the corrective waves.
There are three major types of wave patterns in the corrective period.
- Zig Zags
- Flats
- Triangles
i) Zig Zag pattern
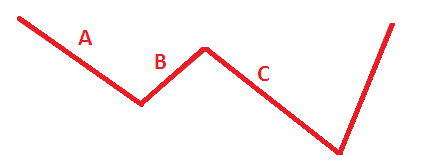
The zig zag correction pattern is normally the simplest and the easiest wave sequence to identify. It represents quick price movements that are contrary to the main market trend.
Here is an example of a zig zag wave pattern in a bullish market (you can just invert the pattern in a bearish market).
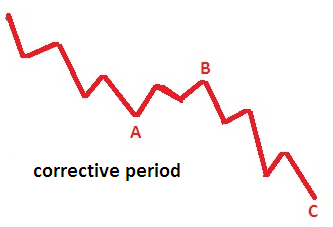
As you can see above, wave B is normally the shortest in the pattern. The zig zag waves usually follow the 5/3/5 model. In such a case, wave A can be made up of 5 sub-waves, wave B can be made up of 3 corrective waves, and wave C can be made up of 5 sub-waves.
Here is a diagram that illustrates the sub-divisions of the zig zag pattern.
ii) The flat formation pattern
In the flat pattern, the corrective waves appear sideways. In most cases, these waves have about the same lengths.
Typically, wave B makes a reversed move to that of wave A, while wave C makes a reversed move to that of wave B.
iii) The triangle formation pattern
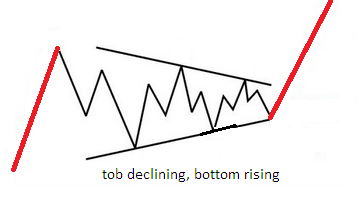
In this pattern, the corrective waves are sandwiched by two trendlines, leading to the formation of a “triangle”.
Depending on the price action, the trendlines can either be converging or diverging. Usually, triangles are constituted by 5 waves that travel against the trend in a sideways fashion.
There are different types of triangles, including:
- Descending—in a bullish market, the top is declining while the bottom is flat.
- Ascending—in a bullish market, the top is flat while the bottom is rising.
- Contracting or symmetrical—in a bullish market, the top is declining while the bottom is rising.
- Expanding or reverse symmetrical—in a bullish market, the top is rising while the bottom is declining.
Here is an example of a symmetrical triangle formation in a bullish market.
How to trade forex using Elliot waves
The forex market is usually not symmetrical, and it can be difficult to determine if an Elliot wave has been formed. Therefore, the Elliot wave principle can be combined with other strategies to improve the identification of profitable trading opportunities.
If other indicators are incorporated, making analysis becomes easier. Some of the strategies and indicators that can be used include support and resistance levels, Fibonacci indicator, Stochastic indicator, RSI indicator, and moving averages.
Here, we are going to talk about how the Fibonacci tool can be used together with the Elliot wave theory to increase the chances of success.
Fibonacci is a popular indicator used to identify market retracement levels. It is available on the MetaTrader platform. If you stretch the tool between a low and high point on a chart, it will mark the likely retracement levels for your chosen currency pair.
The most commonly used Fibonacci retracement levels are:
00.0%, 23.6%, 38.2%, 50.0%, 61.8%, 100.0%, and 161.8%.
When using the Elliot wave principle for trading, the Fibonacci levels can assist you to identify the tops or bottoms of smaller waves, and even the bigger impulsive and corrective waves.
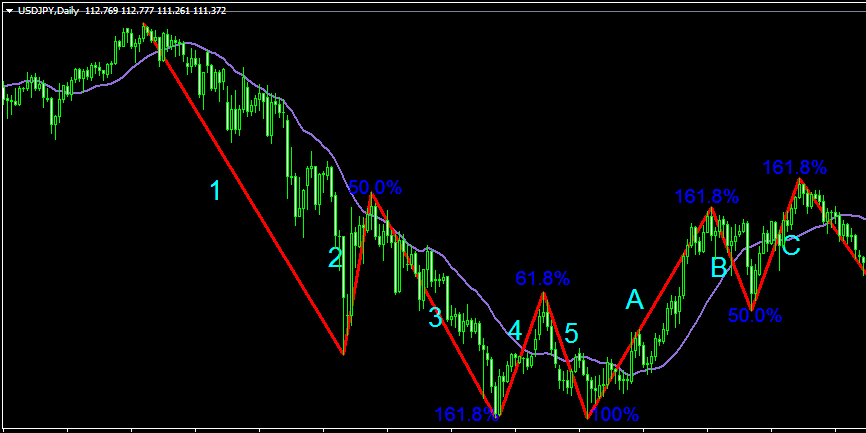
Here is an example of a daily chart of USD/JPY.
On the chart, the Elliot waves have been marked using trendlines. The Fibonacci levels are also marked. A simple moving average is also plotted to give an impression of the market trend.
Here is a description of what could be happening on the currency pair.
- A strong bearish move occurs, which sets the count for the Elliot waves pattern. It is labeled wave 1.
- Wave 2 retraces by 50% of wave 1, which also aligns with the First rule of Elliot waves.
- Wave 3 stretches by 161.8% of wave 2. (In most cases, it stretches by 161.8% of the first wave).
- Wave 4 retraces by 61.8% of wave 3.
- Wave 5 reaches 100% of wave 4.
- Wave A of the correction period extends by 161.8% of the length of wave 5.
- Wave B makes a bearish move by retracing 50.0% of wave A.
- Wave C makes a bullish move by extending 161.8% of wave B.
The best places to trade the Elliot wave pattern are:
- The start of wave 3
- The start of wave 5
- The end of wave 5
- The start of wave C
As earlier mentioned, wave 3 is the strongest and offers the most lucrative trade opportunities in the Elliot wave setup.
To correctly spot wave 3, you should first ensure that wave 1 forms in the direction of the emerging trend. Consequently, wait for a corrective wave to form, wave 2, which should retrace by 38.2%, 50.0%, or 61.8% of the initial wave. Correctly spotting these two waves will assist you in identifying the start of wave 3.
Wave 5 also presents a nice place for placing orders. It’s important to note that wave 5 usually attains between 50.0% and 161.8% of the length of wave 4. Furthermore, usually, it’s length is the same as wave 1.
Wave 3 and wave 5 offer lucrative trading opportunities because both are aligned with the predominant market trend. And, in the forex market, the trend is always your friend. Yeah?
Although the trending moves create two corrections, they are usually more difficult to trade and offer minimal profit potentials.
After the culmination of the impulse period, which ends with wave 5, you can expect to see the three waves of the corrective period.
In this period, wave C offers the most profitable trading opportunity. Just like wave 3, wave C is the strongest wave in the corrective period.
To trade it, you can wait for wave B to complete forming (by retracing 50-61.8% of wave A), and then jump into the emerging C movement.
Conclusion
The Elliot wave theory is a powerful strategy you can add to your trading arsenal. If you can master how to use it in the messy madness of the price action, you can greatly improve your trading profits.
There are several techniques you can use for trading using Elliot waves. Ultimately, it boils down to your experience and how well you can use the theory for spotting potential places for entering and exiting the market.
Importantly, instead of spending countless hours trying to identify every wave and every correction, you should look at the big picture. Are you able to tell whether the market is in impulse or correction?
Furthermore, if a currency pair is in correction that is likely to be exhausted soon, are you able to tell where to place an order when the predominant trend resumes?
The theory has withstood the test of time, and it could be just what you need to take your trading to the next level.
Happy trading!
Author Profile

Fat Finger
My name is Phat Fin Ge, but most people just call me Fat Finger or Mr. Finger.
Many years ago, I was a trader on the Hong Kong Stock Exchange. I became so successful that my company moved me to their offices on Wall Street. The bull market was strong, but my trading gains always outperformed market averages, until that fateful day.
On October 28th, 1929, I tried to take some profits after Charles Whitney had propped up the prices of US Steel. I was trying to sell 10,000 shares, but my fat finger pressed an extra key twice. My sell order ended up being for 1,290,000 shares. Before I could tell anyone it was an error, everyone panicked and the whole market starting heading down. The next day was the biggest stock market crash ever. In early 1930, I was banned from trading for 85 years.
I went back to Hong Kong to work at my family's goldfish store. Please come and visit us at Phat Goldfish in Kowloon, only a 3 minute walk from the C2 MTR entrance.
I thought everyone would forget about me and planned to quietly return to trading in 2015. To my horror, any error in quantity or price which cause a problem kept getting blamed on Fat Finger, even when it was a mix up and not an extra key being pressed. For example, an error by a seller on the Tokyo Stock Exchange was to sell 610,000 shares at ¥6 instead of 6 shares at ¥610,000. That had nothing to do with me or with how fat the trader's finger was, but everyone kept yelling, "Fat Finger! Fat Finger!" In 2016, people blamed a fat finger for a 6% drop in the GBP. It really was a combination of many things, none to do with me or anyone else who had a wider than average finger.
Now that I can trade again, I'm finding forex more interesting than stocks. I've been doing some research on trading forex and other instruments and I'll be sharing it here.
If you see any typing errors, you can blame those on my fat finmgert. If you see any strange changes in price, it's not my fault.
Info
963 Views 0 CommentsComments
Table of Contents
Recent
-
Bitcoin Fundamental Briefing, March 2024 Demystifying Cryptocurrency Nodes: Deep Dive into Polygon Node Ecosystem Strategies for Trading Forex on a Budget Bitcoin Fundamental Briefing, February 2024 Bitcoin Fundamental Briefing, January 2024 Strategic Asset Allocation Techniques for Currency Traders Bitcoin Fundamental Briefing, December 2023 Bitcoin Fundamental Briefing, November 2023
