Technical Analysis in Forex Trading

Technical analysis refers to the examining of historical market behavior with the intention of forecasting the potential movements of currency prices. Technical analysts usually focus on what took place in the forex market in the past and use the information to identify new trading opportunities.
Technical analysis is often contrasted closely to fundamental analysis, which refers to the study of macroeconomic conditions affecting the strength of currencies.
Whereas technical analysts often rely on various tools and concepts to assist them in studying the historical price behavior, the most common tool is the price chart.
The other tools are applied on the charts first before they can be used in making the analysis. Because of the importance of charts, technical analysts are sometimes called “chartists.”.
Technical analysis is founded on the following three key assumptions:
- Price action is superior: Technical analysists regard the price action of currency pairs to be superior to anything else. They believe that all the fundamental factors, such as interest rate hikes, political instability, or the unemployment rate, that could influence the market movements are already factored in the price behavior. As such, pure technical analysts focus exclusively on the price action displayed on their charts, without considering the reasons behind the movements.
- Price action follows trends: Technical analysts assert that the frequent fluctuations witnessed in the forex market follow trends. They believe the movements occur in orderly, systematic, and predictable fashion. When a direction has been formed, price action obeys the pattern before establishing another one. The expression, “The trend is your friend,” is often used in trading cycles to emphasize that currency prices usually follow trends.
- History usually repeats itself: The behavior of the financial markets has been tracked for over one century. During the tracking, some repetitive market behaviors have been observed. The way these repetitions form has advanced the idea that human psychology tends to behave in the same manner. Therefore, followers of technical analysis usually examine historical price patterns since they believe repetitions will occur in the future.
Here are the three key categories of technical analysis:
- Charting
- Indicators
- Theories
We are going to discuss each category so that you know how to use them for identifying trading opportunities.
1. Charting
Forex charts are used for displaying the movements of currency prices in the market. Technical analysts hold that the price action shown on the charts is not random and can be forecast by examining previous trends.
Here is a description of four main techniques utilized in charting.
Trends
A trend is a term used to describe the predominant direction of a currency pair. The three primary kinds of trends are:
- Upwards trend (bullish): The prevailing movement is upwards; that is, the price is increasing.
- Downwards trend (bearish): The dominant direction is downwards; that is, the price is reducing.
- Sideways trend (range): The primary movement is zigzag; that is, the price rises and falls several times without any precise direction.
Technical analysts emphasize that entering positions in the direction of the predominant trend is usually more successful. For example, if the currency pair is trending upwards, you should only place buy orders.
Here is a EUR/USD daily chart illustrating the three main types of trends.
Candlestick chart patterns
While there are other types of charts, like the line charts and bar charts, candlestick charts are the most widely used. Candlestick charts are excellent for doing technical analysis because it’s easy to identify patterns on them.
Candlestick chart patterns are many, and most of them are used to identify market turning points.
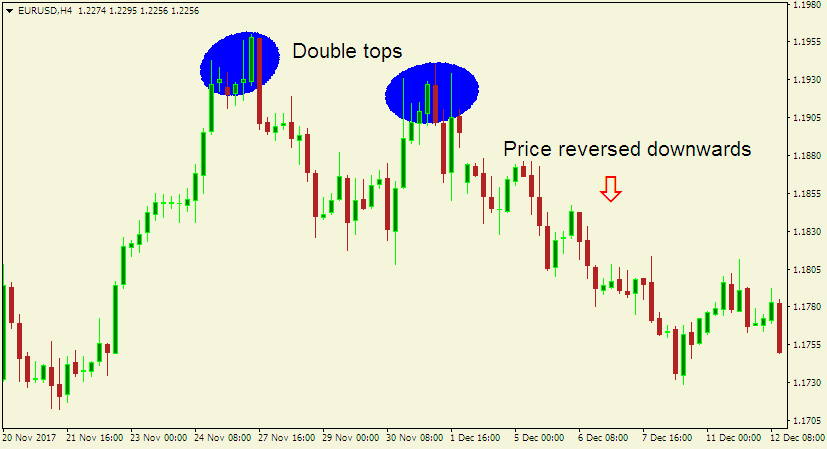
For example, double top chart patterns usually form after an extended uptrend. The two tops are the highest points that appear when the price is unable to make any further upsurges, allowing traders to place sell orders.
Here is an example of a double top chart pattern.
Support and resistance
Technical analysists use support and resistance to identify levels that act as barriers to prevent the price of a currency pair from moving in a certain direction.
Support describes the level that often holds the price above it; that is, it works like a floor that obstructs the price from passing downwards.
Conversely, resistance, just like the name suggests, describes the level that usually keeps the price below it. A resistance works like a ceiling that stops price from passing upwards.
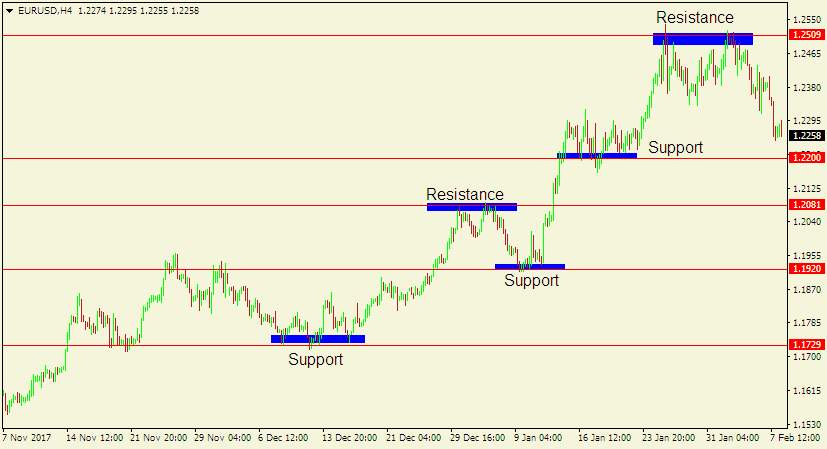
Here is a chart showing how support and resistance levels can be formed in a market trending upwards.
As seen on the chart above, the highest level the currency pair reaches before sliding downwards is the resistance area.
As the market continues with the uptrend, the lowest level it reaches before resuming the upward move is the support area.
If it were in a downward trend, the support and resistance areas could be formed oppositely.
Trendlines
Trendlines are usually plotted on charts to highlight the predominant direction of a currency pair. Besides using trendlines to identify the overall trend, you can use them to spot channels; that is price action contained within two parallel trendlines.
Here are the three main types of channels you can use for trading.
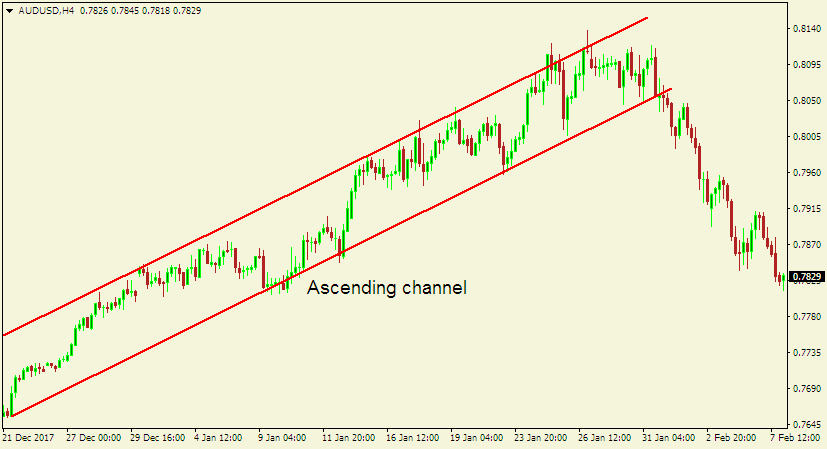
- Ascending channel: The market creates higher highs and higher lows.
- Descending channel: The market establishes lower highs and lower lows.
- Horizontal channel: The market is moving in a sideways trend.
Here is an example of an ascending channel pattern.
2. Forex Indicators
Forex indicators are essential in technical analysis. They are often used in assisting traders better interpret the fluctuations of currency prices in the market.
Here is a description of four of the leading indicators used in technical analysis.
Stochastic oscillator
Technical analysts depend on this indicator for determining when the price of a currency pair is overbought or oversold.
This momentum indicator was developed based on the concept that if the price of a currency pair increases, it tends to settle near its earlier high, and if the price falls, it tends to close near its earlier low.
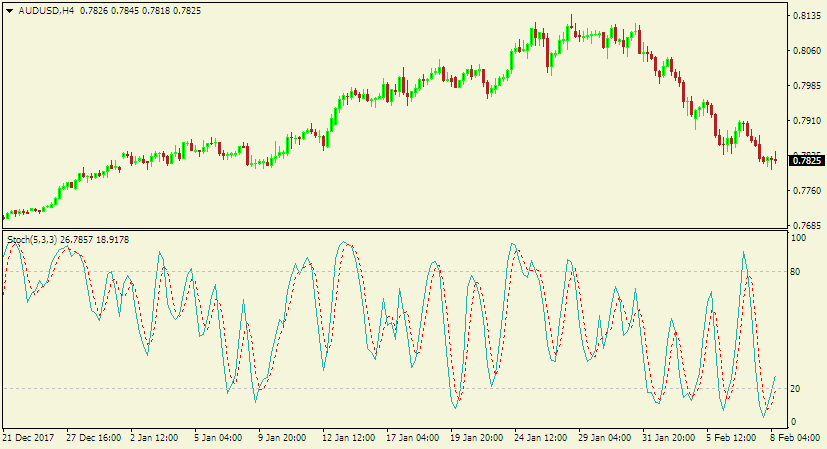
Here is a chart with the stochastic indicator.
As seen on the chart above, the stochastic indicator measures the momentum in the market using a scale of 0 to 100, with 20 and 80 acting as the “trigger levels.”
If the stochastic lines are beyond the 80 territory, it implies the currency is overbought, and a reversal is imminent. Thus, you should place sell orders.
Conversely, if the lines are below the 20 territory, it suggests the currency pair is oversold. Therefore, you should place buy trades because a reversal to the upside is likely.
Moving Averages
Moving averages are often used in technical analysis for smoothing out the rise and fall of currency prices over a defined period.
Typically, they eliminate the noises in the market, allowing you to more easily identify the prevailing market trend and enter trades accordingly.
The three main types of moving averages are:
- Simple moving averages
- Weighted moving averages
- Exponential moving averages
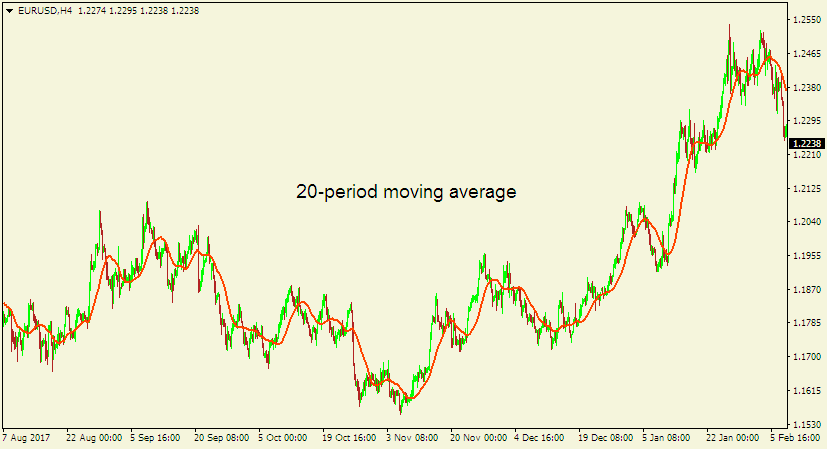
Here is a chart with a simple 20-period moving average.
As seen on the above chart, if the price of the currency pair stays below the simple moving average, it suggests the market is trending downwards.
On the other hand, whenever the price of the currency pair remains above the indicator, it implies the market is trending upwards.
If the market is trending in a range, the simple moving average gets mxed within the price action and does not stay far away from it, which is different from when the market is trending either upwards or downwards.
Moving Average Convergence Divergence
The Moving Average Convergence Divergence, which is shortened as MACD, is a widely used indicator in the forex market. Usually, technical analysts utilize it to determine either the trend or the momentum of the market.
By default, this indicator computes the difference between the 12-period and the 26-period exponential moving averages. And, the 12-period moving average is usually the quicker one.
The difference between the two moving averages constitutes the MACD main line, which is portrayed as a single line. Usually, the MACD indicator comes with an additional line, which is shown by vertical bars (called a histogram). In most trading platforms, this extra line is a 9-period moving average.
Here is a chart with the default MACD indicator.
As seen on the above chart, whenever the market is trending upwards (momentum is bullish), the MACD bars stay above the zero level. On the other hand, if the market is trending downwards (momentum is bearish), the MACD bars stay under the zero level.
Therefore, you can use MACD to help ensure that your trades will be placed according to the prevailing market trend.
Bollinger bands
Bollinger bands are also extensively used in technical analysis to assist traders to determine the extent of volatility of the forex market. Traders often want to know the level of market volatility because a swift rise or drop usually indicates an imminent change in trend.
This indicator consists of three lines: upper band, lower band, and middle band. Besides being the base for the upper band and the lower band, the middle band identifies the intermediate-term trend.
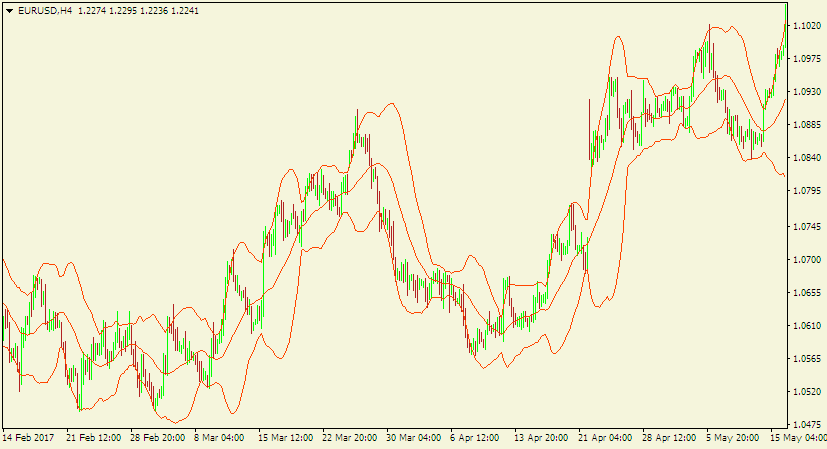
Here is how Bollinger bands appear on a chart.
As seen on the chart above, the price usually retraces to the middle band. In other words, when price reaches either of the two outer bands it usually comes back to the middle band.
The deviation between the upper band and the lower band represents the present volatility in the market.
During low volatility conditions, the upper and the lower bands get close to each other. Conversely, during high volatility situations, the two bands tend to move apart from each other.
Therefore, you can assess how the upper band and the lower band react to different market situations to assist you in identifying trading opportunities.
3. Theories
Lastly, the third category of technical analysis is theories. As earlier mentioned, technical analysts assert that movements in the forex market occur systematically and predictably.
Consequently, the fluctuations of currency prices have made technical analysts to develop theories for forecasting the market behavior.
The two major theories are:
- The Elliot wave theory
- The Fibonacci numbers theory
The Elliot wave theory
This theory rides on the concept that the rising and falling of currency prices occur in repeating patterns referred to as “waves.” According to the Elliot wave theory, the forex market moves in five and three-wave pattern.
The 8-wave pattern is divided into two sections: the impulse phase and the corrective phase. The initial five-wave pattern creates the impulse phase, which also represents the predominant market trend.
Subsequently, the next three-wave pattern forms the corrective phase, which denotes market movements that are contrary to the impulse phase.
For example, if the market trend during the impulse phase is bullish, then the corrective stage will have a bearish trend.
If you can identify the repeating waves on the charts, you can use the Elliot wave theory for identifying trading opportunities.
The Fibonacci numbers theory
The Fibonacci numbers theory is based on using a predetermined sequence of numbers for identifying entry and exit places on the market.
The most widely used Fibonacci numbers are:
- 0.382 (38.2%)
- 0.50 (0.50%)
- 0.618 (61.8%)
- 0.786 (78.6%)
- 1.27 (127%)
- 1.618 (161.8%)
- 2.618 (261.8%)
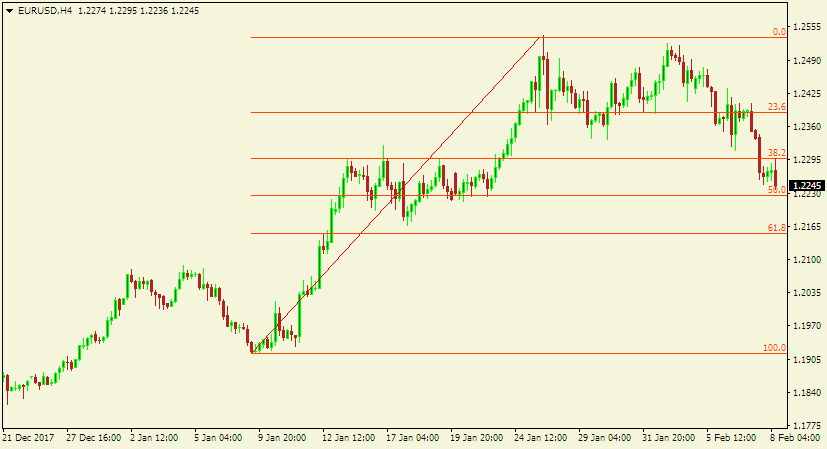
These numbers represent the potential support and resistance levels. The concept here is that the market often retraces to these levels before continuing with its primary trend.
For example, in a market trending upwards, price tends to retrace to a Fibonacci support level, and vice versa.
Therefore, you can use the Fibonacci numbers to assist you in forecasting the movement of currency prices.
Here is a chart with the Fibonacci retracement indicator applied.
Conclusion
Technical analysis is a powerful technique for identifying trade opportunities in the forex market. By focusing on historical price patterns and prevailing trends, technical analysts aim to determine the present trading conditions and forecast upcoming market movements.
Several tools and concepts can be used for performing technical analysis. However, you should not crowd your charts with numerous tools, as it could cripple your decision making.
The trick is to embrace a simple approach and use two or three technical analysis tools for trading. You can include the others to help filter out bad signals and confirm trading opportunities.
If used correctly, technical analysis can assist in taking your trading career a notch higher.
Happy trading.
Author Profile

Fat Finger
My name is Phat Fin Ge, but most people just call me Fat Finger or Mr. Finger.
Many years ago, I was a trader on the Hong Kong Stock Exchange. I became so successful that my company moved me to their offices on Wall Street. The bull market was strong, but my trading gains always outperformed market averages, until that fateful day.
On October 28th, 1929, I tried to take some profits after Charles Whitney had propped up the prices of US Steel. I was trying to sell 10,000 shares, but my fat finger pressed an extra key twice. My sell order ended up being for 1,290,000 shares. Before I could tell anyone it was an error, everyone panicked and the whole market starting heading down. The next day was the biggest stock market crash ever. In early 1930, I was banned from trading for 85 years.
I went back to Hong Kong to work at my family's goldfish store. Please come and visit us at Phat Goldfish in Kowloon, only a 3 minute walk from the C2 MTR entrance.
I thought everyone would forget about me and planned to quietly return to trading in 2015. To my horror, any error in quantity or price which cause a problem kept getting blamed on Fat Finger, even when it was a mix up and not an extra key being pressed. For example, an error by a seller on the Tokyo Stock Exchange was to sell 610,000 shares at ¥6 instead of 6 shares at ¥610,000. That had nothing to do with me or with how fat the trader's finger was, but everyone kept yelling, "Fat Finger! Fat Finger!" In 2016, people blamed a fat finger for a 6% drop in the GBP. It really was a combination of many things, none to do with me or anyone else who had a wider than average finger.
Now that I can trade again, I'm finding forex more interesting than stocks. I've been doing some research on trading forex and other instruments and I'll be sharing it here.
If you see any typing errors, you can blame those on my fat finmgert. If you see any strange changes in price, it's not my fault.
Info
1233 Views 0 CommentsComments
Table of Contents
Recent
-
Bitcoin Fundamental Briefing, March 2024 Demystifying Cryptocurrency Nodes: Deep Dive into Polygon Node Ecosystem Strategies for Trading Forex on a Budget Bitcoin Fundamental Briefing, February 2024 Bitcoin Fundamental Briefing, January 2024 Strategic Asset Allocation Techniques for Currency Traders Bitcoin Fundamental Briefing, December 2023 Bitcoin Fundamental Briefing, November 2023

