D.R.&Quinch
Sergeant
- Messages
- 661
Hi everyone,
a memeber has asked me to publish any notes i have made whilst studying a thread on another forex forum.
The thread in question has been very popular and is based fine tuning entries using two timeframes and a few indicators, alongside candlestick patterns.
I am not sure what to think of what i have read, but i will say no more as your opinions would be greatly appreciated, and avoiding bias may be best. Hopefully, this precis will also save you the time of reading the original thread, or serve as an abstract to it.
None of these ideas are mine. they belong to a professional who knows more than i do! so apologies if any of this is not clear enough
OK!
1) bollinger bands standard settings on m20 timeframe
2) keltner channel, factor 1 (i input 0.001 in marketscope, this seems to work) period 5 on m5 timeframe, plus macd standard setting (i use 5,34,5 but this is not stated in original post)
3) simple price vector analysis
Ok the idea seems to be:
a) identify an evening star, with middle candle of pattern on the bollinger bands. m20
b) when candle 4 ( even star is made of 3) begins on m20, move to m5.
now draw a line on macd showing direction, and on middle bollingerband to show the direction of that. draw a line dissectiong the angle exactly. This gives a resultant, which in itself points to the keltner band that price should (!!!!) travel to in the next few candles.
i.e if you are going short, and the resultant points to the upper keltner channel, then chance are , if you sit on your hands for a bit, the price will rise to there, giving you a better entry for your short.
!
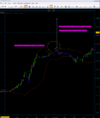
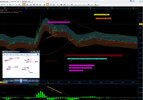
here are some pictures


This example is quite insipid, so i may add more when the kids are asleep
comments appreciated.
I read this thread because of the slightly predictive nature of this process. I was hoping it might shed some light on craigs scalping method that soe of us witnessed in the summer.
a memeber has asked me to publish any notes i have made whilst studying a thread on another forex forum.
The thread in question has been very popular and is based fine tuning entries using two timeframes and a few indicators, alongside candlestick patterns.
I am not sure what to think of what i have read, but i will say no more as your opinions would be greatly appreciated, and avoiding bias may be best. Hopefully, this precis will also save you the time of reading the original thread, or serve as an abstract to it.
None of these ideas are mine. they belong to a professional who knows more than i do! so apologies if any of this is not clear enough
OK!
1) bollinger bands standard settings on m20 timeframe
2) keltner channel, factor 1 (i input 0.001 in marketscope, this seems to work) period 5 on m5 timeframe, plus macd standard setting (i use 5,34,5 but this is not stated in original post)
3) simple price vector analysis
Ok the idea seems to be:
a) identify an evening star, with middle candle of pattern on the bollinger bands. m20
b) when candle 4 ( even star is made of 3) begins on m20, move to m5.
now draw a line on macd showing direction, and on middle bollingerband to show the direction of that. draw a line dissectiong the angle exactly. This gives a resultant, which in itself points to the keltner band that price should (!!!!) travel to in the next few candles.
i.e if you are going short, and the resultant points to the upper keltner channel, then chance are , if you sit on your hands for a bit, the price will rise to there, giving you a better entry for your short.
!
here are some pictures


This example is quite insipid, so i may add more when the kids are asleep
comments appreciated.
I read this thread because of the slightly predictive nature of this process. I was hoping it might shed some light on craigs scalping method that soe of us witnessed in the summer.