Sive Morten
Special Consultant to the FPA
- Messages
- 18,648
Monthly
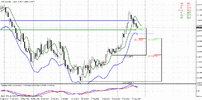
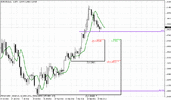
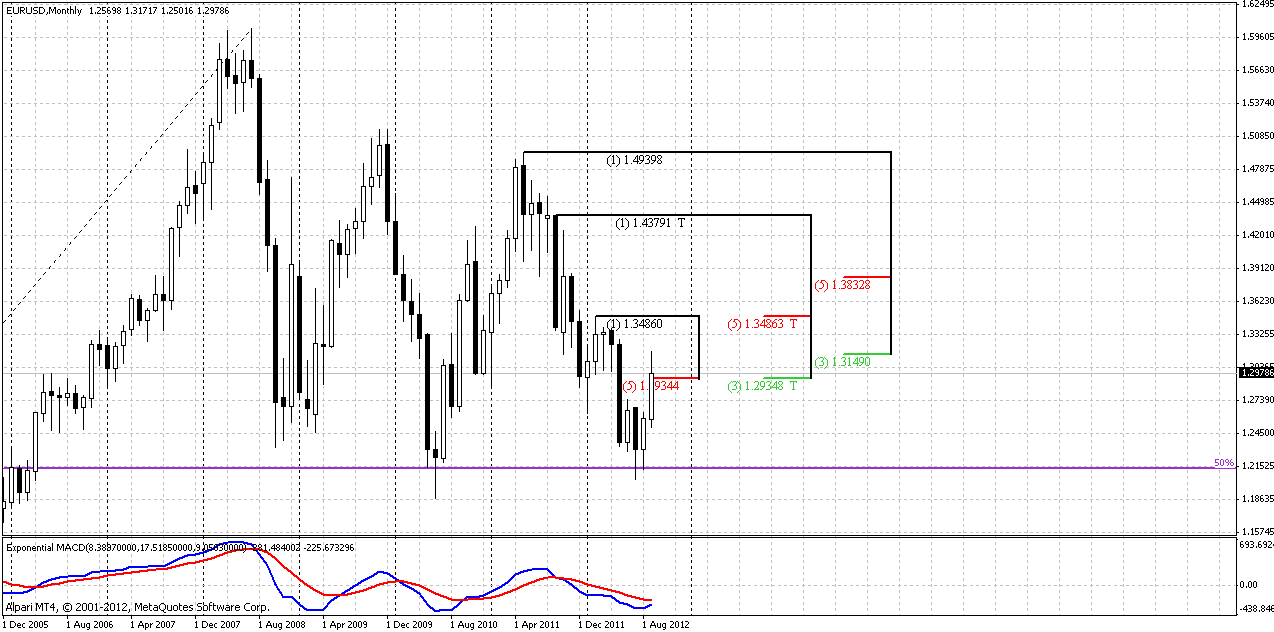
By taking a look at monthly chart we can see how monthly Confluence resistance works. At first glance market has passed through it, but now we see significant pullback almost to lower border of K-support area. All other moments still hold – trend is bearish, market is neither at oversold nor at overbought. So, as on previous week, coming one probably will be also focused on pullback from monthly K-area.
Weekly
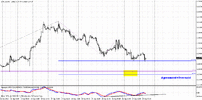
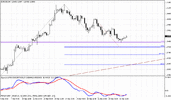
Well, weekly chart doesn’t demand a lot of comments as well, since we’ve discussed Stretch pattern in details in previous research. Here we will speak mostly about technical side of this pattern – how to trade it and about its potential targets.
Since this directional pattern is mostly technical rather than fundamental, i.e. it is based on market mechanics but not on some events that make market move. The core of this technical condition is overreacting, extreme deviation of price from one side, and reaching significant resistance from the other. This is some sort of fork that market can’t overcome in most cases and has to make some retracement to exit from overbought pressure first, get some forces for breaking resistance. That’s why Stretch pattern is retracement in nature. Precisely by the same reason it is more risky than the others, since it demands trader to act againts the trend and momentum. And this, in turn usually leads to chopper price action, since Stretch has no impulse.
Due to these moments trader has to think twice before taking trade on Stretch pattern.
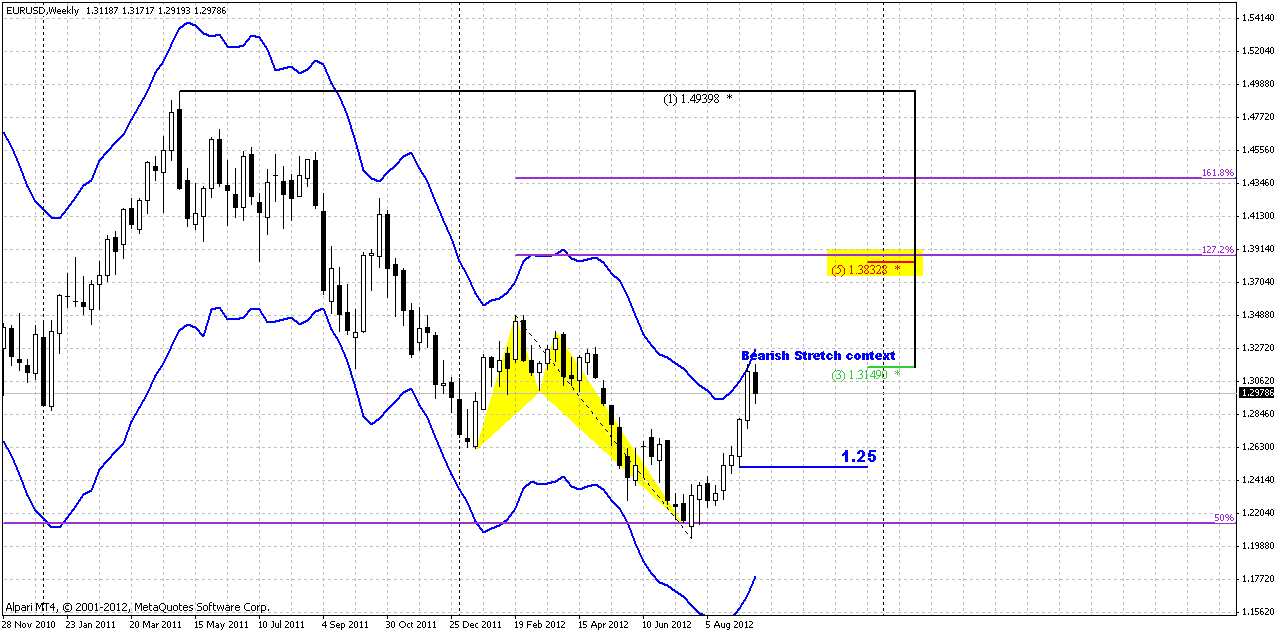
Ok, now let’s turn to trading. Theoretically Stretch target is zero level of DOSC, or middle area between Oscillator predictor bands. Since OB/OS is dynamic parameter, it could turn so, that DOSC will hit zero, but your position will be at breakeven or even with some loss. That is also possible, and you will have to exit anyway, since Stretch will end by this target. Still, on our weekly chart currently this level is 1.25.
In most cases better to take conservative target, at least you will get more experience with Stretch pattern. Use some AB=CD on daily chart or nearest significant support level on daily as Stretch target.
Entry process is as follows. As we speak about weekly pattern, next time frame for us is daily. So, you need get Stretch combination on weekly (done), second – wait when market starts to behave according to it and shift trend bearish on daily (done). After that you need nearest 3/8 retracement up on daily to enter short. Stop should be placed above weekly overbought by close price, or, better by high prices. Still there are multiple variants. For instance, you may try to trade Stretch by some daily reversal pattern, but not purely on Fib framework.
Now, what target we have to take precisely in our situation. May be it will be a bit brave decision, but I think, that 1.25 should be reached. Mostly because as I’ve said milion of times – this is first reversal swing up, and market has significant accumulated bearish momentum. Precisely this momentum will force market to show deep retracement, and 1.25 – is 5/8 major Fib support on daily. Second, as a rule, after first reversal swing market tends to show AB-CD retracement, rather than just single-leg AB retracement. For entering with Stretch, probably BC leg will be perfect.
Since this pattern stands a bit separately from daily patterns – we need to keep in mind it.
Daily
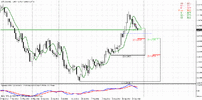
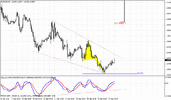
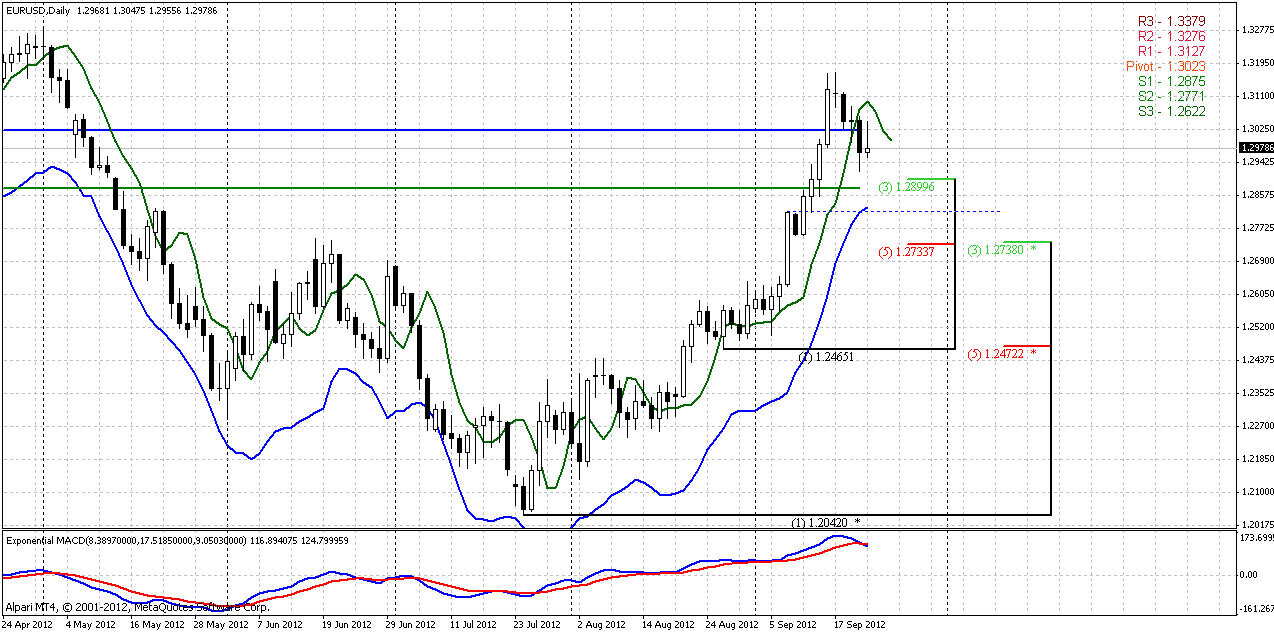
In continuation of Stretch pattern – first condition has been completed – trend is bearish…
As we’ve said on Friday – we didn’t get our Stop Grabber pattern, but as DRPO as B&B are still possible, and what particular pattern will prevail – we will see. Let’s talk about B&B first.
B&B
Till that moment everything develops as in theoretical book. We have two days close below 3x3 DMA. Usually it is suggested that B&B should reach significant support level on 1-3 day close below 3x3. So, we still have Monday day to hit this level. At my point of view perfect level for B&B starting is 50% support of B&B up thrust at 1.2815 that is also daily Oversold. Keep an eye on this level, perfectly if we will get some intraday reversal pattern here or AB=CD agreement. Stop probably could be placed below K-support on daily. Target, as usual, is 0.618 resistance of current down move.
At the same time keep in mind that B&B is a shortest perspective and its work will not cancel deep retracement and potential Stretch pattern. May be particular by B&B we will get greater BC leg.
DRPO
If market still will not reach significant daily level and show upward reversal by some pattern that will be chance for DRPO pattern, and strong downward retracement could start by it. Recall that DRPO is completed when market will show second down penetration and close below 3x3 DMA. Surely we will not miss this stuff in our daily updates.
1-hour
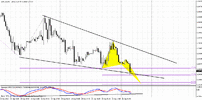
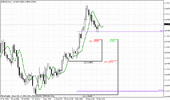
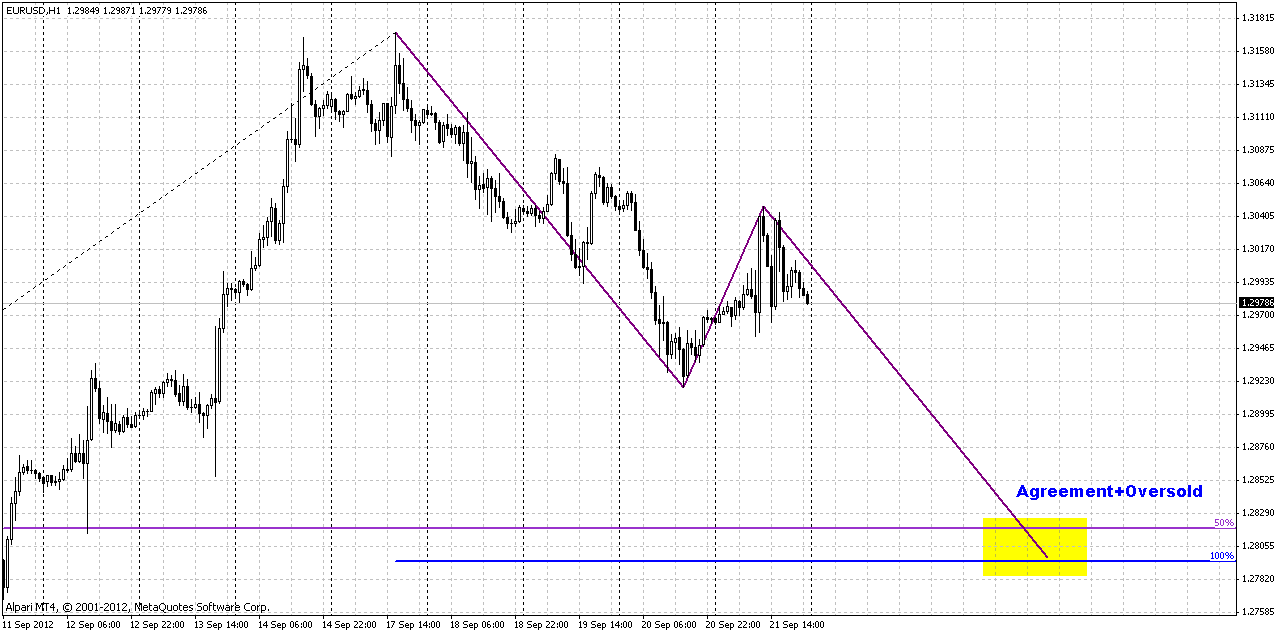
Well, based on houlry chart, looks like puzzle is completed. We have AB=CD that creates Agreement with 50% support at daily Oversold... Current BC leg looks like bearish flag on 4-hour chart, so from classical point of view, context is bearish on intraday charts, as well.
The technical portion of Sive's analysis owes a great deal to Joe DiNapoli's methods, and uses a number of Joe's proprietary indicators. Please note that Sive's analysis is his own view of the market and is not endorsed by Joe DiNapoli or any related companies.
By taking a look at monthly chart we can see how monthly Confluence resistance works. At first glance market has passed through it, but now we see significant pullback almost to lower border of K-support area. All other moments still hold – trend is bearish, market is neither at oversold nor at overbought. So, as on previous week, coming one probably will be also focused on pullback from monthly K-area.

Weekly
Well, weekly chart doesn’t demand a lot of comments as well, since we’ve discussed Stretch pattern in details in previous research. Here we will speak mostly about technical side of this pattern – how to trade it and about its potential targets.
Since this directional pattern is mostly technical rather than fundamental, i.e. it is based on market mechanics but not on some events that make market move. The core of this technical condition is overreacting, extreme deviation of price from one side, and reaching significant resistance from the other. This is some sort of fork that market can’t overcome in most cases and has to make some retracement to exit from overbought pressure first, get some forces for breaking resistance. That’s why Stretch pattern is retracement in nature. Precisely by the same reason it is more risky than the others, since it demands trader to act againts the trend and momentum. And this, in turn usually leads to chopper price action, since Stretch has no impulse.
Due to these moments trader has to think twice before taking trade on Stretch pattern.
Ok, now let’s turn to trading. Theoretically Stretch target is zero level of DOSC, or middle area between Oscillator predictor bands. Since OB/OS is dynamic parameter, it could turn so, that DOSC will hit zero, but your position will be at breakeven or even with some loss. That is also possible, and you will have to exit anyway, since Stretch will end by this target. Still, on our weekly chart currently this level is 1.25.
In most cases better to take conservative target, at least you will get more experience with Stretch pattern. Use some AB=CD on daily chart or nearest significant support level on daily as Stretch target.
Entry process is as follows. As we speak about weekly pattern, next time frame for us is daily. So, you need get Stretch combination on weekly (done), second – wait when market starts to behave according to it and shift trend bearish on daily (done). After that you need nearest 3/8 retracement up on daily to enter short. Stop should be placed above weekly overbought by close price, or, better by high prices. Still there are multiple variants. For instance, you may try to trade Stretch by some daily reversal pattern, but not purely on Fib framework.
Now, what target we have to take precisely in our situation. May be it will be a bit brave decision, but I think, that 1.25 should be reached. Mostly because as I’ve said milion of times – this is first reversal swing up, and market has significant accumulated bearish momentum. Precisely this momentum will force market to show deep retracement, and 1.25 – is 5/8 major Fib support on daily. Second, as a rule, after first reversal swing market tends to show AB-CD retracement, rather than just single-leg AB retracement. For entering with Stretch, probably BC leg will be perfect.
Since this pattern stands a bit separately from daily patterns – we need to keep in mind it.

Daily
In continuation of Stretch pattern – first condition has been completed – trend is bearish…
As we’ve said on Friday – we didn’t get our Stop Grabber pattern, but as DRPO as B&B are still possible, and what particular pattern will prevail – we will see. Let’s talk about B&B first.
B&B
Till that moment everything develops as in theoretical book. We have two days close below 3x3 DMA. Usually it is suggested that B&B should reach significant support level on 1-3 day close below 3x3. So, we still have Monday day to hit this level. At my point of view perfect level for B&B starting is 50% support of B&B up thrust at 1.2815 that is also daily Oversold. Keep an eye on this level, perfectly if we will get some intraday reversal pattern here or AB=CD agreement. Stop probably could be placed below K-support on daily. Target, as usual, is 0.618 resistance of current down move.
At the same time keep in mind that B&B is a shortest perspective and its work will not cancel deep retracement and potential Stretch pattern. May be particular by B&B we will get greater BC leg.
DRPO
If market still will not reach significant daily level and show upward reversal by some pattern that will be chance for DRPO pattern, and strong downward retracement could start by it. Recall that DRPO is completed when market will show second down penetration and close below 3x3 DMA. Surely we will not miss this stuff in our daily updates.

1-hour
Well, based on houlry chart, looks like puzzle is completed. We have AB=CD that creates Agreement with 50% support at daily Oversold... Current BC leg looks like bearish flag on 4-hour chart, so from classical point of view, context is bearish on intraday charts, as well.

The technical portion of Sive's analysis owes a great deal to Joe DiNapoli's methods, and uses a number of Joe's proprietary indicators. Please note that Sive's analysis is his own view of the market and is not endorsed by Joe DiNapoli or any related companies.
Last edited:
