Sive Morten
Special Consultant to the FPA
- Messages
- 18,644
Monthly
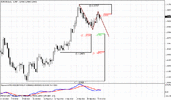
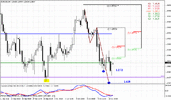
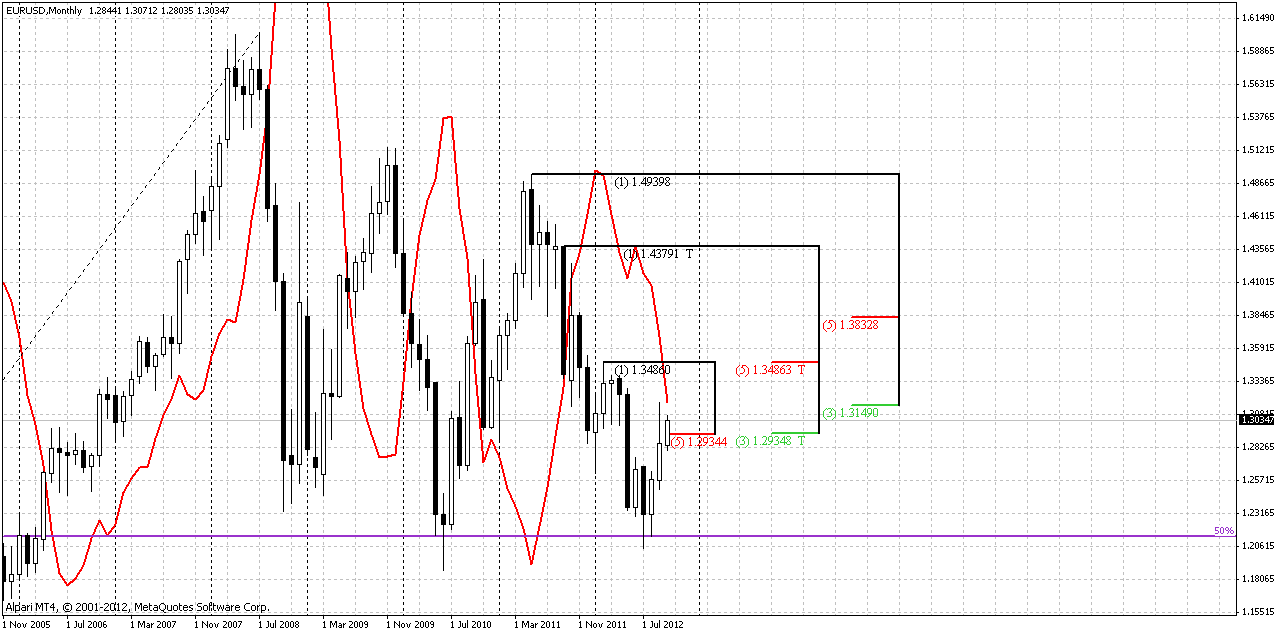
On monthly chart trend holds bullish. After first pullback from K-resistance area, price again has entered inside this range. In general, October just yet is an inside month for September price action. Since previous week we do not have much new information. All that we can see here is that market stands at long-term strong resistance. So, again, our major focus probably will be more on tactics on lower time frames, rather than on strategy.
Weekly
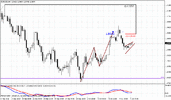
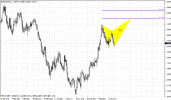
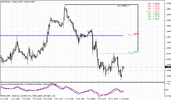
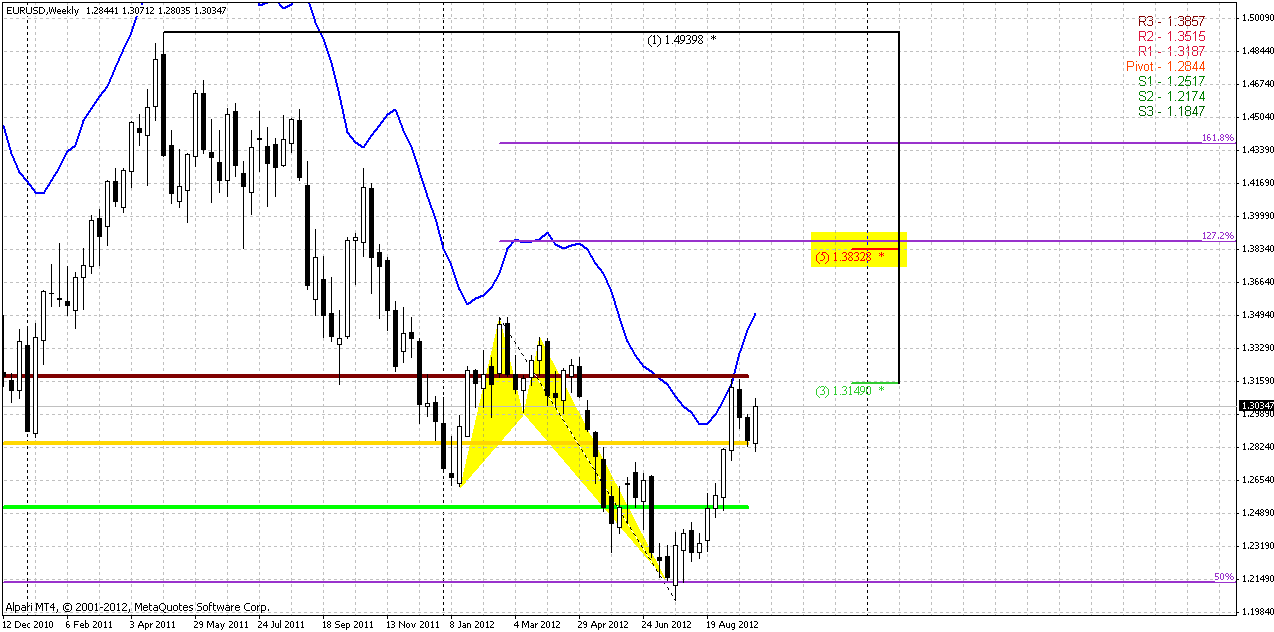
Speaking about weekly chart, it makes sense to re-read previous comments. All our suggestions are based on thought that currently we have first bullish swing up. But on Friday I had some doubts about it. Is it really so? This is very important for medium term perspective. Take a look – if we will treat as last swing down just small swing down from 1.2750, then our assumption is correct. But what if we have to treat as recent swing down whole butterfly move? This suspicion has come to me, because it was too small retracement on a way down before 1.2750 top. In this case we do not have bullish reversal swing. Hence we will not get deep retracement to 1.25. If market indeed is reversing up – it should show upward reversal swing, but it should be higher than 1.35 – the starting point of butterfly swing down. From the other side, if market will not reverse, we should get downward continuation, since from that swing calculation we just have next lower high in long term bear trend.
Speaking simply, if we were wrong by treating current swing up as reversal, we could get upward continuation and our thought about downward AB=CD on daily will be wrong. If this is not a reversal swing, then donward move will start, but it will not stop around 1.25 and continue futher, although this is is not very important for us currently.
Weekly chart can’t assist us much. All that we see is bullish trend, price stands above MPP. One thing that somehow points on possible deeper retracement is Stretch pattern, but it is very tricky and unstable. It suggests pullback from overbought area but where this pullback will stop difficult to say. This situation puts on us significant responsibility and sensitivity to what market will show us in nearest couple of weeks.
Daily
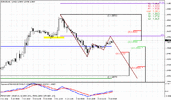
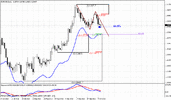
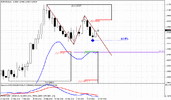
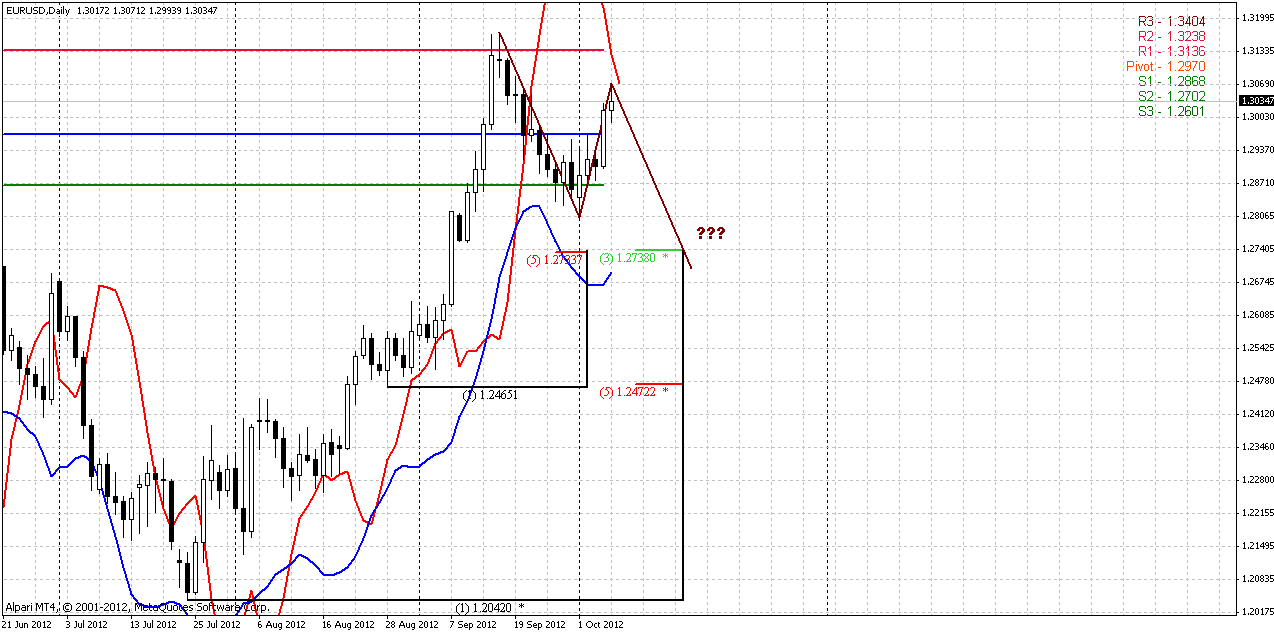
Fortunately on daily time frame we have some tool, that may be will not protect us from wrong decision, but at least will tell us when we will wrong. That is MACD Predictor. You can see that price action stands very close to it. I prefer to get bearish stop grabber here to be absolutely confident with possible AB=CD pattern. Besides, this pattern will let us enter short and place tight stop based on it. Conversely, if trend will shift bullish, that will force us stay on hold. It might be upward continuation.
Speaking directly about AB=CD, then it creates an Agreement with Confluence Support at daily oversold. Very often higher time frame overbought could push prices to lower time-frame oversold. Reaction is equal to counter-reaction. That is by the way, another moment that gives some chances to AB=CD pattern reach the target.
4-hour
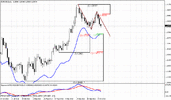
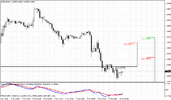
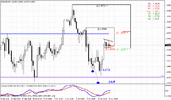
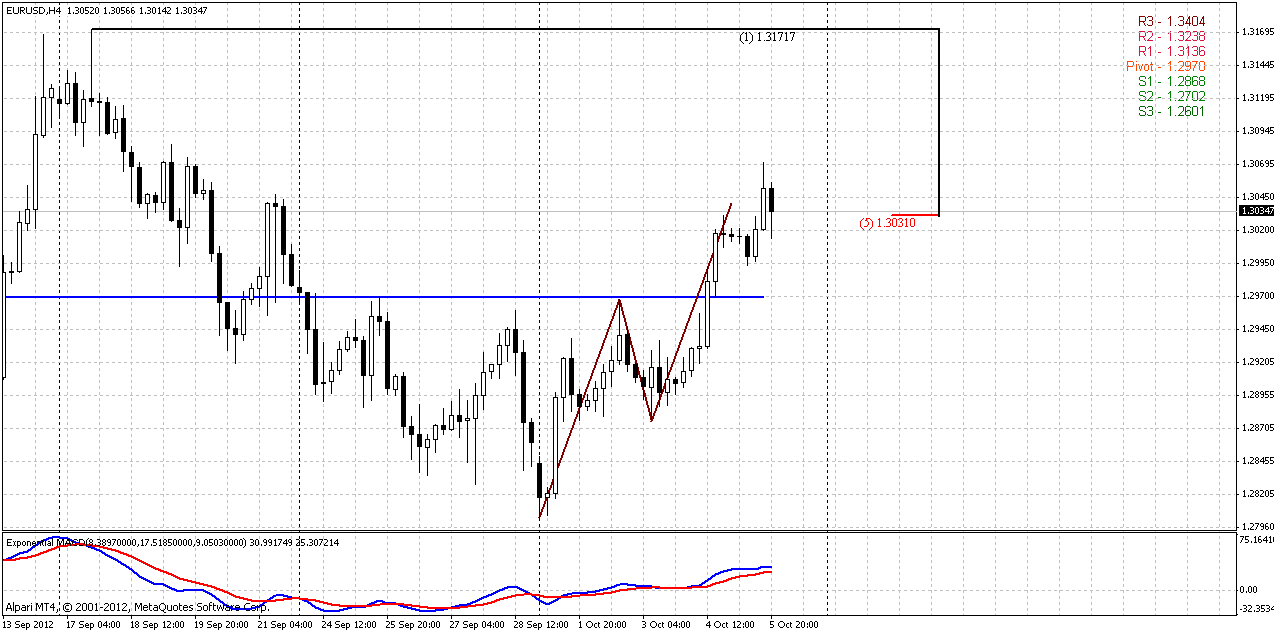
Here is continuation of Friday’s discussion. As you can see, price has hit AB=CD target by upward continuation. So, price stands at Agreement. It probably could not be necessary reversal, as we suggest, but some respect of this area should happen. Since we do not know will we get deeper retracement down – this Agreement could be our chance to take position.
1-hour
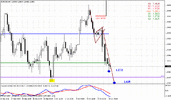
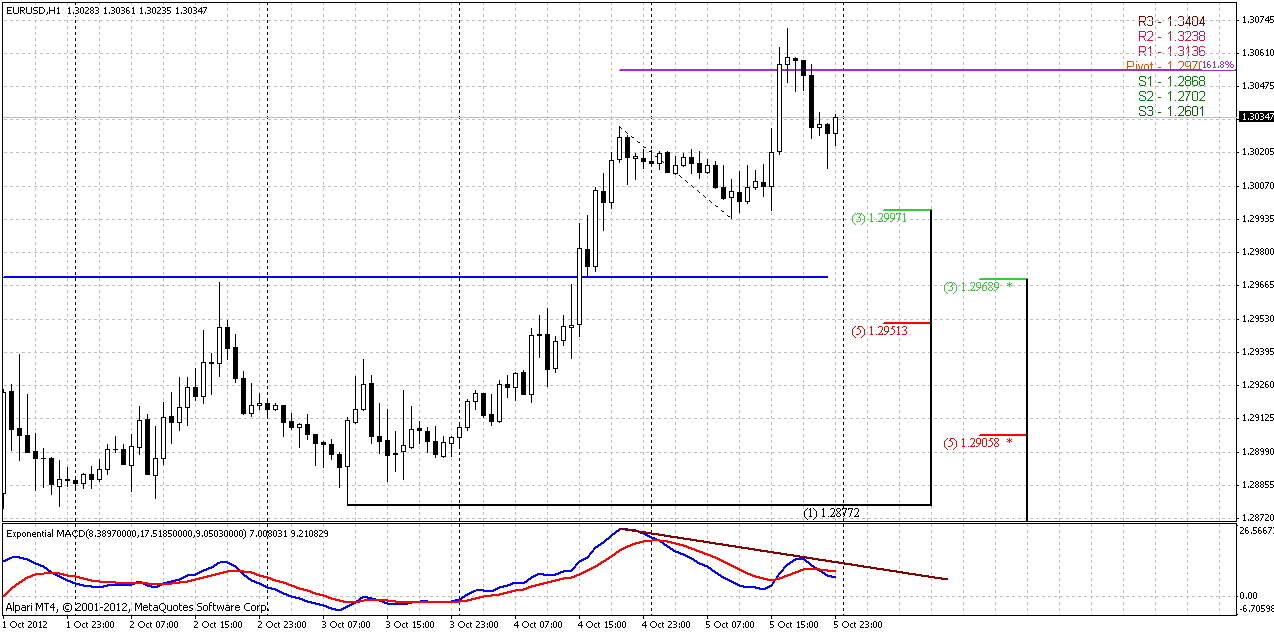
Here we have some signs of market exhausting right at Agreement area. Market has hit 1.618 extension of previous retracement, accompanied by bearish divergence with MACD. Trend has turned bearish as well. If we suggest that this will be just respect of Agreement area and retracement, then most probable destination point is hourly Confluence support at 1.2950-1.2970 and WPP=1.2970. May be it will be something like H&S pattern...
Conclusion:
I hope that current week will give us some clarification on medium-term perspectives. Since we have comfort combination of intraday resistance and daily trend breakeven point, we could try short entry, and move stop order to breakeven after market will proceed to WPP. Then all that we could do is just wait – either downward AB=CD development on daily time frame, or upward breakout and continuation up (if we were wrong with swings on weekly).
The technical portion of Sive's analysis owes a great deal to Joe DiNapoli's methods, and uses a number of Joe's proprietary indicators. Please note that Sive's analysis is his own view of the market and is not endorsed by Joe DiNapoli or any related companies.
On monthly chart trend holds bullish. After first pullback from K-resistance area, price again has entered inside this range. In general, October just yet is an inside month for September price action. Since previous week we do not have much new information. All that we can see here is that market stands at long-term strong resistance. So, again, our major focus probably will be more on tactics on lower time frames, rather than on strategy.

Weekly
Speaking about weekly chart, it makes sense to re-read previous comments. All our suggestions are based on thought that currently we have first bullish swing up. But on Friday I had some doubts about it. Is it really so? This is very important for medium term perspective. Take a look – if we will treat as last swing down just small swing down from 1.2750, then our assumption is correct. But what if we have to treat as recent swing down whole butterfly move? This suspicion has come to me, because it was too small retracement on a way down before 1.2750 top. In this case we do not have bullish reversal swing. Hence we will not get deep retracement to 1.25. If market indeed is reversing up – it should show upward reversal swing, but it should be higher than 1.35 – the starting point of butterfly swing down. From the other side, if market will not reverse, we should get downward continuation, since from that swing calculation we just have next lower high in long term bear trend.
Speaking simply, if we were wrong by treating current swing up as reversal, we could get upward continuation and our thought about downward AB=CD on daily will be wrong. If this is not a reversal swing, then donward move will start, but it will not stop around 1.25 and continue futher, although this is is not very important for us currently.
Weekly chart can’t assist us much. All that we see is bullish trend, price stands above MPP. One thing that somehow points on possible deeper retracement is Stretch pattern, but it is very tricky and unstable. It suggests pullback from overbought area but where this pullback will stop difficult to say. This situation puts on us significant responsibility and sensitivity to what market will show us in nearest couple of weeks.

Daily
Fortunately on daily time frame we have some tool, that may be will not protect us from wrong decision, but at least will tell us when we will wrong. That is MACD Predictor. You can see that price action stands very close to it. I prefer to get bearish stop grabber here to be absolutely confident with possible AB=CD pattern. Besides, this pattern will let us enter short and place tight stop based on it. Conversely, if trend will shift bullish, that will force us stay on hold. It might be upward continuation.
Speaking directly about AB=CD, then it creates an Agreement with Confluence Support at daily oversold. Very often higher time frame overbought could push prices to lower time-frame oversold. Reaction is equal to counter-reaction. That is by the way, another moment that gives some chances to AB=CD pattern reach the target.

4-hour
Here is continuation of Friday’s discussion. As you can see, price has hit AB=CD target by upward continuation. So, price stands at Agreement. It probably could not be necessary reversal, as we suggest, but some respect of this area should happen. Since we do not know will we get deeper retracement down – this Agreement could be our chance to take position.

1-hour
Here we have some signs of market exhausting right at Agreement area. Market has hit 1.618 extension of previous retracement, accompanied by bearish divergence with MACD. Trend has turned bearish as well. If we suggest that this will be just respect of Agreement area and retracement, then most probable destination point is hourly Confluence support at 1.2950-1.2970 and WPP=1.2970. May be it will be something like H&S pattern...

Conclusion:
I hope that current week will give us some clarification on medium-term perspectives. Since we have comfort combination of intraday resistance and daily trend breakeven point, we could try short entry, and move stop order to breakeven after market will proceed to WPP. Then all that we could do is just wait – either downward AB=CD development on daily time frame, or upward breakout and continuation up (if we were wrong with swings on weekly).
The technical portion of Sive's analysis owes a great deal to Joe DiNapoli's methods, and uses a number of Joe's proprietary indicators. Please note that Sive's analysis is his own view of the market and is not endorsed by Joe DiNapoli or any related companies.
