Sive Morten
Special Consultant to the FPA
- Messages
- 18,644
Monthly
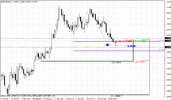
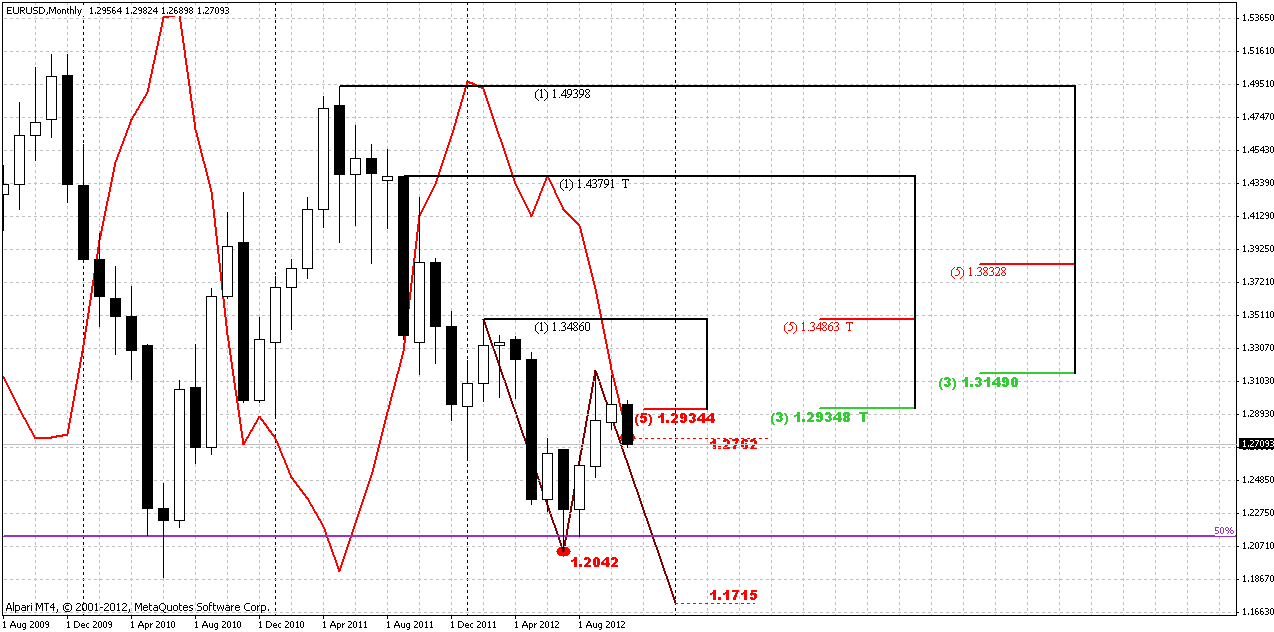
Monthly chart has not changed much, thus, all issues that we’ve specified previously are still valid. Now it is clear that market has stuck in monthly Confluence resistance area 1.2934-1.3149. In current moment, looking at pullback outside of it, we can suggest that the first challenge was unsuccessful, but will follow the next one? We can’t exclude this absolutely. For instance, some sort of double bottom could be formed, or something like that, we don’t know. I prefer to talk about it stick to the subject, that we do not have yet.
What is more important for us is that definitely some downward move should come. Since this is monthly time frame, this move could be really significant. Even if we mostly trade on daily and intraday charts, we could get definite direction for long-term perspective. That’s why higher time frames are important.
Now, pay attention to MACD Predictor. November bar stands very close to it, and by November open price trend has turned bullish. The trend breakeven point for current month is 1.2762. If monthly bar will close below this level we will get bearish stop grabber on monthly chart with minimum target – clearing of 1.2042 low. Since 1.2042 stands below 0.618 target of drawn AB=CD pattern, it’s a high probability that market will proceed to 1.17 area initially – target of AB=CD. 1.17 in turn, stands slightly lower previous long-term 2010 lows. Just imagine what will happen, if market will trigger stops below it. We easily could get achievement of our long term 1.15-1.16 target.
But let’s pass from one to another gradually. Our first task on monthly is to wait for November close. Let’s get stop grabber first and only after that will discuss other things.
Weekly
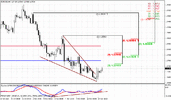
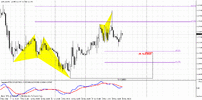
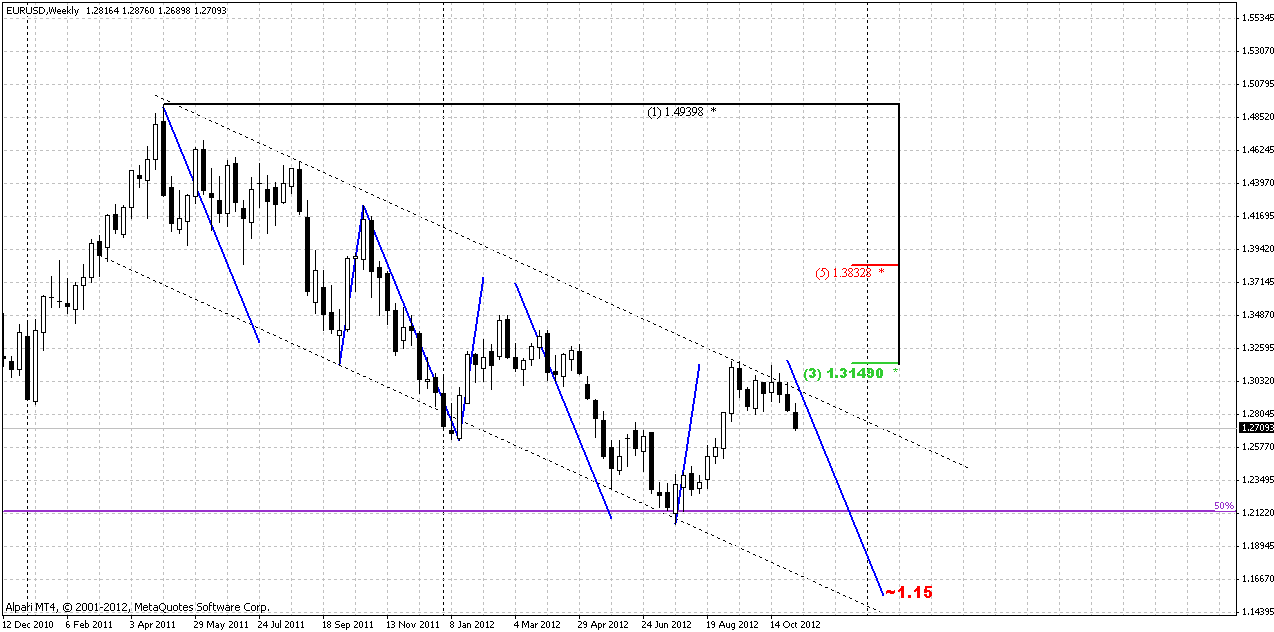
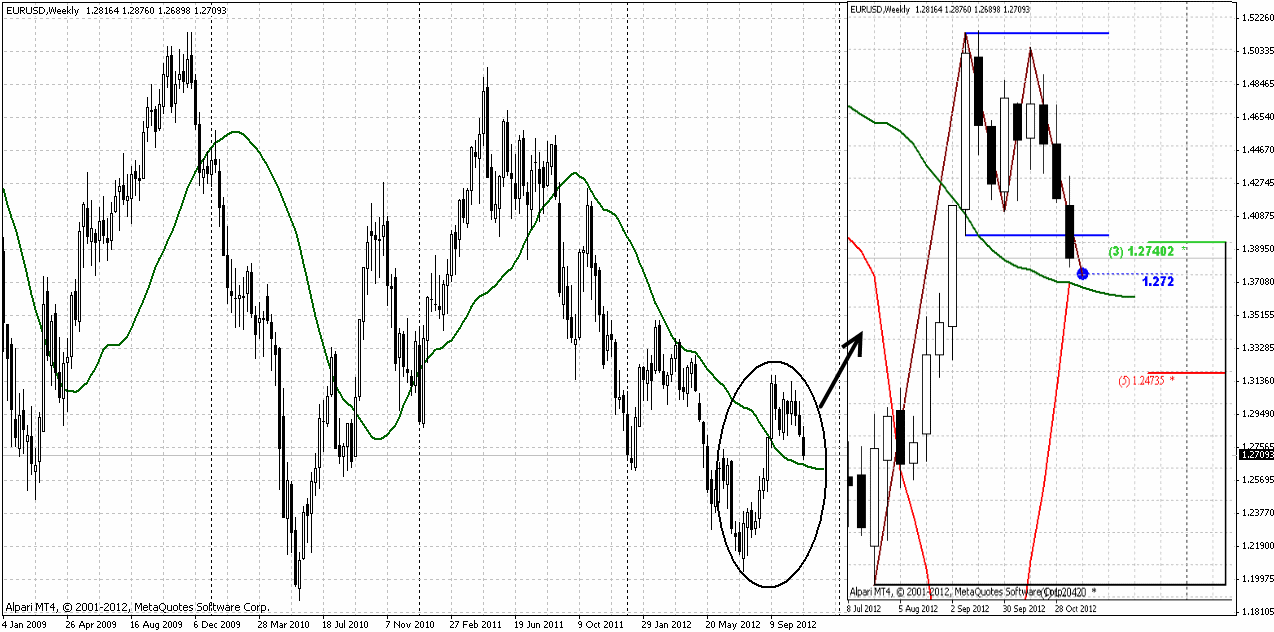
Although weekly chart is most important right now, I suspect that another week of expectation ahead, because none of major patterns were triggered. First, I’ll show you almost the same chart as on previous week – with harmonic swings and bullish flag failure. This is almost the same chart as on previous week. Analysis is also the same since it’s still relevant, so I’ve held most tools as it were on week before. There are still two things that give us assistance in understanding of situation here. First is bullish flag breakout trap two weeks ago flag, second is harmonic swings. That is just one side of the coin. Yes, if all will be smooth and market will continue move inside of channel – we will see 1.16 target. But here is another picture, that I would like to discuss with you.
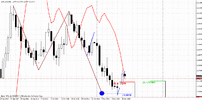
Take a look at weekly chart with 25x5 DMA, look how nice it holds price action. After each breakout market retests 25x5 from the other side – as in the case of downward breakout as in the case of upward one. But look what we have now – breakout of 25x5 DMA on weekly chart and attempt to retest it. On coming week 25x5 will have 1.2649 value. Still there is a moment that increases importance of this significantly – MACDP and 25x5 come in play in the same point. That is very close to 1.27 extension of our AB-CD pattern at 1.2675 and 3/8 major support level.
Now put all this stuff in relation to weekly coil area – I’ve marked it by blue horizontal lines on the chart. And, yes, this overall picture looks as “222” buy currently. Other words, market now stands in a very tricky area. I think that it will be safe to enter short only when this potential trap will be resolved by price action. That’s why I’ve said that another week of expectation stands ahead. But this does not mean that we have to stay flat totally – of cause not, but probably we will mostly take a deal with intraday short term patterns.
Daily
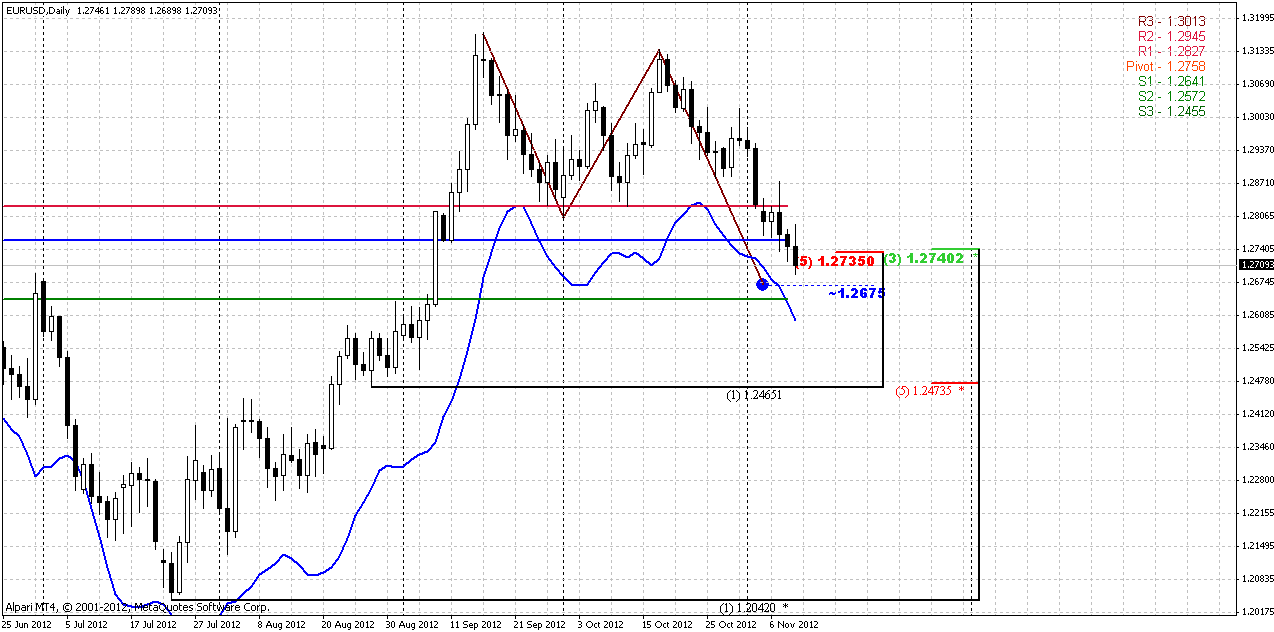
Daily chart hardly will help us to understand what to expect from current support area. Although market stands slightly below K-support area, I think that it is still valid. Price has a free space now till WPS1=1.2641, since it’s not at oversold. WPS1 stands in the same area as weekly 25x5. Another moment that speaks in favor of potential downward continuation is that market has moved below 1.0 extension of AB-CD pattern, hence next destination is 1.27 that is 1.2675, especially if there are no barriers ahead. But how it could happen – will market some bounce as a respect of Confluence support first or just continue move lower – I can’t say. Looks like we will have to keep mind open and catch all potential hints and leads that could appear on intraday charts.
4-hour
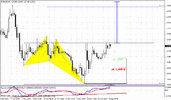
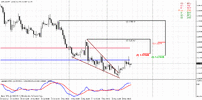
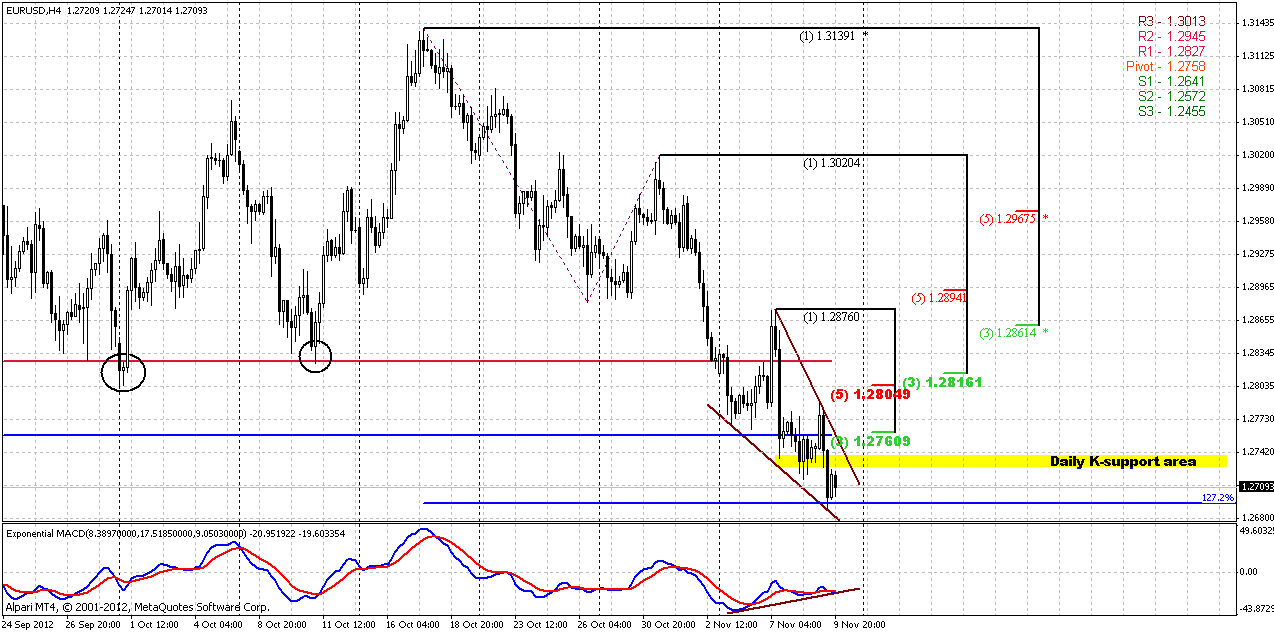
Well, on 4-hour chart we have the pattern that could trigger some bounce. This is bullish wedge, that now is forming right around daily Confluence support area. Wedge is accompanied by bullish divergence as well. So, there are two destination points could be after upward breakout. First is WPP and first fib resistance at 1.2760 area, second, that is more probable is WPR1 and 4-hour Confluence resistance at 1.2805-1.2816 area – it also coincides with classical wedge target estimation as wedge height. Take a look – WPR1 conicides with classical resistance line. Also we now, that when market retracemes within long-term bear trend, it very often retraces to WPR1. After 1.0 AB=CD target there was no significant pullback, so may be it will come from here.
1-hour
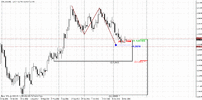
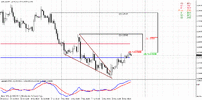
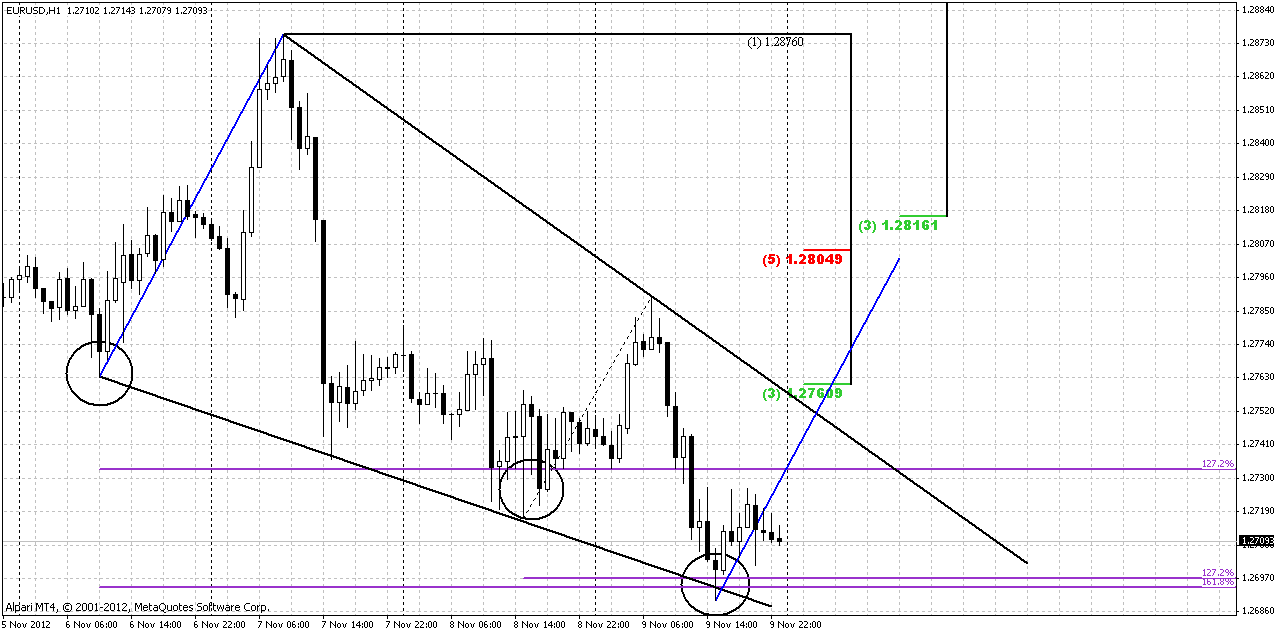
Probably this wedge could be treated as 3-Drive “Buy” pattern as we’ve discussed on Friday. So, as you can see price has found support right at crossing of 1.618 level of 1st drive and 1.272 of 2nd Drive levels. That is very typical for 3-Drive pattern. Second, it accompanied by bullish divergence with MACD. Minimum target is a high of second drive – that’s coincide with Confluence resistance at 1.2805-1.2816 area and gives the same destination as previous retracement – I’ve cloned it and dragged to current price action (blue lines).
Could this pattern fail? Absolutely. If it will move below 3rd drive low, then probably we might say that market will accelerate lower without any retracements right to level that we’ve specified in analysis of Daily time frame.
Conclusion:
On longer time frames market still has to give us some clarification about medium-term direction, and nothing is clear yet.
That’s make specific impact on our analysis and trading style on coming week. Particularly speaking, we probably will mostly deal with intraday patterns inside of tight week, until any solution will come.
Thus, on Monday some pullback could follow to 1.28-1.2815 area if 3-Drive “Buy” pattern will work accordingly. IF this pattern will fail, then we should be ready to downward move in 1.2640-1.2670 area.
The technical portion of Sive's analysis owes a great deal to Joe DiNapoli's methods, and uses a number of Joe's proprietary indicators. Please note that Sive's analysis is his own view of the market and is not endorsed by Joe DiNapoli or any related companies.
Monthly chart has not changed much, thus, all issues that we’ve specified previously are still valid. Now it is clear that market has stuck in monthly Confluence resistance area 1.2934-1.3149. In current moment, looking at pullback outside of it, we can suggest that the first challenge was unsuccessful, but will follow the next one? We can’t exclude this absolutely. For instance, some sort of double bottom could be formed, or something like that, we don’t know. I prefer to talk about it stick to the subject, that we do not have yet.
What is more important for us is that definitely some downward move should come. Since this is monthly time frame, this move could be really significant. Even if we mostly trade on daily and intraday charts, we could get definite direction for long-term perspective. That’s why higher time frames are important.
Now, pay attention to MACD Predictor. November bar stands very close to it, and by November open price trend has turned bullish. The trend breakeven point for current month is 1.2762. If monthly bar will close below this level we will get bearish stop grabber on monthly chart with minimum target – clearing of 1.2042 low. Since 1.2042 stands below 0.618 target of drawn AB=CD pattern, it’s a high probability that market will proceed to 1.17 area initially – target of AB=CD. 1.17 in turn, stands slightly lower previous long-term 2010 lows. Just imagine what will happen, if market will trigger stops below it. We easily could get achievement of our long term 1.15-1.16 target.
But let’s pass from one to another gradually. Our first task on monthly is to wait for November close. Let’s get stop grabber first and only after that will discuss other things.

Weekly
Although weekly chart is most important right now, I suspect that another week of expectation ahead, because none of major patterns were triggered. First, I’ll show you almost the same chart as on previous week – with harmonic swings and bullish flag failure. This is almost the same chart as on previous week. Analysis is also the same since it’s still relevant, so I’ve held most tools as it were on week before. There are still two things that give us assistance in understanding of situation here. First is bullish flag breakout trap two weeks ago flag, second is harmonic swings. That is just one side of the coin. Yes, if all will be smooth and market will continue move inside of channel – we will see 1.16 target. But here is another picture, that I would like to discuss with you.

Take a look at weekly chart with 25x5 DMA, look how nice it holds price action. After each breakout market retests 25x5 from the other side – as in the case of downward breakout as in the case of upward one. But look what we have now – breakout of 25x5 DMA on weekly chart and attempt to retest it. On coming week 25x5 will have 1.2649 value. Still there is a moment that increases importance of this significantly – MACDP and 25x5 come in play in the same point. That is very close to 1.27 extension of our AB-CD pattern at 1.2675 and 3/8 major support level.
Now put all this stuff in relation to weekly coil area – I’ve marked it by blue horizontal lines on the chart. And, yes, this overall picture looks as “222” buy currently. Other words, market now stands in a very tricky area. I think that it will be safe to enter short only when this potential trap will be resolved by price action. That’s why I’ve said that another week of expectation stands ahead. But this does not mean that we have to stay flat totally – of cause not, but probably we will mostly take a deal with intraday short term patterns.

Daily
Daily chart hardly will help us to understand what to expect from current support area. Although market stands slightly below K-support area, I think that it is still valid. Price has a free space now till WPS1=1.2641, since it’s not at oversold. WPS1 stands in the same area as weekly 25x5. Another moment that speaks in favor of potential downward continuation is that market has moved below 1.0 extension of AB-CD pattern, hence next destination is 1.27 that is 1.2675, especially if there are no barriers ahead. But how it could happen – will market some bounce as a respect of Confluence support first or just continue move lower – I can’t say. Looks like we will have to keep mind open and catch all potential hints and leads that could appear on intraday charts.

4-hour
Well, on 4-hour chart we have the pattern that could trigger some bounce. This is bullish wedge, that now is forming right around daily Confluence support area. Wedge is accompanied by bullish divergence as well. So, there are two destination points could be after upward breakout. First is WPP and first fib resistance at 1.2760 area, second, that is more probable is WPR1 and 4-hour Confluence resistance at 1.2805-1.2816 area – it also coincides with classical wedge target estimation as wedge height. Take a look – WPR1 conicides with classical resistance line. Also we now, that when market retracemes within long-term bear trend, it very often retraces to WPR1. After 1.0 AB=CD target there was no significant pullback, so may be it will come from here.

1-hour
Probably this wedge could be treated as 3-Drive “Buy” pattern as we’ve discussed on Friday. So, as you can see price has found support right at crossing of 1.618 level of 1st drive and 1.272 of 2nd Drive levels. That is very typical for 3-Drive pattern. Second, it accompanied by bullish divergence with MACD. Minimum target is a high of second drive – that’s coincide with Confluence resistance at 1.2805-1.2816 area and gives the same destination as previous retracement – I’ve cloned it and dragged to current price action (blue lines).
Could this pattern fail? Absolutely. If it will move below 3rd drive low, then probably we might say that market will accelerate lower without any retracements right to level that we’ve specified in analysis of Daily time frame.

Conclusion:
On longer time frames market still has to give us some clarification about medium-term direction, and nothing is clear yet.
That’s make specific impact on our analysis and trading style on coming week. Particularly speaking, we probably will mostly deal with intraday patterns inside of tight week, until any solution will come.
Thus, on Monday some pullback could follow to 1.28-1.2815 area if 3-Drive “Buy” pattern will work accordingly. IF this pattern will fail, then we should be ready to downward move in 1.2640-1.2670 area.
The technical portion of Sive's analysis owes a great deal to Joe DiNapoli's methods, and uses a number of Joe's proprietary indicators. Please note that Sive's analysis is his own view of the market and is not endorsed by Joe DiNapoli or any related companies.
