OptionLevels.com - More than 50% Discount Offer

Status
Not open for further replies.
Its funny again.
Hamid Muhammad said he received feed back, but I haven'g got any comment on my first calculation spread sheet that I sent to you.
Also there are too many support and resistance lines, so very confused what lines to use.

With respect to the support and resistance lines, that was also my source of confusion in the beginning. But, if you examine the spreadsheet carefully I think you'll figure it out. You really don't need to plot all those lines on your chart. I think at that most 4 lines should do it. You are interested in the support and resistance levels closest to the current spot price. The strike levels on the spreadsheet should be viewed as the "center of gravity" for your chart. In other words, if the current price of EUR/USD is 1.3010, then as shown on the spreadsheet 1.3000 is your "center of gravity", that is the area of focus. So, you would chart the support/resistance levels indicated for the 1.3000 region. Of course, sometimes EUR/USD will break out. If it does that then you just need to plot on your chart the levels for the new center of gravity.

Let's say in my example, EUR/USD surges through resistance which might have been at 1.3017. Now it is trading up at 1.3060. Well, in that case you switch over to the 1.3050 level in your chart to gain some visibility into the support and resistance levels in this zone.

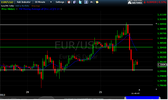
Let me try to give you a more concrete example, because this happened yesterday and I banked some money using the levels from the spreadsheet. Here's a chart I was using yesterday:
importantlevels.png

In this chart, EUR/USD was trading around 1.3000. I plotted the indicated support level from the spreadsheet with EUR/USD in the 1.3000 range. That level was 1.2994 and is the white horizontal line on the bottom. When, I saw EUR/USD fall to that level I bought EUR/USD on the belief that 1.2994 would hold as support. That is exactly what it did. So, this was indeed an "important level". This was my second trade using the levels from the spreadsheet. Again, it returned more than the cost of the spreadsheet.
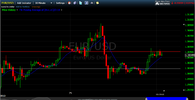
 
Here's another example which is developing as I write. Check out this chart:

eurusd-support-resistance-example.png

The spreadsheet for today shows that 1.3009 is an important resistance level for EUR/USD when it is trading around 1.3000. The bottom horizontal line on the chart marks this level. However, as shown on the chart EUR/USD has broken out of that level. The spreadsheet shows that 1.3041 is the next important level above 1.3009. This would be viewed as a resistance level. 1.3009 would now become new support. Now look at how EUR/USD behaved repeatedly when it reached the 1.3041 level. You should be able to now see that the levels indicated in the spreadsheet are meaningful.
 
Here's another example which is developing as I write. Check out this chart:

View attachment 9079

The spreadsheet for today shows that 1.3009 is an important resistance level for EUR/USD when it is trading around 1.3000. The bottom horizontal line on the chart marks this level. However, as shown on the chart EUR/USD has broken out of that level. The spreadsheet shows that 1.3041 is the next important level above 1.3009. This would be viewed as a resistance level. 1.3009 would now become new support. Now look at how EUR/USD behaved repeatedly when it reached the 1.3041 level. You should be able to now see that the levels indicated in the spreadsheet are meaningful.

Hello Hamid,

Thanks a lot for your kindness!
Now its getting clearer.
It seems the lines that I plotted were also right in that the lines you mentioned were similar with the one that I lined.
I wasn't sure because I haven't got any feed back from Dr. Ankita.
I am still waiting for any comment from her.

Thanks again for your explanation!
Its very helpful.
 
Thank you very much, Hamid. You explained it perfectly :)

nzfriendlee, its my constant endeavor to reply to all my emails within 24 hours (except on weekends, when it can take 48 hours). As far as I know I have replied to each and every mail in my inbox. If however, somehow I have missed replying to you, i apologize profusely for this inadvertent error on my part. I urge you to send an email again with your contact number. And either me or my colleague will call you and take you through the whole manual and spreadsheet over phone.

Warm regards.
Dr. Ankita
 
Important levels

Please have a look at the following chart for EURUSD today:
Chart EURUSDm, M5, 2013.04.26, Exness Ltd., MetaTrader 4, Real - MetaTrader Trading Platform Screenshots

I have plotted three nearby levels. 1.2994, 1.3009 and 1.3041 - all these levels were generated yesterday after New York close.
Have a look, how many time EURUSD reacted at these levels. And even a day on which EURUSD has not moved much yet, these levels have provided us opportunity to scalp a handful of pips.

Looking forward to your comments/questions.

Regards.
Dr. Ankita
 
Note that this information is readily available for FREE for anyone who's interested in Option Levels.

Check the CME Group website (www.cmegroup.com), which is the source for obtaining Option Levels data for EURUSD, GBPUSD and alot more instruments (including emini's).

Cheers, S.
 
Please have a look at the following chart for EURUSD today:
Chart EURUSDm, M5, 2013.04.26, Exness Ltd., MetaTrader 4, Real - MetaTrader Trading Platform Screenshots

I have plotted three nearby levels. 1.2994, 1.3009 and 1.3041 - all these levels were generated yesterday after New York close.
Have a look, how many time EURUSD reacted at these levels. And even a day on which EURUSD has not moved much yet, these levels have provided us opportunity to scalp a handful of pips.

Looking forward to your comments/questions.

Regards.
Dr. Ankita

Thank you Ankita!
The S/R lines I produced are in line with yours.
That means I can understand how it works and how to plot.
It seems great tool. I have tried with Demo for last couple of days, and the result was great.
Regarding reply, for some reason I could not receive any comments from you.
Maybe email provider problem??
I will try to send you through another email.

Thanks Dr Ankita.
 
What is the purpose of entering 'prior day open interest' into the spreadsheet? - It seems to have no bearing on the calculation of the levels.
 
What is the purpose of entering 'prior day open interest' into the spreadsheet? - It seems to have no bearing on the calculation of the levels.

To gauge the strength of the level. And ignore any level with less than 100 open interest.

Please email me if you have further questions and you need support.

Regards.
Dr. Ankita
 
Status
Not open for further replies.
Back
Top