Sive Morten
Special Consultant to the FPA
- Messages
- 18,621
Trade Description
October 29, 2009
October 29, 2009
I am adding a new feature. I will be describing some of the trades I place. You can follow these trades here.
Sive Morten Signals - Forex Trading Signals Test by Forex Peace Army
Buy EUR/USD 1.4706 s/l 1.4695 t/p 1.4755 (1.0 lot).
Result : manual close at 1.4744 “+377$”
Well, this was an 1Hour basis – 5 min enter trade. Let’s go through it…
1. Context
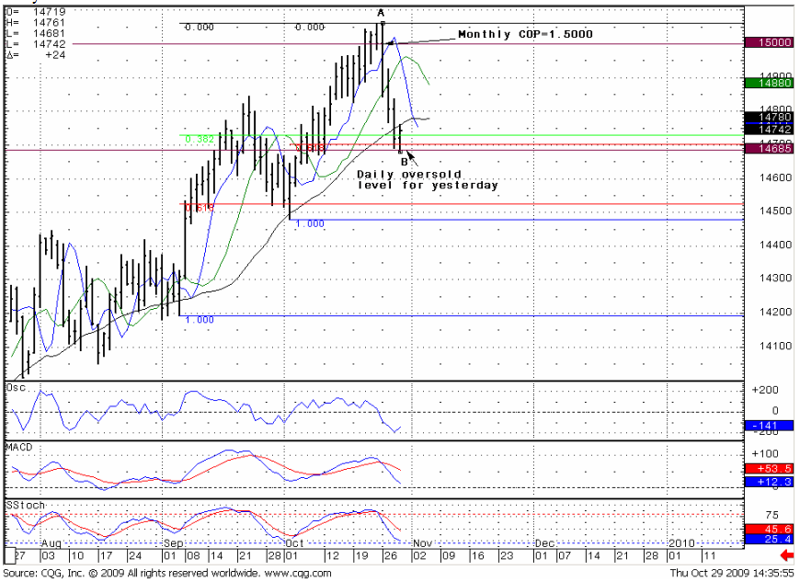
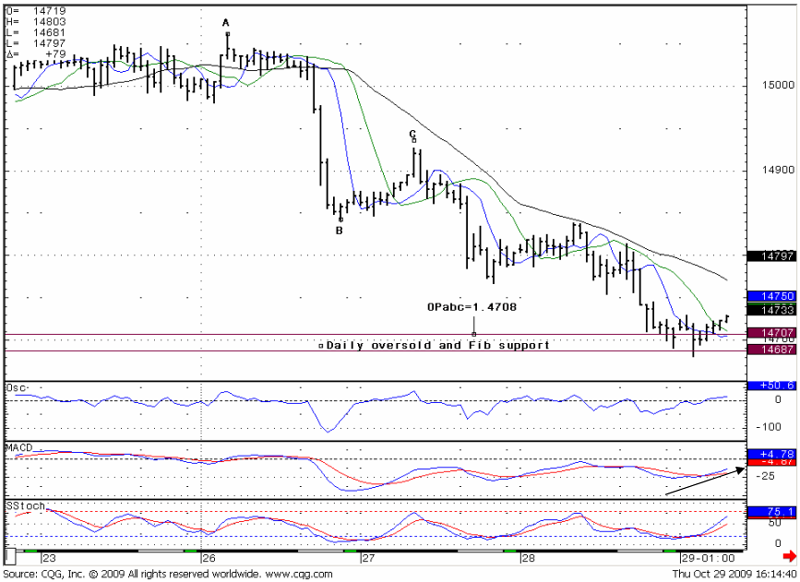
Context was described in details in my Weekly Research (I did that trade in the morning) (European Forex Professional Weekly Signal for October 29, 2009 - Forex Peace Army Forum). We had a strong support level at 1.4686-1.4707. First, 1.4686 was a predetermined extreme daily oversold level. Second around 1.47 was a conjunction of daily Fib support levels. Third, 1.4708 – target (objective point, based on Fib expansions) of hourly chart move. These three things have built a strong support, and I’ve expected that market will retrace from there.
Daily chart
Hourly chart (at the moment, when I look at it)
At Hourly chart trend was up, no overbought level, so I have needed a level to enter the market on the buy side – I needed a retracement on a 5 minute chart.
5 minute chart
There was a rather deep retracement. I enter at 0.618 support when market reversed already from that level. Usually I wait for retracement after first up move from the level, but in the current trade I’ve entered at once, because of the great oversold level at 5 min. There was a little probability that the market could go significantly lower, besides, it was last 0.618 Fib support. If it didn’t stand, I can get a move to 1.4686-1.4707 again and hourly trends turn bearish then.
But this situation was within my scenario and the market has shown strong upside move. Due to this retracement I‘ve calculated targets, and had chosen OP abc = 1.4755, because COP was too near (the hourly trend was up), and XOP too far (it was higher than some resistance levels). Besides, I had a solid (but not extreme) overbought level on the hourly chart.
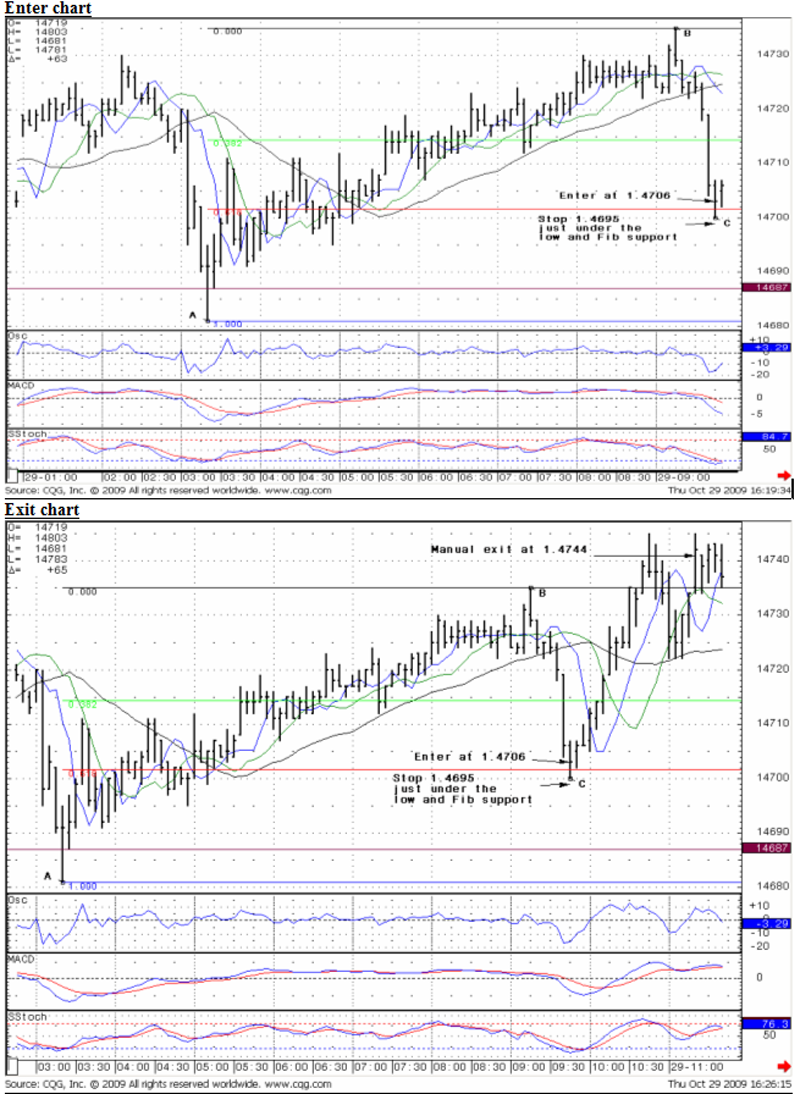
Exit
When I've saw that the market had shown a possibility of not going higher (look at exit chart), I took a look at hourly overbought level, it was high. There was not too much till 1.4750 and I’ve decided to close the trade. But even If I had kept it, the market reached an OP=1.4755 after some retracement. May be this was a single mistake – too hasty to close the deal, but who can know for sure, besides, I had good reasons to close it.
Sive.