Ricex
Sergeant
- Messages
- 358
Hi, hope your all enjoying your turkey or whatevers on the table at your place.
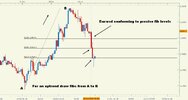
I just thought I'd post this chart of todays eur/usd as an example of how Fibonacci ratios can sometimes help us to determine potential support and resistance levels of a retracement.

So looking at the hourly chart we have an initial upward move from point A to point B.
We decide because of certain other factors, a resistance level or an over bought indicator for example, that point B is a swing high and point A is our previous swing low.
As the retracement begins we can apply our Fib trendline. In this case, as it is in an uptrend we drag the fib from bottom to top. A downtrend retracement would have us drag from top to bottom.
Now we have plotted on the chart 'potential', and I do highlight this, it is not guaranteed, support levels for a move higher following the trend.
You can see today that it has used all three levels nearly to the pip. The 61.8% line, (the most useful in my opinion) has also given us a lovely hourly doji candle which can signal a change of direction, so all in all a long trade placed at 1.4987 would have many factors in it's favour.
This is just an example for the purposes of illustrating Fibonacci retracements and should not be used as a trade signal.
I just thought I'd post this chart of todays eur/usd as an example of how Fibonacci ratios can sometimes help us to determine potential support and resistance levels of a retracement.

So looking at the hourly chart we have an initial upward move from point A to point B.
We decide because of certain other factors, a resistance level or an over bought indicator for example, that point B is a swing high and point A is our previous swing low.
As the retracement begins we can apply our Fib trendline. In this case, as it is in an uptrend we drag the fib from bottom to top. A downtrend retracement would have us drag from top to bottom.
Now we have plotted on the chart 'potential', and I do highlight this, it is not guaranteed, support levels for a move higher following the trend.
You can see today that it has used all three levels nearly to the pip. The 61.8% line, (the most useful in my opinion) has also given us a lovely hourly doji candle which can signal a change of direction, so all in all a long trade placed at 1.4987 would have many factors in it's favour.
This is just an example for the purposes of illustrating Fibonacci retracements and should not be used as a trade signal.