Forex FOREX PRO WEEKLY, December 10-14, 2018

Update on EUR.

I am dropping my bullish view and looking for short entries.

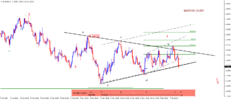
Here is wave count what i think is going on in the moment. I believe we are in bearish wave 3 of wave 3 of wave 3. All upside action was only retracement made by some recent news and events, and I think EUR is now finally ready to go significantly lower. Brexit news still very important.

4H CHART:

EURUSDkH4.png


How to trade this?

Short entry zone=1.1350-1.1380, TP zone=1.1185-1.1236, SL=1.1401
 
Hi Guys,

Been away for a couple of days.

In reliance of my maroon wave count of last week I set orders to close my longs and initiate new shorts at 1.1435. Both were activated as I slept on Monday morning, so I am feeling quite pleased with myself.

But Triangles can be very difficult.

Because my maroon wave e gave a throw over past my a c trendline then I think this supports my wave count, in which case my next target is around 1.1190.

However having seen that the last two days price action also looks like a zig zag I have to consider my alt black wave count for the triangle as a possibility and this would suggest a move up in accordance with Stag's forecast.

So I have closed half my position and adjusted my stop loss. The worst case scenario for my shorts (barring market gaps/slippage) is a positive RR ratio of 0.8. I will however be looking for an opportunity to add a further short if the reaction to todays drop looks corrective
 

Attachments

  • EURUSDH4  ar 18 12 11.png
    EURUSDH4 ar 18 12 11.png
    45.1 KB · Views: 1

Update on EUR.

In my previous post I showed bearish wave count. However, I want to show this bullish wave count which is very much alive as long as 1.1266 and 1.1213 supports hold. 1.1213 is ultimate support for bullish scenario.

EUR is very tricky in the moment, but I am more bearish then bullish.

EURUSDkH4.png


How to trade this?

Long entry in zone=1.1280-1.1350, TP1 zone=1.1475-1.1526, TP2 zone=1.1680-1.1750, SL1=1.1265, SL2=1.1213
 
Last edited:
Morning guys,

So, it seems that our suggestion yesterday was correct. Indeed, market has collapsed and major driving factor was rising US long-term yields, which provides support to the dollar. Of course, long-term tale of Brexit and Strasbourg tragedy definitely do not bring any optimism to investors as well.

Now, as we stand just 1 day from ECB meeting, would we like it or not, but we need to make some forecast. Personally, I gravitate more to dovish ECB opinion on 2019 and will not be surprised, if they even will change rhetoric about first rate increase in 2019. On a back of France strike, that is far from the end still, difficult situation of Italy budget agreement and tricky political situation in core EU countries - is difficult to expect brave relations on rate hike. But, this is just MHO.

Thus, our daily setup stands valid. Besides, we do not have any solid support below market right now. All Fib levels were broken and market is far from oversold. Now price holds on WPS1. Thus, we keep our daily view intact:
eur_d_12_12_18.png


On 4H chart market stands at the bottom line of triangle, so, it's breakout could happen soon, taking in consideration preceding collapse:

eur_4h_12_12_18.png


Finally, on 1H we have H&S shape, fast drop and reaching of OP target. Upside pullback could happen as a reaction on target and WPS1. Taking in consideration harmonic swings - it seems that K-resistance around 1.1350 area should become the good one for taking bearish position. May be some patterns later will appear as well:
eur_1h_12_12_18.png
 
It was the scalpers paradise this week. Status quo for other traders. The last weeks low 1.126x was never seriously tested this week. The monthly/weekly close at 1.1322 gave good support the whole week. The week and day close higher so no reason to keep any short since the rule is that the last day and week will be tested during next period (24hr or week). Since the days high is equal with weeks high it will in this case happen in same time.
A nice play during evening/ or next week could be to sell the fade of this move. Bears have a small setup for 1.1245 If 1.147x will survive.

If long from the low it is time to move the SL. November close lower, being below and closing the month above is a rejection that bulls will have to defend remaining of the month.

1.1322 still defended. Yesterdays close was 1 pip above, but it seems to be a difficult task to protect, since the November monthly close was lower it suggest to test the low within next period( December).
 

Attachments

  • E3C217A5-0245-4189-9D84-4AAB60541F6D.png
    E3C217A5-0245-4189-9D84-4AAB60541F6D.png
    186.6 KB · Views: 0
Important update on EUR.

I believe I finally have right wave count for EUR. I think this is most probable scenario to happen. EUR is bullish, just currently in bearish retracement which I expect to finish in 1.1235-1.1255 zone. I am saying that 1.1266 support will be broken, but that does not change bullish story for EUR. 1.1213 support is vital! All stops should be places under it, not above it.

4H:

EURUSDkH4.png


15 MIN:

EURUSDkM15.png


How to trade this?

First position: sell entry in zone 1.1330-1.1340, SL=1.1401, TP zone = 1.1240-1.1255
Second position: buy entry in zone = 1.1240-1.1270, SL=1.1212, TP zone = 1.1525-1.1750
 
Morning guys,

As usual - Stag is the best. While we're flirting up and down, he identifies the shape correctly! Good work.

Anyway, EUR behavior is rather tricky right now, it is mostly driven by external factors. While T. May has got support in Parliament, markets show positive reaction. This stuff is really difficult to predict. As a result we've got bullish grabber on daily chart, that suggests upside action back to 1.1450 area and taking out of recent top.
This in general agrees with Stag analysis. I do not know how this scenario works at ECB statement, but right now we have to cancel bearish context due to impact of external political factors.
eur_d_13_12_18.png


On 1H chart we see that our 1.1355 level, where we've taken short positions was really strong resistance, as a lot of struggle around it happened. Two pullbacks for 25 pips was enough to move stops to b/e. This is why we always choose strong levels for position taking. If even you're wrong - you have the chance to out without loss.
So, hourly chart also shows price behavior that doesn't correspond to normal bullish market. Too strong upside reaction that almost erase recent sell-off. "C" point is important for short-term picture. If market will climb above it - it cancels AB-CD pattern and creates upside reversal swing. Potentially we could get reverse H&S pattern here and "222" Buy. These are things to watch for today for those who wants to go long on EUR. The most difficult factor to take in consideration is ECB of course...
eur_1h_13_12_18.png
 
Thanks as i c u r not expecting sub1.13 levels in short terms at all.

I always have an alternate scenario, but considering the larger decline, the bearish triangle scenario simply does not fit into the sequence we see unfolding off 1.1815. Does not necessarily mean it can't be, just my "wavy eyes" make me think it can't be bearish.

Regarding the alternate, at a minimum, I'd look for a wave D. Once we have it completed, a drop below wave C at 1.1306 would be needed to suggest the bullish view failed and we have a bearish one instead - that's my alternate scenario.

Sticking to the primary, let's take a closer look at what may unfold and why (along with a nice example of the KCT technique):

EU_181213_h1_triangle.gif
 
Back
Top