Sive Morten
Special Consultant to the FPA
- Messages
- 18,644
Fundamentals
Gold finally turns to action that we were waiting for since the moment when it has hit XOP weekly target. On previous two weeks bearish strength was held by external political factors support, but as soon as we've got easing as in Venezuela as in Pakistan-India conflict, market turns to its own internal factors and starts to behave naturally.
As Reuters reports - gold prices on Friday fell more than 1 percent to their lowest since the January, headed for their biggest weekly decline in more than 1-1/2 years, as the dollar strengthened and global stock advances spurred risk-taking.
“The U.S. dollar index and two-year Treasury yields have moved up over the last couple of days and these factors have prompted people to take some profits (in gold),” said Bart Melek, head of commodity strategies at TD Securities in Toronto.
“We are also seeing a continued reaction to Federal Reserve statements where hikes are still on the menu, given that data seems to be fairly strong in the United States.”
Better-than-expected U.S. gross domestic product data on Thursday boosted Treasury yields, making non-yielding bullion less attractive.
The data also helped lift the dollar to a 10-week high against the Japanese yen earlier in the session.
Higher global stocks also weighed on gold, analysts said.
“Better sentiment on the stock markets and a reluctance by the physical gold investors are weighing on its price,” Commerzbank analysts said.
Reflecting investor appetite for bullion, holdings of the SPDR Gold Trust, the world’s largest gold-backed exchange-traded fund, on Thursday fell to their lowest since late December.
Indeed drop in holdings is significant - more than 30% since the lows in October 2018. Gold price hasn't drop so strong:

CFTC is still running up their to current day by publishing two reports per week. But still they are historical reports by far. The last one is dated of 19th of February. Currently we can't take a look on how open interest has changed and what particular has happened - either positions were closed or this is new positions have come to market.
Let's treat it as short-term bearish sentiment, as it is coincides with our technical view as well.
One of the most important factors on the market that makes impact not only on gold but on FX and all markets across the board, is US-Sino tariffs relations.
Fathom consulting provides new report on this subject that could shed some light on perspective.
US President Donald Trump has again postponed a further increase in tariffs levied on China, with the aim of agreeing a more lasting truce at a summit in March. Precise details of the circumstances that led to the postponement are as yet unclear, but reports suggest that China has promised to import more agricultural goods from the US, and to eschew competitive devaluations.
In response to this, we took a reading of Fathom’s China Exposure Index (CEI), which tracks the equity performance of US companies with high exposure to China. It is constructed using a selection of 25 US-listed corporations that derive more than 15% of their revenues from China. We found that movements in the CEI have been muted, suggesting that investors are not expecting substantially easier access for US firms to Chinese markets. Nonetheless, the CEI has increased quite a lot since the end of last year, when Sino–US trade tensions were at their fiercest.

The Shanghai A Share Index rose 5.6% on Monday following the news, compared with a 0.1% gain for the S&P 500, suggesting that, from the perspective of investors, the postponement means more to China than it does to the US. That view aligns with our own analysis that shows the Chinese economy would suffer more from an increase in trade tension with the US.
We believe that a deal is likely to be signed, but we caution against the idea that we will see a material improvement in Sino–US relations. China’s economic clout has increased markedly over the past 20 years, and it will probably overtake the US as the world’s largest economy (at market exchange rates) at some point in the future. As a result, the US and China seem to be embarking on a long period of strategic rivalry. Trade tensions are just a symptom of that. The battle for future technological supremacy is another. Taken together, it will mean a new normal of higher uncertainty for global investors.

Indeed recent situation with Huawei CEO as she was arrested in Canada and extradited to US proves that this is just a beginning and tensions are far from final resolving. Besides, we expect to see the same situation with US-EU trade relationships.
Thus, by fundamental analysis of this week we think that investors react on most recent events, ignoring or muting temporary the long-lasting effect of major factors, such as global shift of political balance in the world. In fact, all events that we see are results of this shift. This is the reason why we think that current drop is a retracement on gold market and gold might stand in the beginning of long-term global upside trend.
Technical
Monthly
Despite that drop looks solid on lower time frames, it barely makes impact here, on monthly chart, which represents our long-term idea mostly, about new long-term trend.
As we've said earlier, we're watching for our so called "symmetrical" model. It could be clear symmetry in market action, and we have suggested that future action could be a reflection of previous downside action shape.Now market has moved more above the trend line, which was a crucial level for long-term technical picture.
Gold shows good performance in December- February, which could put the foundation of new long-term upside trend. We still keep our harmonic technical model on monthly chart as primary tool of analysis.
Fundamental reasons for gold rising mostly relate to changing of global political and economical situation. Strong global shifts never could happen without big political events. This should provide big support to gold market. Now it is widely suggested that these processes should accelerate closer to 2020 year, or even in second half of 2019. For example, here is report by Fathom Consulting and their expectations to see world crisis around 2020.
Here is explanation of our "symmetrical" model and scenario. Recent action on gold market reminds reverse H&S shape but very choppy and extended it time. Important COP target has been hit and upside action has started. In fact we have mirror action to the right and to the left from COP point. Market forms approximately equal lows on both sides. The speed is also similar. Is it possible that reversal is forming? Why not.
On monthly chart we keep watching whether gold will be able to hold above trend line. Now price stands above YPP as well, but it has not been tested yet by price. As meaningful retracement stands under way - YPP should work as nearest destination point.

Weekly
Last week we already mention "222' Sell pattern and our expectation of reversal. Recent week shows that it was rather sharp. Price stands not at oversold. Here, in fact, we have two different setups that could either coincide in single trade or work separately.
By Dinapoli framework, we should get B&B "Buy" pattern from one of the major support levels, as upside thrust from "c" point is sufficient for this trade. Gold already has closed below 3x3 DMA and almost has hit major 3/8 Fib support.
At the same time we have "222" Sell which suggests drop at least to 1275 Fib support, but I would say it should be somewhere 1270, as YPP stands at 1269. And now it is a question whether this will be two different trades - gold shows reaction first on 1290 area by B&B setup and then drop to 1270 or, it will drop to 1270 area and B&B will start from there...
The strength of the drop makes us feel a bit uncomfortable with long entry here. So we need to get some more bullish signs on lower time frames, or deny this idea and wait for another leg down first.

Daily
So let's take a look what chances on pullback we have here, on daily chart... Chances are not bad, actually. Market dropped deep in oversold area and stands around K-support area. Besides, instead of H&S pattern that we've anticipated initially, we've got bearish reversal swing.
Previous rally lasts long time and bullish momentum that stands on the market is good backer of deep upside retracement. So, I would say that chances on upside bounce from K-area are not hopeless.

Intraday
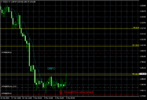
Although we're not dared to suggest that gold will hit our XOP target so fast. As you remember on Friday we talked only about 1317 OP, but in reality collapse was unstoppable.
Thus, XOP target has been hit. Momentum here is strong, so price could slip a bit lower just by inertia.
Anyway, overall background looks positive for potential upside action and B&B trade. Its target stands at 1325 Fib resistance.
As market stands at strong K-support and Agreement, daily Oversold, the only one thing we need to take this trade - bullish reversal pattern on 1H time frame, which yet to be formed. Now we have nothing as gold just has reached this area.

Conclusion:
In longer term perspective, it seems that all economies that were previously flagman of global grows - have fundamental problems. This should support healthy demand on gold market and brings more confidence to our suggestion that may be we see now new long-term bull trend starting... Second driving factor is political unrest which also provides good support to gold.
Still, in shorter-term we work with downside retracement that could last for few weeks.
The technical portion of Sive's analysis owes a great deal to Joe DiNapoli's methods, and uses a number of Joe's proprietary indicators. Please note that Sive's analysis is his own view of the market and is not endorsed by Joe DiNapoli or any related companies.
Gold finally turns to action that we were waiting for since the moment when it has hit XOP weekly target. On previous two weeks bearish strength was held by external political factors support, but as soon as we've got easing as in Venezuela as in Pakistan-India conflict, market turns to its own internal factors and starts to behave naturally.
As Reuters reports - gold prices on Friday fell more than 1 percent to their lowest since the January, headed for their biggest weekly decline in more than 1-1/2 years, as the dollar strengthened and global stock advances spurred risk-taking.
“The U.S. dollar index and two-year Treasury yields have moved up over the last couple of days and these factors have prompted people to take some profits (in gold),” said Bart Melek, head of commodity strategies at TD Securities in Toronto.
“We are also seeing a continued reaction to Federal Reserve statements where hikes are still on the menu, given that data seems to be fairly strong in the United States.”
Better-than-expected U.S. gross domestic product data on Thursday boosted Treasury yields, making non-yielding bullion less attractive.
The data also helped lift the dollar to a 10-week high against the Japanese yen earlier in the session.
Higher global stocks also weighed on gold, analysts said.
“Better sentiment on the stock markets and a reluctance by the physical gold investors are weighing on its price,” Commerzbank analysts said.
Reflecting investor appetite for bullion, holdings of the SPDR Gold Trust, the world’s largest gold-backed exchange-traded fund, on Thursday fell to their lowest since late December.
Indeed drop in holdings is significant - more than 30% since the lows in October 2018. Gold price hasn't drop so strong:
CFTC is still running up their to current day by publishing two reports per week. But still they are historical reports by far. The last one is dated of 19th of February. Currently we can't take a look on how open interest has changed and what particular has happened - either positions were closed or this is new positions have come to market.
Let's treat it as short-term bearish sentiment, as it is coincides with our technical view as well.
One of the most important factors on the market that makes impact not only on gold but on FX and all markets across the board, is US-Sino tariffs relations.
Fathom consulting provides new report on this subject that could shed some light on perspective.
US President Donald Trump has again postponed a further increase in tariffs levied on China, with the aim of agreeing a more lasting truce at a summit in March. Precise details of the circumstances that led to the postponement are as yet unclear, but reports suggest that China has promised to import more agricultural goods from the US, and to eschew competitive devaluations.
In response to this, we took a reading of Fathom’s China Exposure Index (CEI), which tracks the equity performance of US companies with high exposure to China. It is constructed using a selection of 25 US-listed corporations that derive more than 15% of their revenues from China. We found that movements in the CEI have been muted, suggesting that investors are not expecting substantially easier access for US firms to Chinese markets. Nonetheless, the CEI has increased quite a lot since the end of last year, when Sino–US trade tensions were at their fiercest.
The Shanghai A Share Index rose 5.6% on Monday following the news, compared with a 0.1% gain for the S&P 500, suggesting that, from the perspective of investors, the postponement means more to China than it does to the US. That view aligns with our own analysis that shows the Chinese economy would suffer more from an increase in trade tension with the US.
We believe that a deal is likely to be signed, but we caution against the idea that we will see a material improvement in Sino–US relations. China’s economic clout has increased markedly over the past 20 years, and it will probably overtake the US as the world’s largest economy (at market exchange rates) at some point in the future. As a result, the US and China seem to be embarking on a long period of strategic rivalry. Trade tensions are just a symptom of that. The battle for future technological supremacy is another. Taken together, it will mean a new normal of higher uncertainty for global investors.
Indeed recent situation with Huawei CEO as she was arrested in Canada and extradited to US proves that this is just a beginning and tensions are far from final resolving. Besides, we expect to see the same situation with US-EU trade relationships.
Thus, by fundamental analysis of this week we think that investors react on most recent events, ignoring or muting temporary the long-lasting effect of major factors, such as global shift of political balance in the world. In fact, all events that we see are results of this shift. This is the reason why we think that current drop is a retracement on gold market and gold might stand in the beginning of long-term global upside trend.
Technical
Monthly
Despite that drop looks solid on lower time frames, it barely makes impact here, on monthly chart, which represents our long-term idea mostly, about new long-term trend.
As we've said earlier, we're watching for our so called "symmetrical" model. It could be clear symmetry in market action, and we have suggested that future action could be a reflection of previous downside action shape.Now market has moved more above the trend line, which was a crucial level for long-term technical picture.
Gold shows good performance in December- February, which could put the foundation of new long-term upside trend. We still keep our harmonic technical model on monthly chart as primary tool of analysis.
Fundamental reasons for gold rising mostly relate to changing of global political and economical situation. Strong global shifts never could happen without big political events. This should provide big support to gold market. Now it is widely suggested that these processes should accelerate closer to 2020 year, or even in second half of 2019. For example, here is report by Fathom Consulting and their expectations to see world crisis around 2020.
Here is explanation of our "symmetrical" model and scenario. Recent action on gold market reminds reverse H&S shape but very choppy and extended it time. Important COP target has been hit and upside action has started. In fact we have mirror action to the right and to the left from COP point. Market forms approximately equal lows on both sides. The speed is also similar. Is it possible that reversal is forming? Why not.
On monthly chart we keep watching whether gold will be able to hold above trend line. Now price stands above YPP as well, but it has not been tested yet by price. As meaningful retracement stands under way - YPP should work as nearest destination point.
Weekly
Last week we already mention "222' Sell pattern and our expectation of reversal. Recent week shows that it was rather sharp. Price stands not at oversold. Here, in fact, we have two different setups that could either coincide in single trade or work separately.
By Dinapoli framework, we should get B&B "Buy" pattern from one of the major support levels, as upside thrust from "c" point is sufficient for this trade. Gold already has closed below 3x3 DMA and almost has hit major 3/8 Fib support.
At the same time we have "222" Sell which suggests drop at least to 1275 Fib support, but I would say it should be somewhere 1270, as YPP stands at 1269. And now it is a question whether this will be two different trades - gold shows reaction first on 1290 area by B&B setup and then drop to 1270 or, it will drop to 1270 area and B&B will start from there...
The strength of the drop makes us feel a bit uncomfortable with long entry here. So we need to get some more bullish signs on lower time frames, or deny this idea and wait for another leg down first.
Daily
So let's take a look what chances on pullback we have here, on daily chart... Chances are not bad, actually. Market dropped deep in oversold area and stands around K-support area. Besides, instead of H&S pattern that we've anticipated initially, we've got bearish reversal swing.
Previous rally lasts long time and bullish momentum that stands on the market is good backer of deep upside retracement. So, I would say that chances on upside bounce from K-area are not hopeless.
Intraday
Although we're not dared to suggest that gold will hit our XOP target so fast. As you remember on Friday we talked only about 1317 OP, but in reality collapse was unstoppable.
Thus, XOP target has been hit. Momentum here is strong, so price could slip a bit lower just by inertia.
Anyway, overall background looks positive for potential upside action and B&B trade. Its target stands at 1325 Fib resistance.
As market stands at strong K-support and Agreement, daily Oversold, the only one thing we need to take this trade - bullish reversal pattern on 1H time frame, which yet to be formed. Now we have nothing as gold just has reached this area.
Conclusion:
In longer term perspective, it seems that all economies that were previously flagman of global grows - have fundamental problems. This should support healthy demand on gold market and brings more confidence to our suggestion that may be we see now new long-term bull trend starting... Second driving factor is political unrest which also provides good support to gold.
Still, in shorter-term we work with downside retracement that could last for few weeks.
The technical portion of Sive's analysis owes a great deal to Joe DiNapoli's methods, and uses a number of Joe's proprietary indicators. Please note that Sive's analysis is his own view of the market and is not endorsed by Joe DiNapoli or any related companies.