Sive Morten
Special Consultant to the FPA
- Messages
- 18,628
Fundamentals
So, guys,it seems that retracement that we've talked about for 3-4 weeks as market was coiling around major monthly targets, stands under way. Positive retail sales data that we've mentioned yesterday in our FX report also adds more pressure on gold and investors finally start to fix profit.
As Reuters reports - Gold prices eased on Friday, heading for a third straight weekly fall, as positive U.S. retail sales data and hopes for a thaw in China-U.S. trade tensions lifted equities and yields to multi-week highs.
“With better-than-expected data along with a rise in global equity markets, we are seeing gold fall off its earlier highs. Optimism about trade has led to a bounce in global equities and lesser need for safe-haven commodities such as gold,” said David Meger, director of metals trading at High Ridge Futures.
“Underlying theme of global central bank easing continues to be a supportive factor for gold on the one side and you have some pressure coming from global equities and better prospects of trade.”
U.S. Treasury yields rose across the board after data showed U.S. retail sales rose in August, suggesting the risk of recession in the world’s largest economy continues to diminish.
Global shares also climbed to a six-week high on further signs of progress in U.S.-China trade talks and added stimulus from the European Central Bank.
Washington and Beijing have both made conciliatory gestures in recent days, further boosting the risk appetite in markets.
Investors are now awaiting the U.S. central bank meeting next week, when it is expected to cut its benchmark interest rate by at least 25 basis points for the second consecutive time.
Analysts said that dovish monetary policy adopted by global central banks along with concerns of a glut in negative-yielding government debt globally will continue to support bullion in the longer term.
“Gold is going to remain around these levels or drift higher. Gold is actually paying more than any other 30-year bond, and every small move actually pays more than bonds,” said an analyst based in New York.
CFTC data shows that speculators cut some longs and gold has dropped a bit from its ultimate net long top:

source: cftc.gov
Charting by Investing.com
Taking in consideration the scale of the monthly target and importance of fundamental background - retracement on gold market should be extended as in time as in price value. In fact, gold now stands under two impacts. First is better than expected US data and good US economy performance in general, second - overvaluation of US/China tariffs impact on economy. Yesterday we briefly hint on this subject in FX report, arguing where is negative impact on US economy as tariffs first time were imposed in March 2018, more than the year ago.
Today we dig this topic a bit deeper. Once tariffs were imposed we said - this is the tool in the hands of US to make financial pressure on China and this tool serves only to its master, despite that China tries to do the same. Recent US and China statistics confirms this. While US stats looks nice, we can't say this about China situation and Fathom consulting agrees, showing this in recent report.
First, is US export companies that get most part of revenue on export shows surprisingly better results, while tariffs have become tougher.
Fathom’s China Exposure Index (CEI) measures the equity performance of US companies that have a significant sales presence in China. It includes companies that derive greater than 15% of their revenue from China, with their equity prices measured against relevant sector benchmarks. Firms with a higher revenue share have a greater weight in the index. Since 2018, when the US first announced tariffs on imports from China, the index has ebbed and flowed, posting gains when Sino–US trade tensions have eased and vice versa.
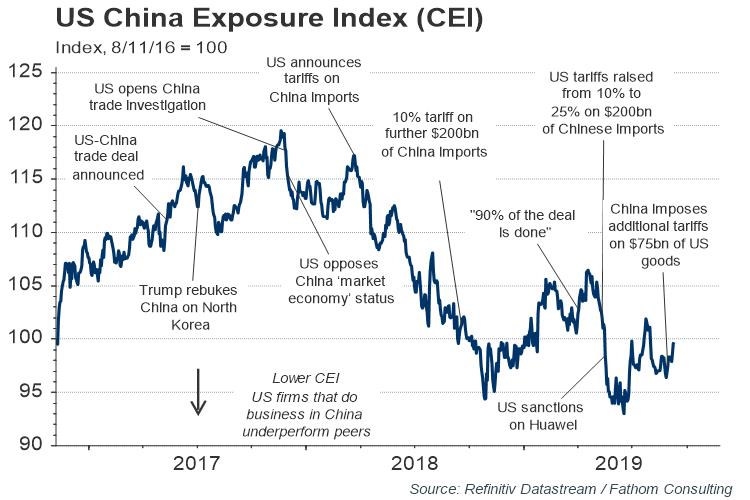
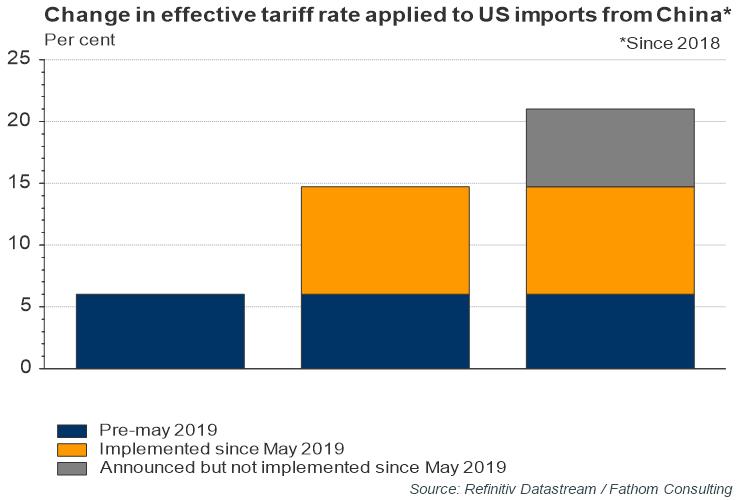
The resilience of the index since May, after trade talks broke down, has been somewhat surprising. The CEI has declined by just 5% since then — a relatively modest amount considering that the US has significantly increased the effective tariff rate on Chinese imports in the intervening period, and China has also announced retaliatory measures. Under current policy, by the end of the year, the effective tariff rate on US imports from China will have increased by 21 percentage points since 2018. Of that potential increase, 9 percentage points has been implemented since May, with another 6 percentage points due to come in by the end of the year.
There are a couple of possible explanations for the relative strength of the CEI given recent tariff increases. It is possible that investors believe that looming duties on popular consumer products coupled with the US election cycle will hasten a last minute ‘deal’. Alternatively, investors may believe that the stimulus enacted by Chinese officials so far this year, including interest rate cuts and an apparent end to deleveraging, will be sufficient to shore up growth, helping US firms with a large presence there.
Notwithstanding some signs of thaw in recent days, the bigger story is that US trade policy is being driven in part by national security and geopolitical concerns that are unlikely to go away anytime soon. Trade tensions are secular, not cyclical risks.
Meanwhile, our own estimate of China’s economy points to a sustained slowdown leaving economic growth significantly below official estimates, despite new policy measures intended to shore up activity. All told, the risks to the CEI appear to be skewed to the downside.
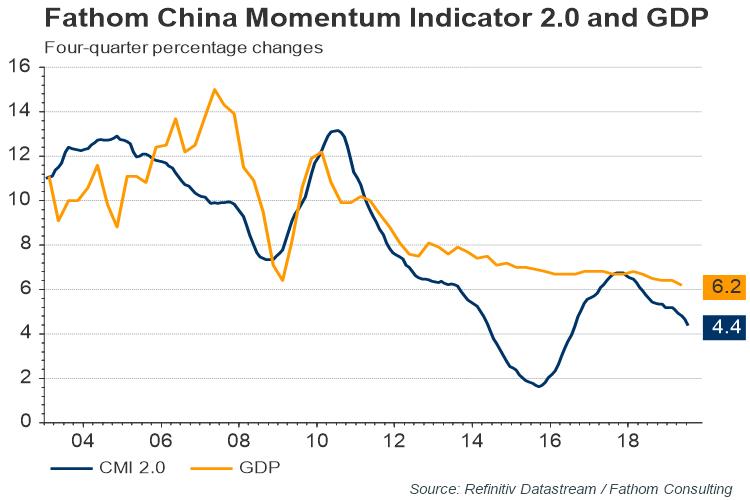
Contrary to some, we do not believe that this slowdown reflects a strategic decision by China to rebalance the economy at a time when any negative impact on growth can be blamed on US trade sanctions. Indeed, it is happening despite of a lack of ‘rebalancing’. Recent measures of consumer appetite reinforce the message. Real retail sales growth — one of the ten components of our CMI 2.0 — fell to a record low in April 2019. This point is further supported by Fathom’s China Growth Strategy (CGS) indicator — a measure of old- versus new-model growth. The assumption behind the CGS and its subcomponents is that new-model growth should be driven less by credit and investment, with the consumer picking up the slack as the economy tilts towards more advanced-model growth. The CGS indicator has shown that progress on both the credit and investment front waned last year; evidence of a more consumer-driven economy was also absent. So long as China continues to prioritise growth over reform, meaningful rebalancing remains a distant prospect.
This data shows that while US feels good, keeping around 2% GDP growth, low unemployment and moderate inflation around 1.5%, China meets problems and fast slowdown on economy despite Beijing efforts to devalue national currency and support export. This confronts to common view of coming strong negative impact on US economy, which is one of the major long-term driving factors for gold market. It seems that markets also start understand that and re-balance investments in favor of more hesitant gold growth.
Besides, slowly but we come to the end of financial year in November. Gold has shown outstanding results this year and profit has to be fixed. So, this is third factor that support our suggestion of retracement on gold market.
Technical
Monthly
Gold market starts confirmation of our major resistance area showing inability to break it immediately.
Area of major 5/8 Fib resistance level at 1585 and monthly Overbought, accompanied by butterfly extension create solid barrier on a way up. Thus, although XOP target probably will be reached some day, but now odds suggest retracement.
Thus, we still keep this area - 1530-1585 as tactical ceil at current moment and expect that gold will show healthy retracement out there by fundamental reasons that we've mentioned.
Butterfly target has been hit relatively fast. Pattern itself suggests 3/8 retracement as minimal target. Hardly butterfly will fail as it is accompanied by Overbought and major Fib resistance level.

Weekly
Weekly picture keeps door open for different scenarios of retracement. We already have here Reversal week and first close below 3x3 DMA which makes possible appearing of B&B "Buy" setup around 1450 level. In fact, 1450 is our short-term target, as it is accompanied by weekly oversold and hardly gold will break it fast.
But, also we can't exclude DRPO "Sell" here. Recall that we still have our secondary XOP target untouched, and after minor downside action, as we already have 1st close below 3x3 DMA, we could get final spike to 1570 area and second top of DRPO "Sell" pattern. These are scenarios for nearest perspective.
In more extended view, our minimal target is 1360-1400 area of K-support that includes major monthly Fib support area. This is minimal target for monthly butterfly pattern. Also if you build levels from other reaction points - you'll get different Fib levels but all of them stand around this range. So, this is rather strong support cluster.

Daily
Daily time frame is the one where we will control the progress. Here we have H&S pattern, that we've traded last week as well. It has two vital points. First is - the top of right arm, i.e. "C" point, its invalidation level. If somehow, say by Fed statement, market turns up from neckline and break C point - it means that H&S stands just one step from the failure and we will get rally to weekly XOP of 1566 and, consequently DRPO "Sell" pattern on weekly chart.
Conversely, at least like it looks right now, normal H&S progress will drop gold to OP target at 1450 and K-support (recall that 1447 is 3/8 Fib level on weekly), weekly oversold and - weekly B&B "Buy" setup. This will be first leg down.
Gold maybe is a difficult to trade market guys, but when it starts forming patterns - they looks perfect and very harmonic.

Intraday
On Friday market has passed the test and confirmed the top of right arm, thus downside action continues.
This is the picture that we follow in the beginning of the week. 1525 top is invalidation point for this setup, as we've said above:

As market stands at the eve of the breakout and major retracement is done already - here we should not get too strong pullback. Only two nearest level are treated as normal ones - 1495 and 1500 K-area + WPP. These two levels we need to consider for short entry:

Conclusion
Fundamental and long-term technical analysis shows that gold keeps long-term bullish sentiment, but odds on moderate retracement becomes greater day by day, because of reassessment driving factors' power.
The technical portion of Sive's analysis owes a great deal to Joe DiNapoli's methods, and uses a number of Joe's proprietary indicators. Please note that Sive's analysis is his own view of the market and is not endorsed by Joe DiNapoli or any related companies.
So, guys,it seems that retracement that we've talked about for 3-4 weeks as market was coiling around major monthly targets, stands under way. Positive retail sales data that we've mentioned yesterday in our FX report also adds more pressure on gold and investors finally start to fix profit.
As Reuters reports - Gold prices eased on Friday, heading for a third straight weekly fall, as positive U.S. retail sales data and hopes for a thaw in China-U.S. trade tensions lifted equities and yields to multi-week highs.
“With better-than-expected data along with a rise in global equity markets, we are seeing gold fall off its earlier highs. Optimism about trade has led to a bounce in global equities and lesser need for safe-haven commodities such as gold,” said David Meger, director of metals trading at High Ridge Futures.
“Underlying theme of global central bank easing continues to be a supportive factor for gold on the one side and you have some pressure coming from global equities and better prospects of trade.”
U.S. Treasury yields rose across the board after data showed U.S. retail sales rose in August, suggesting the risk of recession in the world’s largest economy continues to diminish.
Global shares also climbed to a six-week high on further signs of progress in U.S.-China trade talks and added stimulus from the European Central Bank.
Washington and Beijing have both made conciliatory gestures in recent days, further boosting the risk appetite in markets.
Investors are now awaiting the U.S. central bank meeting next week, when it is expected to cut its benchmark interest rate by at least 25 basis points for the second consecutive time.
Analysts said that dovish monetary policy adopted by global central banks along with concerns of a glut in negative-yielding government debt globally will continue to support bullion in the longer term.
“Gold is going to remain around these levels or drift higher. Gold is actually paying more than any other 30-year bond, and every small move actually pays more than bonds,” said an analyst based in New York.
CFTC data shows that speculators cut some longs and gold has dropped a bit from its ultimate net long top:
source: cftc.gov
Charting by Investing.com
Taking in consideration the scale of the monthly target and importance of fundamental background - retracement on gold market should be extended as in time as in price value. In fact, gold now stands under two impacts. First is better than expected US data and good US economy performance in general, second - overvaluation of US/China tariffs impact on economy. Yesterday we briefly hint on this subject in FX report, arguing where is negative impact on US economy as tariffs first time were imposed in March 2018, more than the year ago.
Today we dig this topic a bit deeper. Once tariffs were imposed we said - this is the tool in the hands of US to make financial pressure on China and this tool serves only to its master, despite that China tries to do the same. Recent US and China statistics confirms this. While US stats looks nice, we can't say this about China situation and Fathom consulting agrees, showing this in recent report.
First, is US export companies that get most part of revenue on export shows surprisingly better results, while tariffs have become tougher.
Fathom’s China Exposure Index (CEI) measures the equity performance of US companies that have a significant sales presence in China. It includes companies that derive greater than 15% of their revenue from China, with their equity prices measured against relevant sector benchmarks. Firms with a higher revenue share have a greater weight in the index. Since 2018, when the US first announced tariffs on imports from China, the index has ebbed and flowed, posting gains when Sino–US trade tensions have eased and vice versa.
The resilience of the index since May, after trade talks broke down, has been somewhat surprising. The CEI has declined by just 5% since then — a relatively modest amount considering that the US has significantly increased the effective tariff rate on Chinese imports in the intervening period, and China has also announced retaliatory measures. Under current policy, by the end of the year, the effective tariff rate on US imports from China will have increased by 21 percentage points since 2018. Of that potential increase, 9 percentage points has been implemented since May, with another 6 percentage points due to come in by the end of the year.
There are a couple of possible explanations for the relative strength of the CEI given recent tariff increases. It is possible that investors believe that looming duties on popular consumer products coupled with the US election cycle will hasten a last minute ‘deal’. Alternatively, investors may believe that the stimulus enacted by Chinese officials so far this year, including interest rate cuts and an apparent end to deleveraging, will be sufficient to shore up growth, helping US firms with a large presence there.
Notwithstanding some signs of thaw in recent days, the bigger story is that US trade policy is being driven in part by national security and geopolitical concerns that are unlikely to go away anytime soon. Trade tensions are secular, not cyclical risks.
Meanwhile, our own estimate of China’s economy points to a sustained slowdown leaving economic growth significantly below official estimates, despite new policy measures intended to shore up activity. All told, the risks to the CEI appear to be skewed to the downside.
Contrary to some, we do not believe that this slowdown reflects a strategic decision by China to rebalance the economy at a time when any negative impact on growth can be blamed on US trade sanctions. Indeed, it is happening despite of a lack of ‘rebalancing’. Recent measures of consumer appetite reinforce the message. Real retail sales growth — one of the ten components of our CMI 2.0 — fell to a record low in April 2019. This point is further supported by Fathom’s China Growth Strategy (CGS) indicator — a measure of old- versus new-model growth. The assumption behind the CGS and its subcomponents is that new-model growth should be driven less by credit and investment, with the consumer picking up the slack as the economy tilts towards more advanced-model growth. The CGS indicator has shown that progress on both the credit and investment front waned last year; evidence of a more consumer-driven economy was also absent. So long as China continues to prioritise growth over reform, meaningful rebalancing remains a distant prospect.
This data shows that while US feels good, keeping around 2% GDP growth, low unemployment and moderate inflation around 1.5%, China meets problems and fast slowdown on economy despite Beijing efforts to devalue national currency and support export. This confronts to common view of coming strong negative impact on US economy, which is one of the major long-term driving factors for gold market. It seems that markets also start understand that and re-balance investments in favor of more hesitant gold growth.
Besides, slowly but we come to the end of financial year in November. Gold has shown outstanding results this year and profit has to be fixed. So, this is third factor that support our suggestion of retracement on gold market.
Technical
Monthly
Gold market starts confirmation of our major resistance area showing inability to break it immediately.
Area of major 5/8 Fib resistance level at 1585 and monthly Overbought, accompanied by butterfly extension create solid barrier on a way up. Thus, although XOP target probably will be reached some day, but now odds suggest retracement.
Thus, we still keep this area - 1530-1585 as tactical ceil at current moment and expect that gold will show healthy retracement out there by fundamental reasons that we've mentioned.
Butterfly target has been hit relatively fast. Pattern itself suggests 3/8 retracement as minimal target. Hardly butterfly will fail as it is accompanied by Overbought and major Fib resistance level.
Weekly
Weekly picture keeps door open for different scenarios of retracement. We already have here Reversal week and first close below 3x3 DMA which makes possible appearing of B&B "Buy" setup around 1450 level. In fact, 1450 is our short-term target, as it is accompanied by weekly oversold and hardly gold will break it fast.
But, also we can't exclude DRPO "Sell" here. Recall that we still have our secondary XOP target untouched, and after minor downside action, as we already have 1st close below 3x3 DMA, we could get final spike to 1570 area and second top of DRPO "Sell" pattern. These are scenarios for nearest perspective.
In more extended view, our minimal target is 1360-1400 area of K-support that includes major monthly Fib support area. This is minimal target for monthly butterfly pattern. Also if you build levels from other reaction points - you'll get different Fib levels but all of them stand around this range. So, this is rather strong support cluster.
Daily
Daily time frame is the one where we will control the progress. Here we have H&S pattern, that we've traded last week as well. It has two vital points. First is - the top of right arm, i.e. "C" point, its invalidation level. If somehow, say by Fed statement, market turns up from neckline and break C point - it means that H&S stands just one step from the failure and we will get rally to weekly XOP of 1566 and, consequently DRPO "Sell" pattern on weekly chart.
Conversely, at least like it looks right now, normal H&S progress will drop gold to OP target at 1450 and K-support (recall that 1447 is 3/8 Fib level on weekly), weekly oversold and - weekly B&B "Buy" setup. This will be first leg down.
Gold maybe is a difficult to trade market guys, but when it starts forming patterns - they looks perfect and very harmonic.
Intraday
On Friday market has passed the test and confirmed the top of right arm, thus downside action continues.
This is the picture that we follow in the beginning of the week. 1525 top is invalidation point for this setup, as we've said above:
As market stands at the eve of the breakout and major retracement is done already - here we should not get too strong pullback. Only two nearest level are treated as normal ones - 1495 and 1500 K-area + WPP. These two levels we need to consider for short entry:
Conclusion
Fundamental and long-term technical analysis shows that gold keeps long-term bullish sentiment, but odds on moderate retracement becomes greater day by day, because of reassessment driving factors' power.
The technical portion of Sive's analysis owes a great deal to Joe DiNapoli's methods, and uses a number of Joe's proprietary indicators. Please note that Sive's analysis is his own view of the market and is not endorsed by Joe DiNapoli or any related companies.
") to test us!
to test us!