Sive Morten
Special Consultant to the FPA
- Messages
- 18,621
Hello, everybody. There are many questions that have appeared about fundamentals and EUR/USD perspectives. So this is my view on situation.
Fundamentals
Today we will focus on the EU financial crisis, because there is not much to say about US economy, just a few words. As early as in the beginning of the year I’ve pointed out that if the US economy will continue to show numbers that will be in a row with expectations and understanding of “Economy Growth” term, all will be OK. In other words, US has only economical issues, not political ones and that gives the US extra points. Now it comes true. After Nonfarm Payrolls release we can point out that Employment growth momentum becomes faster and I even can say that to my mind, the employment sector is almost out of risk zone. Three main things that spread a shadow on the recovery in US are the Real estate market, banks debt provisions and reserves and anemic personal and industrial loans. But this is not critical and I expect that these issues will turn positive till the end of the year. All others things – Indexes of Confidence, Labor market, Industrial production, GDP, Inflation are in favor of positive development of situation. Furthermore, due to the European crisis, the US Dollar and US Treasuries are becoming a safe haven for the investment world, because there is a great uncertainty about EU currency and EU bonds. So, Mutual, Pension and hedge funds are turning to US market, because for now it is too risky to invest in Euro. This will lead to great inflow into US. For example, assume that a Fund can invest in Bonds with A+ rating or higher. So, Germany, France, Italy and Spain bonds are suitable for that purpose. But this is for now. What will be tomorrow? Even if Germany's rating will remain the same, what will be with Euro currency? This is the risk.
Let’s talk now about the EU situation. First of all, President Trichet and the ECB hold a very passive position in the question of Greece's debt. This adds fears and uncertainty to the market. There is a real question in Europe about who will be a buyer of Spain, Portugal and Italy's debt. Portugal and Spain's debt auctions have had a low bid-to-cover ratio and the interest rate was higher. When, as I said, the ECB did not show any support to Greece crisis and European debt market, then the question has appeared – Is it a time for reassessing all types of assets? The bond market is skyrocketing and Greek bonds have reached 11.3% yield, S&P has lost almost all the 2010 gains, Crude Oil fall as a stone, US Treasuries yield around 3.55% level. So, looks like this process is already underway. But there can be some relief if a bailout will be passed on Monday. In fact, the question is simple. EUR is a European currency; it needs support from EU officials. If they do not want to provide it, then they do not believe in the EUR. If this is so, why we should? And the whole market thinks in this way. So EU officials and the IMF should come to an agreement, other way – I even do not want to predict EUR future.
Conclusion: Fundamentals are on the backseat now. Increases/decreases risk factor is what that matters now. The X point for nearest future is an agreement EU officials and IMF. It has to happen for EUR having it’s chance.
Technical
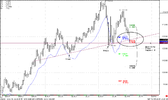
This is a monthly chart
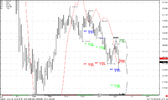
There was a very tough week, our expectations were met – we’ve reached monthly COP=1.2881, and we’ve broken all Pivot supports for the current month. This is a very bearish sign, but I want to note something.
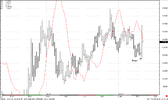
First of all, (I think that you’ve got this also) this is not just a down move here. This is a flight to quality rally. Look at the AB move on the chart, the blue line is a lower bound of Oscillator Predictor that shows us an oversold condition. See, market was extremely oversold during almost four months in the end of 2008. Something like that we can see in a foreseeable future. It means that we should be extra careful with support and oversold analysis. What shall we do then? Let’s see…
We have strong bearish trend. Pay attention to the circle that I’ve marked on the chart. It’s important. We have a very strong support here – combination on Oversold condition and Fib support=1.2577. This is “Stretch” Directional pattern. Besides, just one figure below the market is a quarterly pivot support2. It means that I definitely do not want to sell here. I will expect any buy signals on lower time frames (weekly or daily) and think that next week may have an upturn bias.
After possible pull back I will look an opportunity to enter short. See the “stops” labels on the chart – I expect that market should hit them before possible solid reversal starts. The next target is OP=1.1482 and I think that it should be reached.
Monthly chart conclusion: The market has reached strong support levels and shows Buy “Stretch” directional pattern. This tells me that I should not sell here. On next week, the market can trade with an upside bias. At the same time, the current down move is a Flight to quality rally that can drastically skew the technical picture and the market can be extremely oversold for some months in a row (like in 2008). I expect that after some retracement up, the down move will continue and market should hit stops and reach an OP=1.15 roughly before we can expect solid reversal. So, don’t be a seller, look for short-term buy signal on lower time frames. Take only reasonable risk.
Fundamentals
Today we will focus on the EU financial crisis, because there is not much to say about US economy, just a few words. As early as in the beginning of the year I’ve pointed out that if the US economy will continue to show numbers that will be in a row with expectations and understanding of “Economy Growth” term, all will be OK. In other words, US has only economical issues, not political ones and that gives the US extra points. Now it comes true. After Nonfarm Payrolls release we can point out that Employment growth momentum becomes faster and I even can say that to my mind, the employment sector is almost out of risk zone. Three main things that spread a shadow on the recovery in US are the Real estate market, banks debt provisions and reserves and anemic personal and industrial loans. But this is not critical and I expect that these issues will turn positive till the end of the year. All others things – Indexes of Confidence, Labor market, Industrial production, GDP, Inflation are in favor of positive development of situation. Furthermore, due to the European crisis, the US Dollar and US Treasuries are becoming a safe haven for the investment world, because there is a great uncertainty about EU currency and EU bonds. So, Mutual, Pension and hedge funds are turning to US market, because for now it is too risky to invest in Euro. This will lead to great inflow into US. For example, assume that a Fund can invest in Bonds with A+ rating or higher. So, Germany, France, Italy and Spain bonds are suitable for that purpose. But this is for now. What will be tomorrow? Even if Germany's rating will remain the same, what will be with Euro currency? This is the risk.
Let’s talk now about the EU situation. First of all, President Trichet and the ECB hold a very passive position in the question of Greece's debt. This adds fears and uncertainty to the market. There is a real question in Europe about who will be a buyer of Spain, Portugal and Italy's debt. Portugal and Spain's debt auctions have had a low bid-to-cover ratio and the interest rate was higher. When, as I said, the ECB did not show any support to Greece crisis and European debt market, then the question has appeared – Is it a time for reassessing all types of assets? The bond market is skyrocketing and Greek bonds have reached 11.3% yield, S&P has lost almost all the 2010 gains, Crude Oil fall as a stone, US Treasuries yield around 3.55% level. So, looks like this process is already underway. But there can be some relief if a bailout will be passed on Monday. In fact, the question is simple. EUR is a European currency; it needs support from EU officials. If they do not want to provide it, then they do not believe in the EUR. If this is so, why we should? And the whole market thinks in this way. So EU officials and the IMF should come to an agreement, other way – I even do not want to predict EUR future.
Conclusion: Fundamentals are on the backseat now. Increases/decreases risk factor is what that matters now. The X point for nearest future is an agreement EU officials and IMF. It has to happen for EUR having it’s chance.
Technical
This is a monthly chart
There was a very tough week, our expectations were met – we’ve reached monthly COP=1.2881, and we’ve broken all Pivot supports for the current month. This is a very bearish sign, but I want to note something.
First of all, (I think that you’ve got this also) this is not just a down move here. This is a flight to quality rally. Look at the AB move on the chart, the blue line is a lower bound of Oscillator Predictor that shows us an oversold condition. See, market was extremely oversold during almost four months in the end of 2008. Something like that we can see in a foreseeable future. It means that we should be extra careful with support and oversold analysis. What shall we do then? Let’s see…
We have strong bearish trend. Pay attention to the circle that I’ve marked on the chart. It’s important. We have a very strong support here – combination on Oversold condition and Fib support=1.2577. This is “Stretch” Directional pattern. Besides, just one figure below the market is a quarterly pivot support2. It means that I definitely do not want to sell here. I will expect any buy signals on lower time frames (weekly or daily) and think that next week may have an upturn bias.
After possible pull back I will look an opportunity to enter short. See the “stops” labels on the chart – I expect that market should hit them before possible solid reversal starts. The next target is OP=1.1482 and I think that it should be reached.
Monthly chart conclusion: The market has reached strong support levels and shows Buy “Stretch” directional pattern. This tells me that I should not sell here. On next week, the market can trade with an upside bias. At the same time, the current down move is a Flight to quality rally that can drastically skew the technical picture and the market can be extremely oversold for some months in a row (like in 2008). I expect that after some retracement up, the down move will continue and market should hit stops and reach an OP=1.15 roughly before we can expect solid reversal. So, don’t be a seller, look for short-term buy signal on lower time frames. Take only reasonable risk.
Attachments
Last edited:
")