Sive Morten
Special Consultant to the FPA
- Messages
- 18,655
Fundamentals
There were some interesting events during the week - as macro data such as a important statements from officials. First of all, let’s start with domestic events. In general, I have to say that nothing is changed much. The economy still shows growth but the pace of recovery is not very strong. As it has happened during recent months, data was mixed. Consumer credit shows some improvement and was released at 1Bln growth (-2 Bln expected) while in the previous time it was negative with -5.4 Bln. From the other side, retail sales had shown contraction -1.2% with expectations of growth 0.2%. There are some fears around retail sales and market worries that US consumers may not have the ability to pick up the slack in purchasing power from European consumers. Everybody anticipates a reduction in EU consumer power, but for now it is difficult to say how it may impact on US consuming and retail sales. In general, the moderate pace of recovery is an optimal situation for the Fed – inflation does not hit much, and the Fed can keep rates low and as a result more effectively stimulate economic growth in the long term.
Investors continue to keep an eye on China, which perspective of growth does not absolutely clear. The main concern there – the pace of recovery of the economy and it seems to be overheating. This is just two sides of a coin. If signs of overheating start to prevail and China will start to tighten policies to chill it – this leads to a reduced pace of growing not only in China's economy, but for the world economy also. Although retail sales increased by 18.7% (18.5 expected), Industrial production fell to 16.5% from 17.8%.
In the EU officials finally pushed the stone of uncertainty. On Thursday, President Trichet said that the ECB will continue unlimited funding operations and carry on with its bond purchases. At the same time, he has pointed concerns about the high level of deposits in ECB. The statement and support from officials can lead to short- term support of currency, but definitely, the EUR is in the woods still. In the previous week there was a rumor about Spain that it can call for funding and follow to the Greece. When Spain’s officials had strongly denied these statements, I thought that I have a deja-vu because the same was with Greece that refuted all rumors and made opposing statements. We all know what finish they had have…
So, that’s being said – the situation from doom and gloom has passed to a gradual development phase. But major components still in place – gradual but slow development in US and the EU crisis. I will not be surprised much if in the nearest future, investors begin to watch on EU macro data again. And when it will happen, they start to push EUR lower due to macro data at this time. Other words – we’ve done mostly with political factors, now we will return to economic ones and they will start drive EUR mostly. And I do not expect see them impressive in the near term.
Technical
Monthly
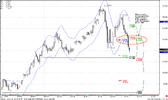
The monthly picture has not changed much, we see excellent thrust down, the trend is bearish. In the long term we would like to be sellers, but the market now at monthly overbought and at monthly Fib support. So, current time is not for any “Sell and hold” position – we need a pullback for that, definitely for scalp short, but not for “Sell and hold” (chart 1). At the same time we see small bouncing on monthly chart. For now I do not know if will the pull back be strong or market just starting to coil around Fib support. Sometimes I saw when the market reached oversold, reach Fib support and didn’t budge at all. But ok, this is a very long picture and it has a bullish bias for form’s sake – it is called a “Stretch” market oversold at Fib support. But this signal is very tricky because if you take it – you will start to trade against a major trend. Anyway this is just a context. To get a particular signal to enter long, we have to look at weekly and daily charts.
What else can the monthly chart tell us? Look at monthly #2 picture – see the ellipse that I’ve marked – this was a very strong support area – monthly confluence support and also an Agreement with COP target. What do we see? Market passed through it like a hot knife through butter and absolutely disrespected this level. Very often it happens – when market starts a retracement, it returns to disrespected confluence levels.
So keep in mind this 1.3030 area. 1.2600 level - is a monthly Pivot point that also was not traded by market still.
Now, look at monthly #3 chart – there are two expansions from the whole up swing – 1.27 and 1.618. This is a reverse formation (“butterfly” if somebody knows). Usually it reached 1.27 that is 1.0471 area or 1.61 (0.8960) expansion where market can make a major reversal. I can’t paint the wings for them (CQG does not allow me to do that). Taking into account acceleration from COP directly to OP without any meaningful retracement, I expect that we will reach at least 1.27 expansion.
Well, much information comes from the monthly chart today – if reversal starts two major levels – 1.26 (Pivot) and 1.30 area – disrespected strong support. If we see some ABC-bottom pattern on weekly that ends near 1.30 area - this will be excellent possibility for enter short.
Second – “Stretch” Buy directional pattern, but we need a confirmation on lower time frames.
Targets – OP=1.1480 and butterfly’s reversal pattern 1.27 expansion at 1.0471
Weekly
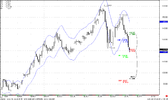
The weekly chart does not give us a particular signal, but it will be interesting to position traders. The trend is bearish still; market has reached monthly Pivot support 1 and bounced a bit. There are 3 major areas one the weekly chart. First of all, if market will continue to fall – 1.14-1.1480 area is what to watch for. Market should bounce from there. There are monthly Pivot support 2, weekly and monthly oversold, monthly OP target (see monthly chart).
But monthly “Stretch” pattern is in my mind still and I expect some bounce up. There are 2 interesting areas with strong resistance that are suitable for opening long term short positions. First- 1.2600-1.2612 area – combination of Fib resistance and monthly Pivot point. I think that it should be reached during the June. Second, perfect from my mind – 1.3081-1.3118 – Weekly Confluence resistance and Monthly Pivot resistance 1. Where definitely an up move should finish – I do not know. From one side – we are in a very strong bearish trend, and the market should not make a deep retracement up. From the other side – we are extremely oversold on monthly and the 1.31 area is a normal 0.382 retracement, nothing wrong with that. Besides, in 2009 there was a very deep retracement in similar circumstances. So, my #1 is 1.31 area. Anyway, we should look to any daily ABC-bottom patterns. And if they will point on one or another area – this will be it.
Daily
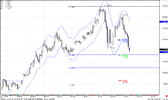
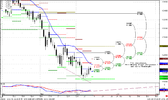
This is the daily chart, trend turns bullish, and we have a bullish convergence, by the way. 1.2035 is a Weekly pivot point, 1.1914 weekly pivot support 1 and 1.2195 – weekly pivot resistance 1 for the next week. First of all, I want to note here that market has closed below weekly pivot. What is a strategy for the next week… We know that we are at monthly oversold and Fib support and at monthly Pivot support 1. So, I think that we can count on some bounce. Where it can be possible enter long – we will estimate on the hourly chart, but as a target I like 1.2190-1.2210 area, at least for the next 2 days. This area is a combination of daily overbought at Fib resistance and weekly pivot resistance 1 also. I think that market will retrace lower from there.
Hourly
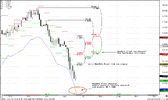
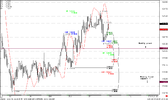
As we’ve just pointed, we would like to find an area to enter long. The hourly trend is bearish. As I’ve said on Friday, retracement should not start until we reach an OP=1.2265, so, market has reached it and start a retracement. But let’s look where we are now.
Look at ABC-top pattern. It just an approximation, because market can go up futher a bit, so point B can be displaced higher, but this is just an example. When the down move will start, and “B” point will be estimated, we can calculate targets. If OP will coincide with 1.2042-1.2057 area, that is weekly Pivot and hourly confluence support, then, probably we can go long from there. But I think somehow, that the market should make a deeper retracement, because this is just a first swing up on daily chart. If my OP at 1.2015 will not change then, I probably will enter at 1.1990-1.2015 area. But this is just an assumption – watch for any bullish signals around the important levels. If I’ll see them around 1.2030 area - I’ll enter from there. If the market will fall like a stone – there is another area to watch for – weekly pivot support 1 that coincides with 0.88 retracement.
Good luck.
There were some interesting events during the week - as macro data such as a important statements from officials. First of all, let’s start with domestic events. In general, I have to say that nothing is changed much. The economy still shows growth but the pace of recovery is not very strong. As it has happened during recent months, data was mixed. Consumer credit shows some improvement and was released at 1Bln growth (-2 Bln expected) while in the previous time it was negative with -5.4 Bln. From the other side, retail sales had shown contraction -1.2% with expectations of growth 0.2%. There are some fears around retail sales and market worries that US consumers may not have the ability to pick up the slack in purchasing power from European consumers. Everybody anticipates a reduction in EU consumer power, but for now it is difficult to say how it may impact on US consuming and retail sales. In general, the moderate pace of recovery is an optimal situation for the Fed – inflation does not hit much, and the Fed can keep rates low and as a result more effectively stimulate economic growth in the long term.
Investors continue to keep an eye on China, which perspective of growth does not absolutely clear. The main concern there – the pace of recovery of the economy and it seems to be overheating. This is just two sides of a coin. If signs of overheating start to prevail and China will start to tighten policies to chill it – this leads to a reduced pace of growing not only in China's economy, but for the world economy also. Although retail sales increased by 18.7% (18.5 expected), Industrial production fell to 16.5% from 17.8%.
In the EU officials finally pushed the stone of uncertainty. On Thursday, President Trichet said that the ECB will continue unlimited funding operations and carry on with its bond purchases. At the same time, he has pointed concerns about the high level of deposits in ECB. The statement and support from officials can lead to short- term support of currency, but definitely, the EUR is in the woods still. In the previous week there was a rumor about Spain that it can call for funding and follow to the Greece. When Spain’s officials had strongly denied these statements, I thought that I have a deja-vu because the same was with Greece that refuted all rumors and made opposing statements. We all know what finish they had have…
So, that’s being said – the situation from doom and gloom has passed to a gradual development phase. But major components still in place – gradual but slow development in US and the EU crisis. I will not be surprised much if in the nearest future, investors begin to watch on EU macro data again. And when it will happen, they start to push EUR lower due to macro data at this time. Other words – we’ve done mostly with political factors, now we will return to economic ones and they will start drive EUR mostly. And I do not expect see them impressive in the near term.
Technical
Monthly
The monthly picture has not changed much, we see excellent thrust down, the trend is bearish. In the long term we would like to be sellers, but the market now at monthly overbought and at monthly Fib support. So, current time is not for any “Sell and hold” position – we need a pullback for that, definitely for scalp short, but not for “Sell and hold” (chart 1). At the same time we see small bouncing on monthly chart. For now I do not know if will the pull back be strong or market just starting to coil around Fib support. Sometimes I saw when the market reached oversold, reach Fib support and didn’t budge at all. But ok, this is a very long picture and it has a bullish bias for form’s sake – it is called a “Stretch” market oversold at Fib support. But this signal is very tricky because if you take it – you will start to trade against a major trend. Anyway this is just a context. To get a particular signal to enter long, we have to look at weekly and daily charts.
What else can the monthly chart tell us? Look at monthly #2 picture – see the ellipse that I’ve marked – this was a very strong support area – monthly confluence support and also an Agreement with COP target. What do we see? Market passed through it like a hot knife through butter and absolutely disrespected this level. Very often it happens – when market starts a retracement, it returns to disrespected confluence levels.
So keep in mind this 1.3030 area. 1.2600 level - is a monthly Pivot point that also was not traded by market still.
Now, look at monthly #3 chart – there are two expansions from the whole up swing – 1.27 and 1.618. This is a reverse formation (“butterfly” if somebody knows). Usually it reached 1.27 that is 1.0471 area or 1.61 (0.8960) expansion where market can make a major reversal. I can’t paint the wings for them (CQG does not allow me to do that). Taking into account acceleration from COP directly to OP without any meaningful retracement, I expect that we will reach at least 1.27 expansion.
Well, much information comes from the monthly chart today – if reversal starts two major levels – 1.26 (Pivot) and 1.30 area – disrespected strong support. If we see some ABC-bottom pattern on weekly that ends near 1.30 area - this will be excellent possibility for enter short.
Second – “Stretch” Buy directional pattern, but we need a confirmation on lower time frames.
Targets – OP=1.1480 and butterfly’s reversal pattern 1.27 expansion at 1.0471
Weekly
The weekly chart does not give us a particular signal, but it will be interesting to position traders. The trend is bearish still; market has reached monthly Pivot support 1 and bounced a bit. There are 3 major areas one the weekly chart. First of all, if market will continue to fall – 1.14-1.1480 area is what to watch for. Market should bounce from there. There are monthly Pivot support 2, weekly and monthly oversold, monthly OP target (see monthly chart).
But monthly “Stretch” pattern is in my mind still and I expect some bounce up. There are 2 interesting areas with strong resistance that are suitable for opening long term short positions. First- 1.2600-1.2612 area – combination of Fib resistance and monthly Pivot point. I think that it should be reached during the June. Second, perfect from my mind – 1.3081-1.3118 – Weekly Confluence resistance and Monthly Pivot resistance 1. Where definitely an up move should finish – I do not know. From one side – we are in a very strong bearish trend, and the market should not make a deep retracement up. From the other side – we are extremely oversold on monthly and the 1.31 area is a normal 0.382 retracement, nothing wrong with that. Besides, in 2009 there was a very deep retracement in similar circumstances. So, my #1 is 1.31 area. Anyway, we should look to any daily ABC-bottom patterns. And if they will point on one or another area – this will be it.
Daily
This is the daily chart, trend turns bullish, and we have a bullish convergence, by the way. 1.2035 is a Weekly pivot point, 1.1914 weekly pivot support 1 and 1.2195 – weekly pivot resistance 1 for the next week. First of all, I want to note here that market has closed below weekly pivot. What is a strategy for the next week… We know that we are at monthly oversold and Fib support and at monthly Pivot support 1. So, I think that we can count on some bounce. Where it can be possible enter long – we will estimate on the hourly chart, but as a target I like 1.2190-1.2210 area, at least for the next 2 days. This area is a combination of daily overbought at Fib resistance and weekly pivot resistance 1 also. I think that market will retrace lower from there.
Hourly
As we’ve just pointed, we would like to find an area to enter long. The hourly trend is bearish. As I’ve said on Friday, retracement should not start until we reach an OP=1.2265, so, market has reached it and start a retracement. But let’s look where we are now.
Look at ABC-top pattern. It just an approximation, because market can go up futher a bit, so point B can be displaced higher, but this is just an example. When the down move will start, and “B” point will be estimated, we can calculate targets. If OP will coincide with 1.2042-1.2057 area, that is weekly Pivot and hourly confluence support, then, probably we can go long from there. But I think somehow, that the market should make a deeper retracement, because this is just a first swing up on daily chart. If my OP at 1.2015 will not change then, I probably will enter at 1.1990-1.2015 area. But this is just an assumption – watch for any bullish signals around the important levels. If I’ll see them around 1.2030 area - I’ll enter from there. If the market will fall like a stone – there is another area to watch for – weekly pivot support 1 that coincides with 0.88 retracement.
Good luck.
Attachments
Last edited:
")