Sive Morten
Special Consultant to the FPA
- Messages
- 18,621
Fundamentals
US macro data shows a decrease in recovery momentum. This statement relates to 2 major components of growth – housing markets and employment. I’ve already talked about this in previous research – both of them do not show an increasing in pace. Although weekly claims data shows solid reducing to 457K it still can’t move lower than the 450K that is a beacon of recovery. The market expects a solid decrease in NFP on the next week for approximately “-110K”. That worries me and in fact, we can return to double dip scenario. Technically, I also see some confirmations to these signs – growth in Gold, falling shares and Crude oil, reducing US Treasuries yields. My expectations, (may be they will not be confirmed, I do not know, but now nothing tells about it) for S&P500 index 950-1000, Crude oil 65$, 10-year US Treasuries yield – 2.8-3%. These are the levels where I will look for long-term positions.
On July 1st the ECB’s 1st 12 month unlimited facility will expire thus requiring institutions to pay back E442B outstanding. It is possible that banks are hoarding ahead of this obligation and thus putting pressure on short-term rates. However, the headlines indicating that through May 10th Portuguese borrowing from the ECB has doubled and Greek banks have borrowed E89.4B suggest that there is more to the story.
Debates about taxes for banks and hedge funds are also interesting. This issue considers not only in US Congress, but on G20 meeting. US Congress tax stuff assumes a sum of about USD19Bn and definitely will be a headwind for economical recovery. The same is in EU. In general, there is a great concern that these bank’s tax and transaction tax are gaining momentum amongst financial ministers. Countries who are concerned about their budget deficits may begin to lobby harder for the tax. Rating agencies lauded the UK’s efforts and as it is estimated that the tax will bring in GBP2B, other sovereigns may seriously consider the strategy.
So, different macro news appears here and there, but we should extract mostly important from them. First of all – US economy recovery loses momentum, Fed is also marked this issue, inflation in US still anemic. Market expects decrease in NFP during next week – this is in a row with it. It means that we can see double dip recession, and as a result, a flight to quality rally, that will be supportive for the USD. The situation in the EU is not out of the woods yet, despite some positive signs that can lead to short-term relief rallies, and I expect that 1.15 area should be reached sooner rather than later.
Technical
Monthly
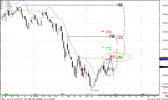
Monthly chart shows a pullback from Fib support and oversold area. As I’ve said in previous research this is a monthly bullish “Stretch” pattern and a nice hammer although June bar is not closed yet. Trend remains bearish. Taking into consideration previous thrust down, I expect that this is just a pullback higher and after it we will see another leg down.
Concerning targets – I’ve post in previous research Butterfly “Buy” pattern. On the chart #2 I’ve post very interesting areas. First area – 1.1380-1.1550. Very strong support to my mind, that includes OP target with Fib support (which makes Agreement by the way) and 1.27 extension from previous up move (B-C points). Next area is 1.049-1.055 that includes 1.27 extension of our Butterfly pattern and 1.618 extension of the same BC swing. Interesting, right? And last one is 0.90-0.92 area – XOP target and Butterfly 1.618 extension.
So, that’s being said – the market has started a pullback and I think we can open long position on a shorter time frame. For positional traders – wait, when retracement up will finish. It’s not a good area to enter short right now – at monthly Fib support and monthly oversold.
Weekly
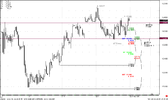
The weekly chart does not give us a particular signal, but it will be interesting for position traders. Trend is bearish still; market has reached monthly Pivot support 1 and starts to bounce. There are 2 interesting areas with strong resistance and suitable for opening long term short positions. First- 1.2600-1.2612 area – combination of Fib resistance and monthly Pivot point. I think that it should be reached during the June. Second, perfect from my mind – 1.3081-1.3118 – Weekly Confluence resistance Monthly Pivot resistance 1 and weekly oversold.
The green line on the chart is a 3x3 SMA. As you see, we a have an excellent thrust down on the weekly chart, and market has closed above 3x3, but it has not reached a Fib support yet. This combination leads us to two possible trading ideas. First one is Bread & butter “Sell”, second – Double Repo “Buy”. Let’s go step by step through them. Both of them are not in place yet and have to have some time to develop till the signal will be really in place. But we should be careful with them, because this will be a very good opportunity.
First of all, you can read about this signals and look how they work in reality here:
https://www.forexpeacearmy.com/fore...782-trade-description-november-27-2009-a.html
Second, about B&B… Formally we already have a close above 3x3, but market has not reached Fib resistance and market is oversold on monthly chart. So, I prefer to see 2-3 closes above 3x3, especially when market is oversold on monthly, because retracement can be deeper than usual. So, may be 1.26 is a appropriate level for that.
When B&B will be done, and we will have close below 3x3 and then above again - this will trigger a DRPO Buy signal. Possible target for it is 1.31 area.
This is my view on situation on weekly. A lot of stuff will be there soon.
Daily
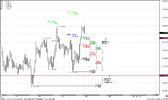
During the last two weeks market shows nice up move, trend is bullish. On the previous week market has made a 0.382 retracement, flirted with weekly Pivot and closed above it. This is a bullish sign.
If ABC-bottom pattern already in place – the nearest COP target right in Agreement with 1.2617-1.2630 Fib resistance, monthly pivot at 1.26 and daily overbought. So, I think that we can enter long with target at this level. Also there is another thing that is very interesting:
Look at the chart- do you see short lines there? This is a reverse H&S pattern. The Head is a 1.618 extension of a left shoulder and this is ideal. Commonly H&S patterns are very symmetrical and I prefer to see them symmetrical. It not means that H&S have to, but it happens very often. It concerns not only price swings but time also. So, if we apply symmetry to our pattern – we should see something like this that I’ve marked on the chart – swing up to 1.26 area (B&B Sell pattern will be triggered there BTW) then deep retracement, may be 0.618 (there we will exit from weekly B&B), then swing up to 1.31 (this will be DRPO). For me it sounds intriguing.
So, conclusion – scenario of daily H&S perfectly combines with weekly setups of B&B and DRPO formations and I think that on the next week we can enter long with 1.26 target, that should be reached. At the same time, we could be wrong, despite of perfection of the picture that we see now. If market will move below weekly pivot - our scenario will be under questions.
US macro data shows a decrease in recovery momentum. This statement relates to 2 major components of growth – housing markets and employment. I’ve already talked about this in previous research – both of them do not show an increasing in pace. Although weekly claims data shows solid reducing to 457K it still can’t move lower than the 450K that is a beacon of recovery. The market expects a solid decrease in NFP on the next week for approximately “-110K”. That worries me and in fact, we can return to double dip scenario. Technically, I also see some confirmations to these signs – growth in Gold, falling shares and Crude oil, reducing US Treasuries yields. My expectations, (may be they will not be confirmed, I do not know, but now nothing tells about it) for S&P500 index 950-1000, Crude oil 65$, 10-year US Treasuries yield – 2.8-3%. These are the levels where I will look for long-term positions.
On July 1st the ECB’s 1st 12 month unlimited facility will expire thus requiring institutions to pay back E442B outstanding. It is possible that banks are hoarding ahead of this obligation and thus putting pressure on short-term rates. However, the headlines indicating that through May 10th Portuguese borrowing from the ECB has doubled and Greek banks have borrowed E89.4B suggest that there is more to the story.
Debates about taxes for banks and hedge funds are also interesting. This issue considers not only in US Congress, but on G20 meeting. US Congress tax stuff assumes a sum of about USD19Bn and definitely will be a headwind for economical recovery. The same is in EU. In general, there is a great concern that these bank’s tax and transaction tax are gaining momentum amongst financial ministers. Countries who are concerned about their budget deficits may begin to lobby harder for the tax. Rating agencies lauded the UK’s efforts and as it is estimated that the tax will bring in GBP2B, other sovereigns may seriously consider the strategy.
So, different macro news appears here and there, but we should extract mostly important from them. First of all – US economy recovery loses momentum, Fed is also marked this issue, inflation in US still anemic. Market expects decrease in NFP during next week – this is in a row with it. It means that we can see double dip recession, and as a result, a flight to quality rally, that will be supportive for the USD. The situation in the EU is not out of the woods yet, despite some positive signs that can lead to short-term relief rallies, and I expect that 1.15 area should be reached sooner rather than later.
Technical
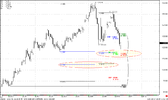
Monthly
Monthly chart shows a pullback from Fib support and oversold area. As I’ve said in previous research this is a monthly bullish “Stretch” pattern and a nice hammer although June bar is not closed yet. Trend remains bearish. Taking into consideration previous thrust down, I expect that this is just a pullback higher and after it we will see another leg down.
Concerning targets – I’ve post in previous research Butterfly “Buy” pattern. On the chart #2 I’ve post very interesting areas. First area – 1.1380-1.1550. Very strong support to my mind, that includes OP target with Fib support (which makes Agreement by the way) and 1.27 extension from previous up move (B-C points). Next area is 1.049-1.055 that includes 1.27 extension of our Butterfly pattern and 1.618 extension of the same BC swing. Interesting, right? And last one is 0.90-0.92 area – XOP target and Butterfly 1.618 extension.
So, that’s being said – the market has started a pullback and I think we can open long position on a shorter time frame. For positional traders – wait, when retracement up will finish. It’s not a good area to enter short right now – at monthly Fib support and monthly oversold.
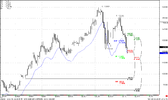
Weekly
The weekly chart does not give us a particular signal, but it will be interesting for position traders. Trend is bearish still; market has reached monthly Pivot support 1 and starts to bounce. There are 2 interesting areas with strong resistance and suitable for opening long term short positions. First- 1.2600-1.2612 area – combination of Fib resistance and monthly Pivot point. I think that it should be reached during the June. Second, perfect from my mind – 1.3081-1.3118 – Weekly Confluence resistance Monthly Pivot resistance 1 and weekly oversold.
The green line on the chart is a 3x3 SMA. As you see, we a have an excellent thrust down on the weekly chart, and market has closed above 3x3, but it has not reached a Fib support yet. This combination leads us to two possible trading ideas. First one is Bread & butter “Sell”, second – Double Repo “Buy”. Let’s go step by step through them. Both of them are not in place yet and have to have some time to develop till the signal will be really in place. But we should be careful with them, because this will be a very good opportunity.
First of all, you can read about this signals and look how they work in reality here:
https://www.forexpeacearmy.com/fore...782-trade-description-november-27-2009-a.html
Second, about B&B… Formally we already have a close above 3x3, but market has not reached Fib resistance and market is oversold on monthly chart. So, I prefer to see 2-3 closes above 3x3, especially when market is oversold on monthly, because retracement can be deeper than usual. So, may be 1.26 is a appropriate level for that.
When B&B will be done, and we will have close below 3x3 and then above again - this will trigger a DRPO Buy signal. Possible target for it is 1.31 area.
This is my view on situation on weekly. A lot of stuff will be there soon.
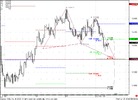
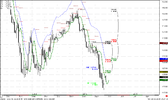
Daily
During the last two weeks market shows nice up move, trend is bullish. On the previous week market has made a 0.382 retracement, flirted with weekly Pivot and closed above it. This is a bullish sign.
If ABC-bottom pattern already in place – the nearest COP target right in Agreement with 1.2617-1.2630 Fib resistance, monthly pivot at 1.26 and daily overbought. So, I think that we can enter long with target at this level. Also there is another thing that is very interesting:
Look at the chart- do you see short lines there? This is a reverse H&S pattern. The Head is a 1.618 extension of a left shoulder and this is ideal. Commonly H&S patterns are very symmetrical and I prefer to see them symmetrical. It not means that H&S have to, but it happens very often. It concerns not only price swings but time also. So, if we apply symmetry to our pattern – we should see something like this that I’ve marked on the chart – swing up to 1.26 area (B&B Sell pattern will be triggered there BTW) then deep retracement, may be 0.618 (there we will exit from weekly B&B), then swing up to 1.31 (this will be DRPO). For me it sounds intriguing.
So, conclusion – scenario of daily H&S perfectly combines with weekly setups of B&B and DRPO formations and I think that on the next week we can enter long with 1.26 target, that should be reached. At the same time, we could be wrong, despite of perfection of the picture that we see now. If market will move below weekly pivot - our scenario will be under questions.
Attachments
Last edited:
")