Sive Morten
Special Consultant to the FPA
- Messages
- 18,644
Monthly
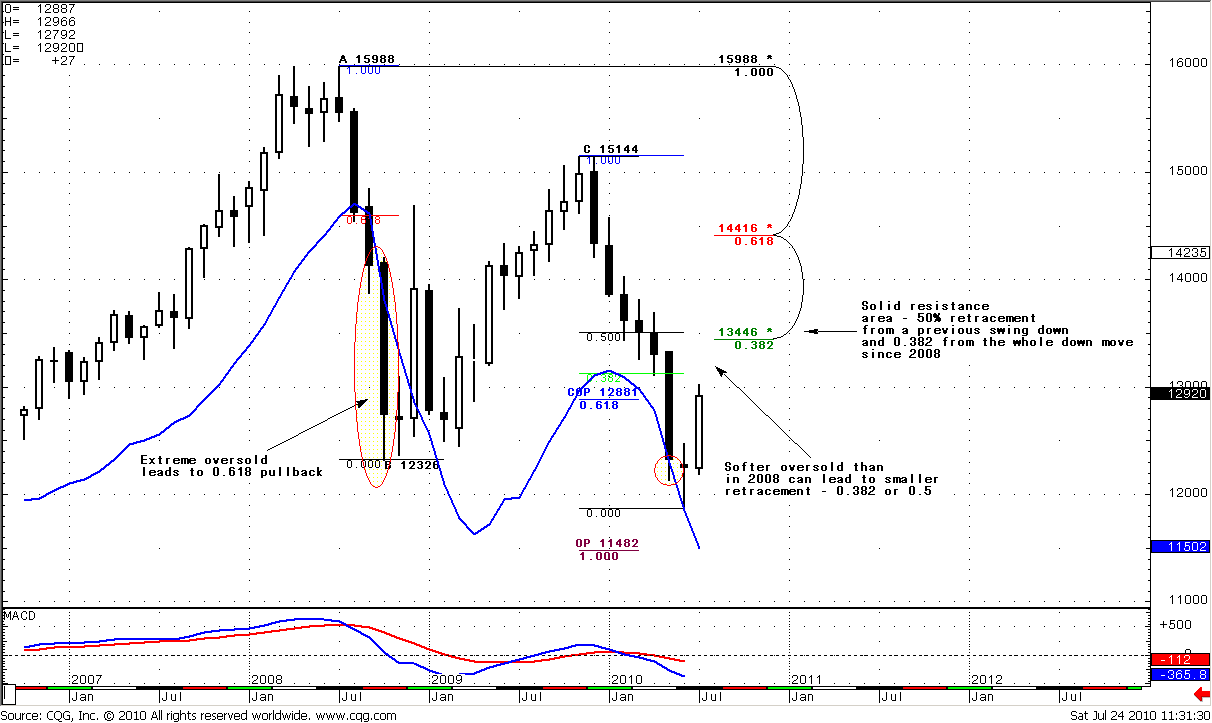
There is no much to add to previous chart – gradual pull back still in play, trend is bearish, no oversold, next target is Agreement at OP=1.1482. So, I’ve posted a bit another picture today, and would like to discuss with you possible repercussions of Oversold at the market. Look at 2008 price action – market was strongly below blue line – Oscillator predictor’s lower bound that shows us oversold level. When market has exited from oversold – it showed deep retracement – to 0.618 resistance level, and even pierced it a bit. Now let’s look at current oversold level that market has reached in May – it was much smaller that in 2008. Market just pierced a blue line. So the conclusion may be that current retracement up should be softer – 0.382 or 0.5 area. Interestingly, that 50% retracement from the recent swing down coincides with major 0.382 Retracement from A-point (major High) to low in June 2010. This combination creates strong resistance area. Let’s keep in mind this level - 1.3446-1.3512
Weekly
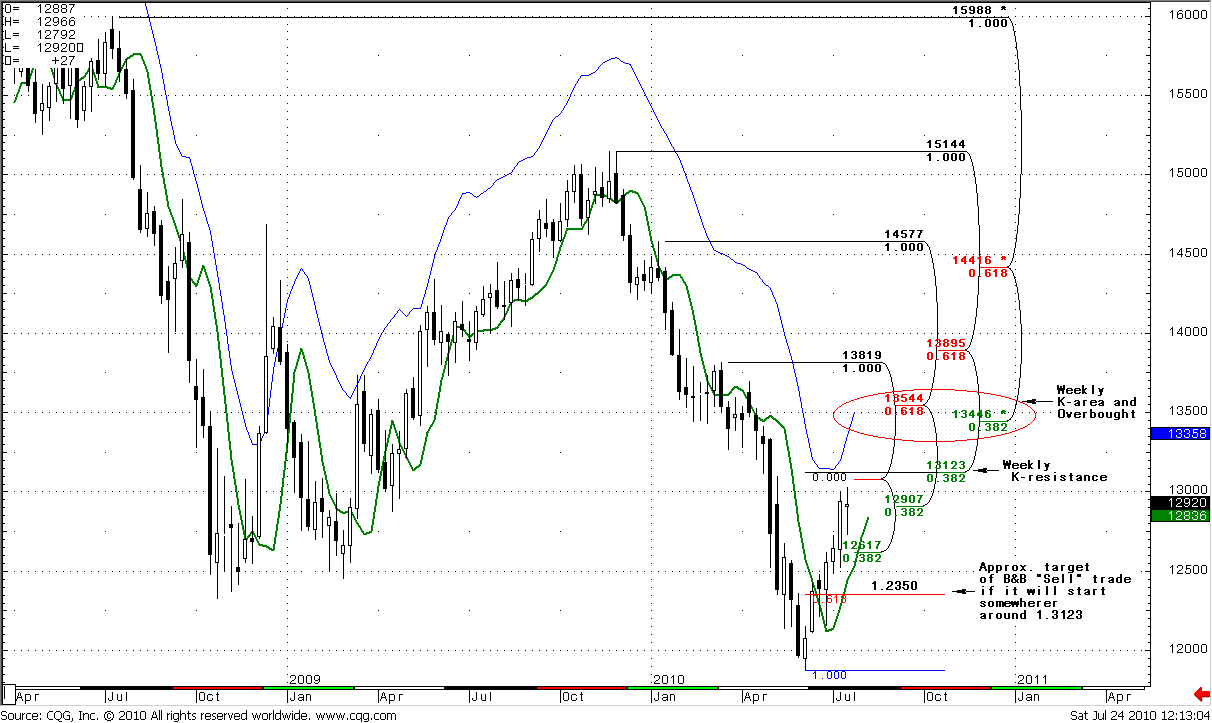
I leave a part of analysis intact, and then add some new details here…Weekly trend is bullish, no overbought. The green line on the chart is a 3x3 SMA, blue line – Oscillator Predictor upper bound that shows us overbought level. I have no monthly Pivot points at weekly chart, because all of them have been erased by price action. This is a really the sign of strength of the market. As you remember during last couple of weeks we’ve talked about “Bread and Butter” directional trade.
Now, let’s look at the last week – it’s a spin doji, which means that market in decision just below weekly Confluence resistance area. I do not very rely on candle patterns - just try to look at picture in general, because you never know, where you’ll find a prompt. Some weeks ago there was an overbought area, but no more. This is a dynamic characteristic and for next week overbought is at 1.35 level. Now, remind the level from monthly analysis – 1.3446-1.3544. It includes weekly Confluence resistance, 50% retracement from previous swing down, and weekly overbought. It’s very strong resistance.
So, what the strategy from weekly chart… I expect that B&B “Sell” signal will appear at 1.3076-1.3123 weekly K-resistance. At least, market should bounce from this area, it’s a normal action. And I think that market can reach it during the next week. The target of B&B – 1.2350 level. But we do not know will be move to 1.2350 directly or it will be just a bounce from resistance. That’s why, I offer you to move s/l to breakeven, when the market will start move down.
If market is stronger than I think, the next area of resistance – 1.3440-1.3540.
Daily
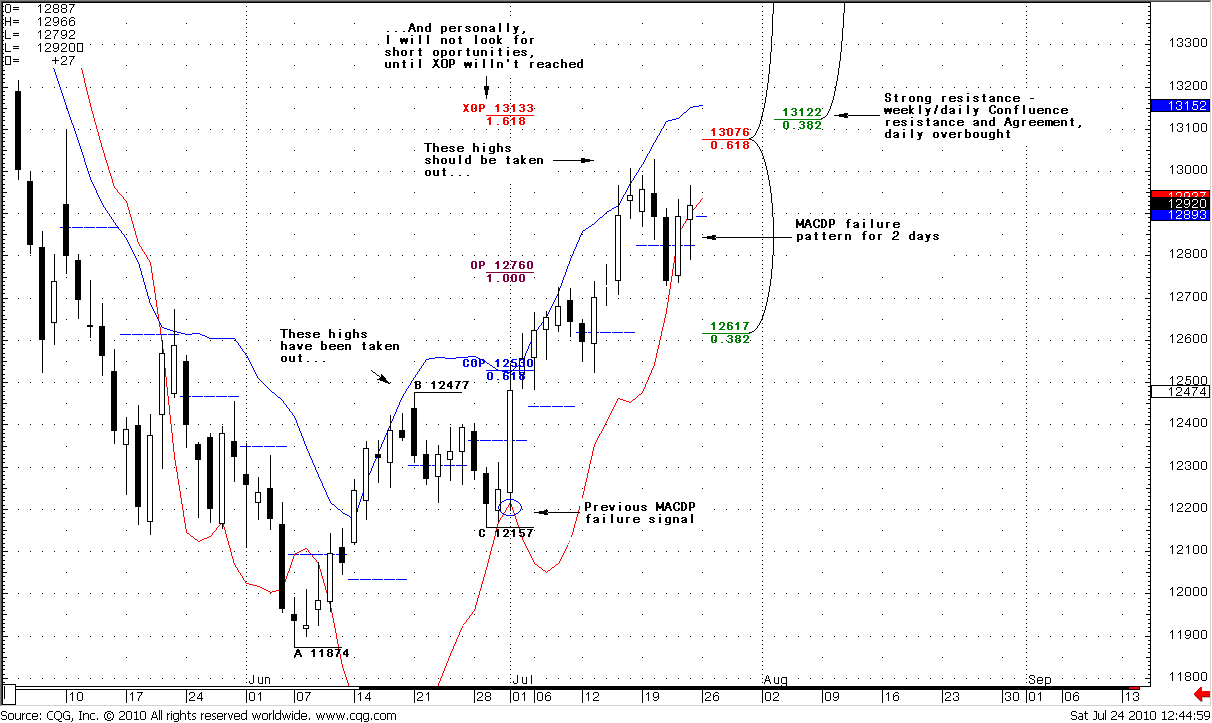
Daily chart is really exciting. There are lot of details on it, so let’s go step by step. First of all, red line – is a MACD Predictor. We’ve talked about it in Friday’s update on previous week, but signal still in place and it’s very important. During last two days market shows unconfirmed trend change to bearish, but at the end of the day – trend shift was not confirmed. And people who have entered market on a short side started to scream “Let me out”. Where do they hide their stops? That’s right - just about the highs. That’s why this kind of pattern calls “Stop grabber” or “Stop hunter”. Also I’ve posted previous MACDP failure signal – you can see what had happened. So, we can expect from that signal that previous highs will be taken out by the market. But there is another important think that we have to taking into account…
Just above the market – XOP target, and this area as a magnet. Personally, I will not even think about establishing long-term Short position, until market is reached it… At the same time XOP coincides with weekly Confluence resistance and daily overbought area – market should bounce from this level at minimum. XOP is an area where bull party will be over or at least taking a pause.
Third, the blue dash line weekly Pivot point. I’ve said million if times that Pivot points are very important. On Thursday we’ve discussed the possible reversal on the market to the upside, and I’ve said that if market will move above weekly pivot – up move should continue. So, that had happened. But let’s see how to trade current situation. Weekly Pivot for next week is at 1.2893. There will be very important price action on Monday. If market will test weekly Pivot and move above it – we can enter long.
That’s being said, personally I would like to be a buyer and enter on a pullback. 1.2893 – weekly Pivot. If market will test it and move above it, intraday trend turns bullish – we can enter “Long” with XOP target.
Let’s look at lower time frame.
1-Hour
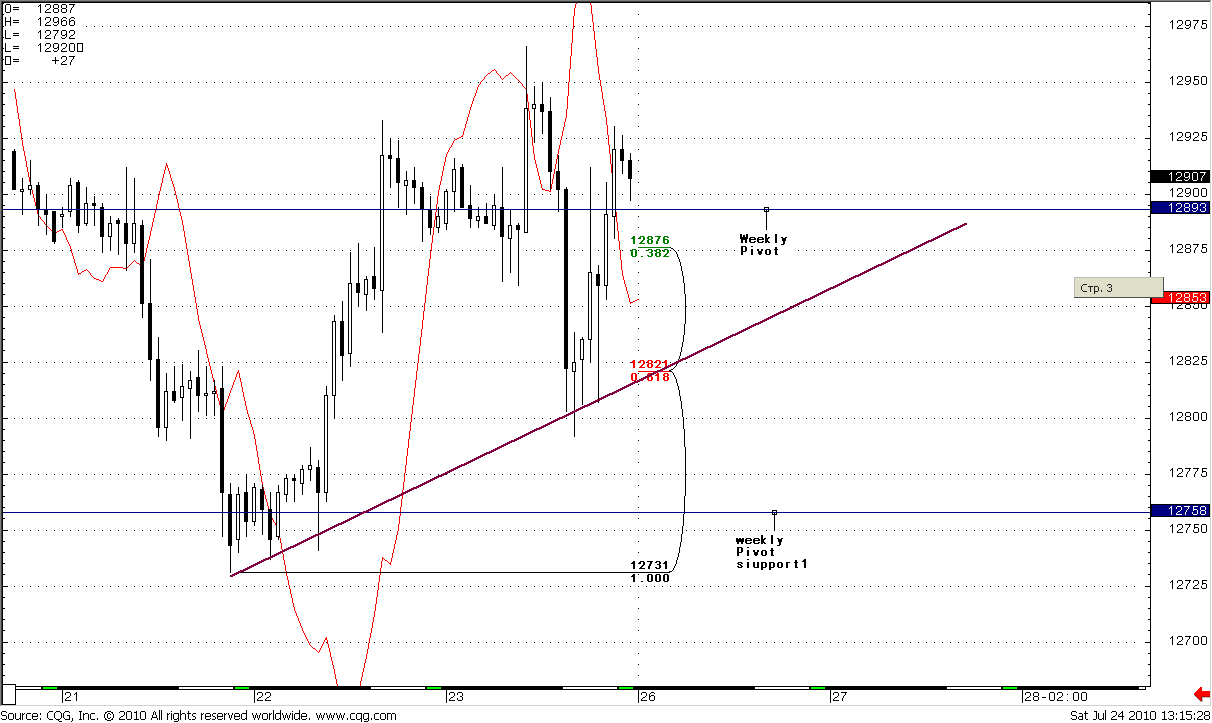
Short-term time frame has no definite signal for now. Price action is a choppy a bit. The trend line is a lower border of possible triangle pattern (not shown, and looks clearer at 4-hour chart). The Friday’s deep looks to me as a W&R, because recovery was almost as fast as collapse. Trend is bullish, weekly Pivot point just below the market. In general, I will track two levels – 1.2730 lows and weekly Pivot support 1 – market should hold it if bulls intend to stay in charge, and weekly Pivot point at 1.2893. I do not tell you “Buy” right at weekly pivot. Personally, I will track action around it. What does it mean? Very probable that market will pierce it, or even move below it on Monday. I will be looking for reverse move above the Pivot – if it will happen, I will wait for shifting hour trend to bullish. After that – I will enter “Long” on a small hourly retracement. Hourly trend will be bullish, daily trend will be bullish and market will be above the weekly Pivot. This is a good combination. I just will not enter if something will go wrong. For example, market will stay below weekly Pivot, or break lows at 1.2730. The main rule – do not run ahead of train.
That’s being said – In a long term I expect start of a B&B “Sell” trade with a possible target at 1.2350. Market does not reach yet the level from which it can start. I think that this will be an area around 1.3133 – XOP target. Even if market will not start move to 1.2350 - it should bounce from there, because this is a strong resistance.
It means that until 1.3133 – we can enter long. The context for this – daily trend is bullish, no overbought, MACDP failure signal. Market has closed above weekly pivot on previous week.
How to enter long with an XOP target? Wait, until market will test weekly Pivot point on Monday – end we may enter only when market will return above weekly Pivot and hourly trend will turn bullish. There is need not to say that 1.2730 lows and weekly Pivot support 1 should hold.
If market will stay below weekly Pivot or even 1.2730 lows will be taken out – we can expect deeper retracement down.
There is no much to add to previous chart – gradual pull back still in play, trend is bearish, no oversold, next target is Agreement at OP=1.1482. So, I’ve posted a bit another picture today, and would like to discuss with you possible repercussions of Oversold at the market. Look at 2008 price action – market was strongly below blue line – Oscillator predictor’s lower bound that shows us oversold level. When market has exited from oversold – it showed deep retracement – to 0.618 resistance level, and even pierced it a bit. Now let’s look at current oversold level that market has reached in May – it was much smaller that in 2008. Market just pierced a blue line. So the conclusion may be that current retracement up should be softer – 0.382 or 0.5 area. Interestingly, that 50% retracement from the recent swing down coincides with major 0.382 Retracement from A-point (major High) to low in June 2010. This combination creates strong resistance area. Let’s keep in mind this level - 1.3446-1.3512
Weekly
I leave a part of analysis intact, and then add some new details here…Weekly trend is bullish, no overbought. The green line on the chart is a 3x3 SMA, blue line – Oscillator Predictor upper bound that shows us overbought level. I have no monthly Pivot points at weekly chart, because all of them have been erased by price action. This is a really the sign of strength of the market. As you remember during last couple of weeks we’ve talked about “Bread and Butter” directional trade.
Now, let’s look at the last week – it’s a spin doji, which means that market in decision just below weekly Confluence resistance area. I do not very rely on candle patterns - just try to look at picture in general, because you never know, where you’ll find a prompt. Some weeks ago there was an overbought area, but no more. This is a dynamic characteristic and for next week overbought is at 1.35 level. Now, remind the level from monthly analysis – 1.3446-1.3544. It includes weekly Confluence resistance, 50% retracement from previous swing down, and weekly overbought. It’s very strong resistance.
So, what the strategy from weekly chart… I expect that B&B “Sell” signal will appear at 1.3076-1.3123 weekly K-resistance. At least, market should bounce from this area, it’s a normal action. And I think that market can reach it during the next week. The target of B&B – 1.2350 level. But we do not know will be move to 1.2350 directly or it will be just a bounce from resistance. That’s why, I offer you to move s/l to breakeven, when the market will start move down.
If market is stronger than I think, the next area of resistance – 1.3440-1.3540.
Daily
Daily chart is really exciting. There are lot of details on it, so let’s go step by step. First of all, red line – is a MACD Predictor. We’ve talked about it in Friday’s update on previous week, but signal still in place and it’s very important. During last two days market shows unconfirmed trend change to bearish, but at the end of the day – trend shift was not confirmed. And people who have entered market on a short side started to scream “Let me out”. Where do they hide their stops? That’s right - just about the highs. That’s why this kind of pattern calls “Stop grabber” or “Stop hunter”. Also I’ve posted previous MACDP failure signal – you can see what had happened. So, we can expect from that signal that previous highs will be taken out by the market. But there is another important think that we have to taking into account…
Just above the market – XOP target, and this area as a magnet. Personally, I will not even think about establishing long-term Short position, until market is reached it… At the same time XOP coincides with weekly Confluence resistance and daily overbought area – market should bounce from this level at minimum. XOP is an area where bull party will be over or at least taking a pause.
Third, the blue dash line weekly Pivot point. I’ve said million if times that Pivot points are very important. On Thursday we’ve discussed the possible reversal on the market to the upside, and I’ve said that if market will move above weekly pivot – up move should continue. So, that had happened. But let’s see how to trade current situation. Weekly Pivot for next week is at 1.2893. There will be very important price action on Monday. If market will test weekly Pivot and move above it – we can enter long.
That’s being said, personally I would like to be a buyer and enter on a pullback. 1.2893 – weekly Pivot. If market will test it and move above it, intraday trend turns bullish – we can enter “Long” with XOP target.
Let’s look at lower time frame.
1-Hour
Short-term time frame has no definite signal for now. Price action is a choppy a bit. The trend line is a lower border of possible triangle pattern (not shown, and looks clearer at 4-hour chart). The Friday’s deep looks to me as a W&R, because recovery was almost as fast as collapse. Trend is bullish, weekly Pivot point just below the market. In general, I will track two levels – 1.2730 lows and weekly Pivot support 1 – market should hold it if bulls intend to stay in charge, and weekly Pivot point at 1.2893. I do not tell you “Buy” right at weekly pivot. Personally, I will track action around it. What does it mean? Very probable that market will pierce it, or even move below it on Monday. I will be looking for reverse move above the Pivot – if it will happen, I will wait for shifting hour trend to bullish. After that – I will enter “Long” on a small hourly retracement. Hourly trend will be bullish, daily trend will be bullish and market will be above the weekly Pivot. This is a good combination. I just will not enter if something will go wrong. For example, market will stay below weekly Pivot, or break lows at 1.2730. The main rule – do not run ahead of train.
That’s being said – In a long term I expect start of a B&B “Sell” trade with a possible target at 1.2350. Market does not reach yet the level from which it can start. I think that this will be an area around 1.3133 – XOP target. Even if market will not start move to 1.2350 - it should bounce from there, because this is a strong resistance.
It means that until 1.3133 – we can enter long. The context for this – daily trend is bullish, no overbought, MACDP failure signal. Market has closed above weekly pivot on previous week.
How to enter long with an XOP target? Wait, until market will test weekly Pivot point on Monday – end we may enter only when market will return above weekly Pivot and hourly trend will turn bullish. There is need not to say that 1.2730 lows and weekly Pivot support 1 should hold.
If market will stay below weekly Pivot or even 1.2730 lows will be taken out – we can expect deeper retracement down.
")