Sive Morten
Special Consultant to the FPA
- Messages
- 18,648
Monthly
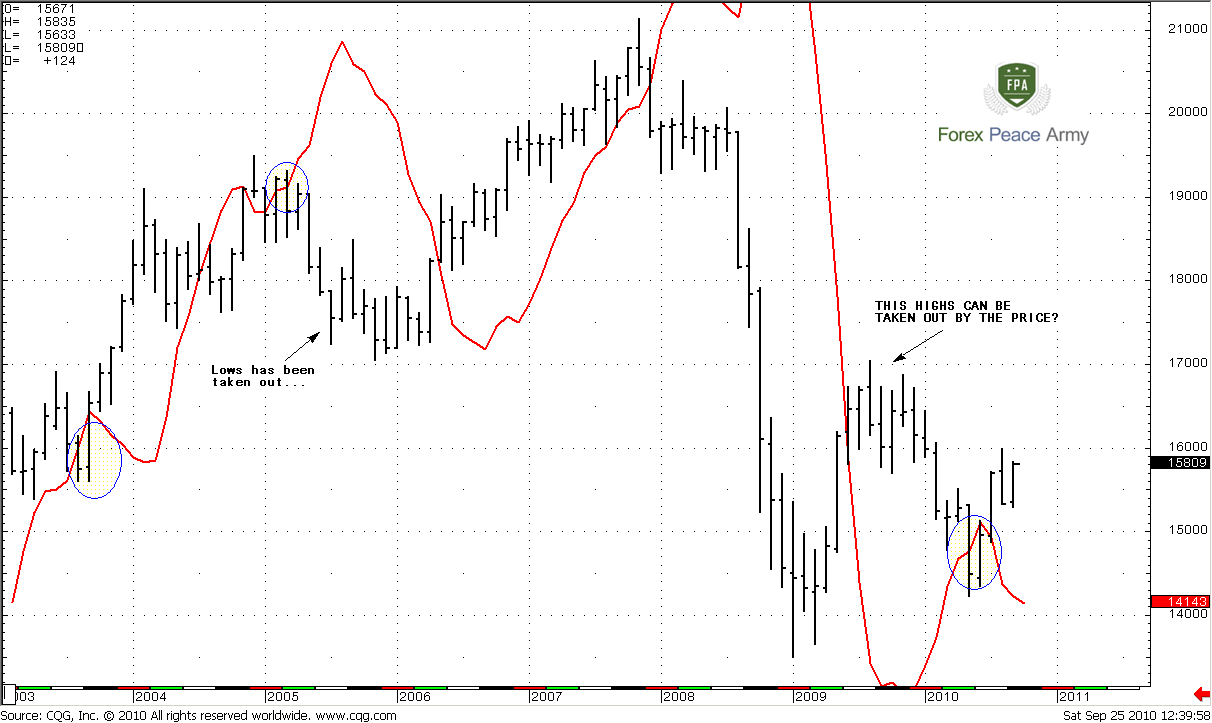
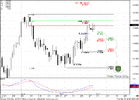
Today, I would like to show you interesting stuff. Look at monthly #1 chart. The red line is a MACD Predictor. There are some ellipses on the chart where market has shown trend shifting to the opposite, but during the next month has negated this shift. After this kind of signal market has shown strong move the opposite direction, so that previous extremes were taken out. Now let’s look at the previous price action – see the same pattern just two months ago. Will it lead market to 1.70? Who knows… But we can’t exclude that, especially as price action currently confirms this assumption.
Monthly#1
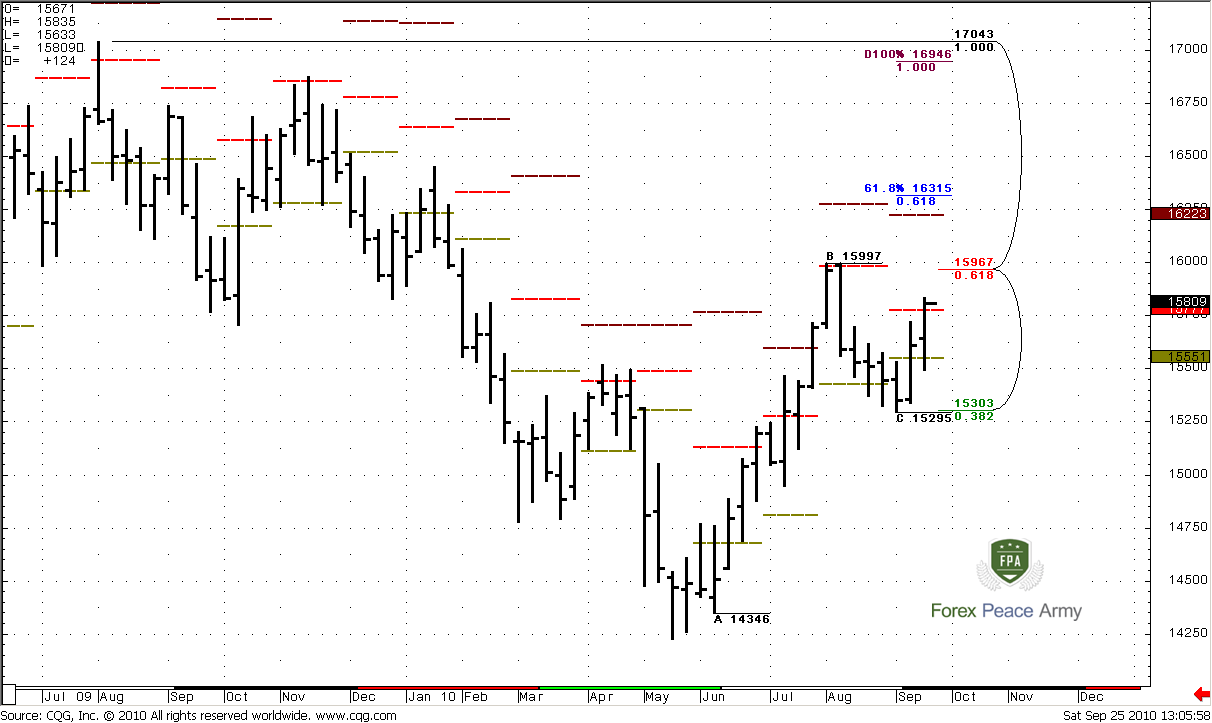
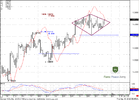
At the second chart #2 I just renew the previous picture. As we’ve estimated on the previous week, 1.35-1.40 area is a strong historical support, that includes major 5/8 support from a historical low in 1985. So, market has bounced from this level again, and this level of support holds market since 1992, when there was a first touch.
Monthly trend is bullish now, so, the next bullish target is 61.8% expansion from ABC-bottom pattern that agrees with deep 0.786 Fib resistance level and just above this area – 1.6623 monthly overbought level. Normal price action suggests that market should bounce from there. Context of possible move to 1.6422 stays intact until market will not break below C- point or shift trend.
Monthly#2
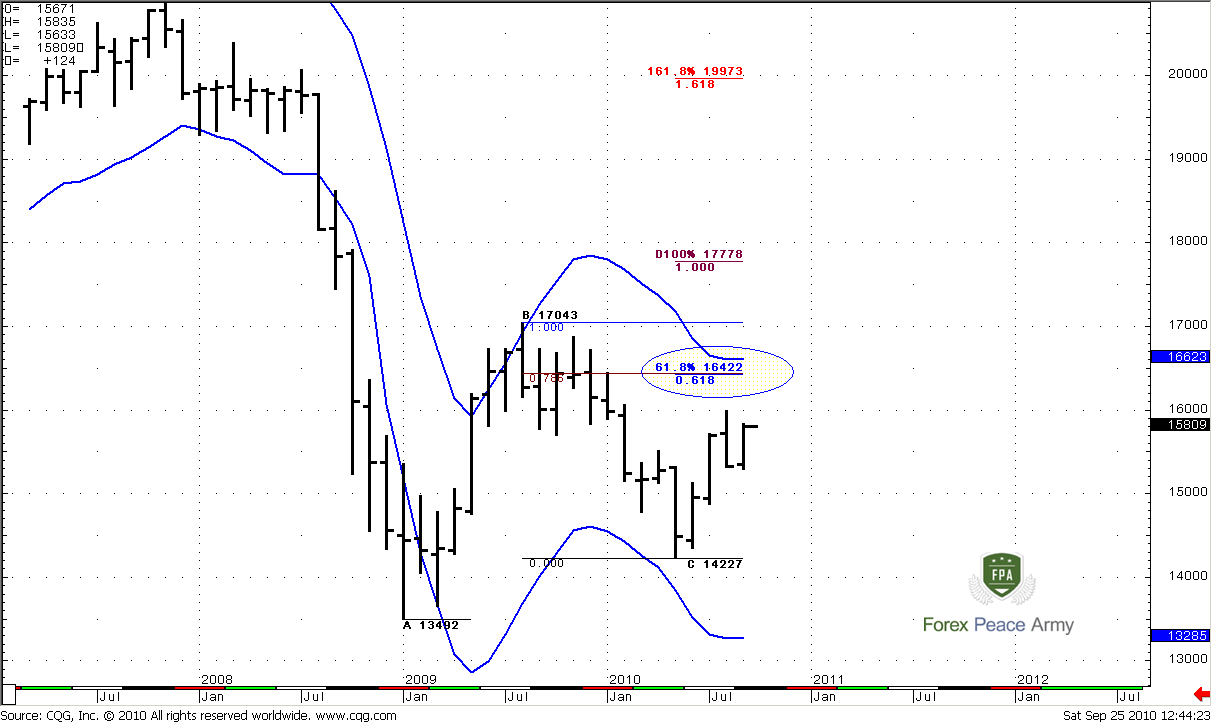
So, currently I think that move to 1.6422 on a monthly time frame is possible. This assumption will be canceled if market will move below 1.4230 area and trend turns bearish. Around 1.6422 price action can turn to Butterfly formation or triangle. But it’s a bit early to talk about. Also pattern of trend shifting failure assumes that market can even reach 1.7 area.
Weekly
There is no really interesting on this time frame. Trend is bullish, we have no overbought. Market has made a retracement and continues its move to the upside. Next level of resistance is the same – 1.5967 but it will be not so strong, when market will touch it for the second time. The nearest weekly target is 1.6315
Daily
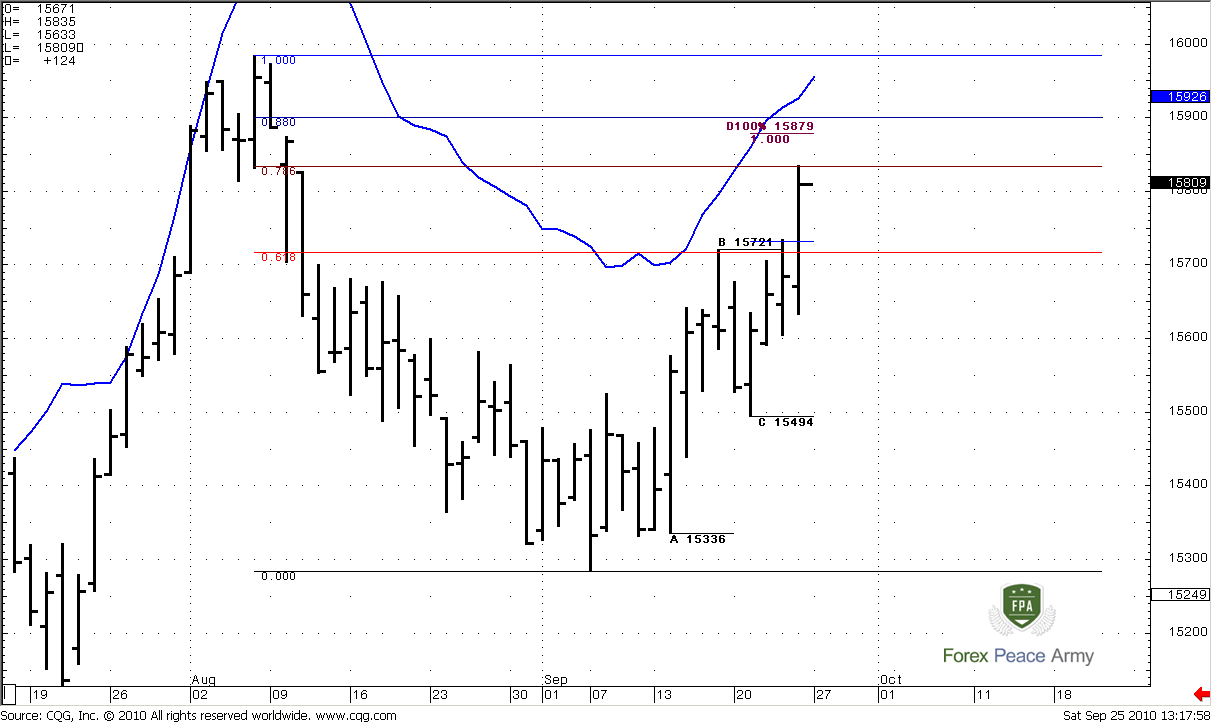
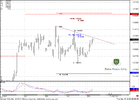
As I’ve said - the 0.618 resistance will not be so strong, when market will touch it for the second time, so that has happened and market broke it out and even has reached 0.786 Fib resistance. Trend is bullish, level of overbought above the market. The next target is 100% expansion at 1.5879 and I expect that market can reach it. If 0.786 level will stop market for awhile, then we will have a possibility to enter long. So let’s look at support levels and where is better to possess ourselves on the long side…
Daily#1
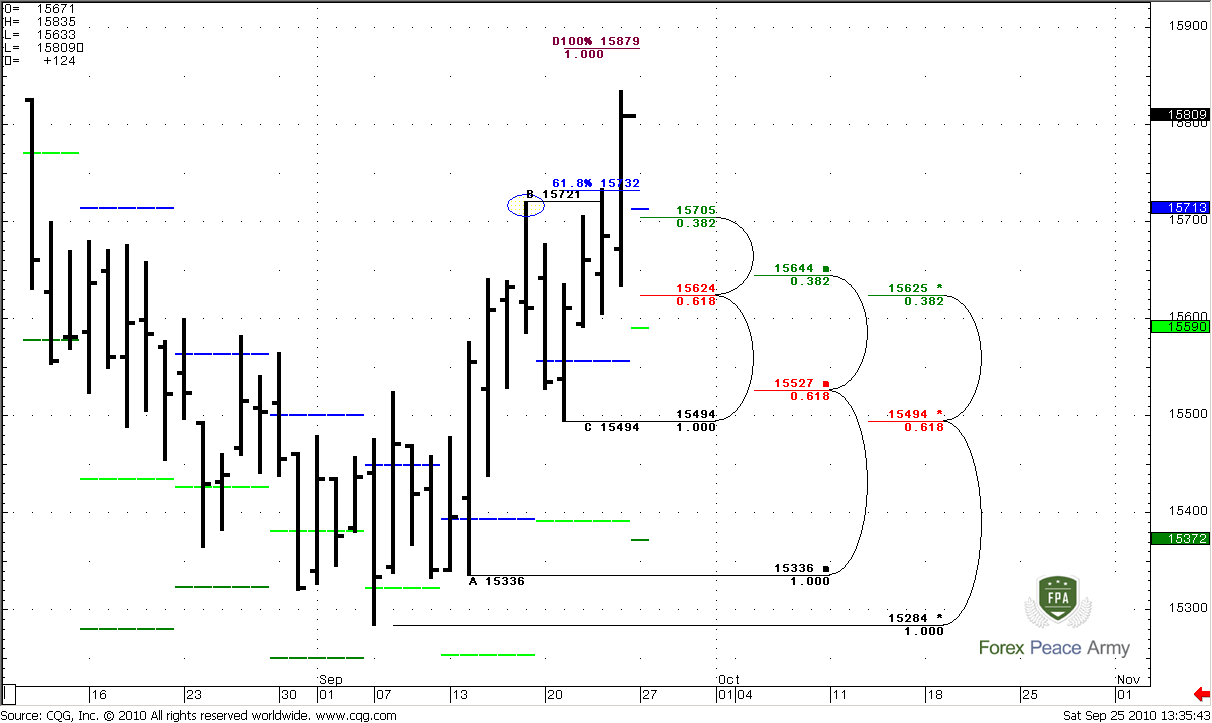
As contrasted with EUR, here I prefer the nearest support level to enter Long. Here is why – we do not at overbought and there is no strong resistance just above us. Market has touched 0.786 resistance already, and in general this is a minor level. So I suppose that we should come aboard aggressively. All trends are bullish. My preferable area to enter – first support at 1.5705-1.5720. It includes previous highs, weekly pivot at 1.5713 and daily Fib support at 1.5705. Also, 1.5732 – is a Fib expansion, that has been achieved and if market is really strong I do not like to see deep retracement and return under the previous highs. The next strong support is 1.5624-1.5625 Confluence Fib support. Enter on the first Fib support with stops below the Confluence looks like not bad idea.
Daily#2
4-hour
This time frame adds some details and now we can see, that in fact 1.5705-1.5710 – is 4-hour Confluence support, previous highs and weekly pivot at 1.5713. Also take a note of 1.5758 Fib support. I’ve drawn AB-CD move to Confluence support just as an example of price action that I’ll be watching for. Market can just reach a nearest support at 1.5758 and then continue it’s move up. In this scenario buying at 1.5758 with stop below 1.5705 will be good opportunity to enter long, but I still think that market should touch 1.5715-1.5720, because, usually, when market breaks previous highs, it retests them later.
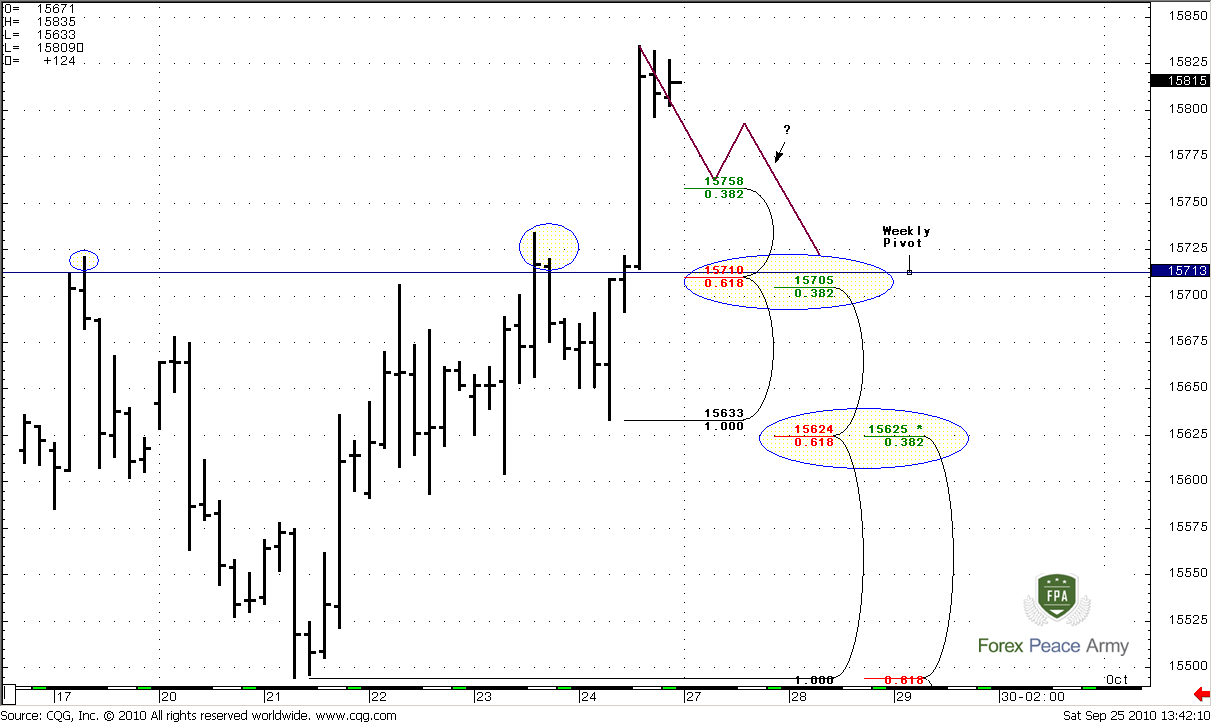
That’s being said, in contrast to EUR, we do not have overbought level and strong resistances above the market. Also market has passed already 61.8% expansion. So, I think that we should come aboard more aggressive than on EUR.
Personally, I will be watching for price action around two levels – 1.5758 and 1.5705-1.5710. Market can continue it’s move up from both of them. But I still think that 1.5705-1.5710 is more suitable, because very often market revisits previous highs before continuation move. The nearest target is 1.5879.
The technical portion of Sive's analysis owes a great deal to Joe DiNapoli's methods, and uses a number of Joe's proprietary indicators. Please note that Sive's analysis is his own view of the market and is not endorsed by Joe DiNapoli or any related companies.
Today, I would like to show you interesting stuff. Look at monthly #1 chart. The red line is a MACD Predictor. There are some ellipses on the chart where market has shown trend shifting to the opposite, but during the next month has negated this shift. After this kind of signal market has shown strong move the opposite direction, so that previous extremes were taken out. Now let’s look at the previous price action – see the same pattern just two months ago. Will it lead market to 1.70? Who knows… But we can’t exclude that, especially as price action currently confirms this assumption.
Monthly#1
At the second chart #2 I just renew the previous picture. As we’ve estimated on the previous week, 1.35-1.40 area is a strong historical support, that includes major 5/8 support from a historical low in 1985. So, market has bounced from this level again, and this level of support holds market since 1992, when there was a first touch.
Monthly trend is bullish now, so, the next bullish target is 61.8% expansion from ABC-bottom pattern that agrees with deep 0.786 Fib resistance level and just above this area – 1.6623 monthly overbought level. Normal price action suggests that market should bounce from there. Context of possible move to 1.6422 stays intact until market will not break below C- point or shift trend.
Monthly#2
So, currently I think that move to 1.6422 on a monthly time frame is possible. This assumption will be canceled if market will move below 1.4230 area and trend turns bearish. Around 1.6422 price action can turn to Butterfly formation or triangle. But it’s a bit early to talk about. Also pattern of trend shifting failure assumes that market can even reach 1.7 area.
Weekly
There is no really interesting on this time frame. Trend is bullish, we have no overbought. Market has made a retracement and continues its move to the upside. Next level of resistance is the same – 1.5967 but it will be not so strong, when market will touch it for the second time. The nearest weekly target is 1.6315
Daily
As I’ve said - the 0.618 resistance will not be so strong, when market will touch it for the second time, so that has happened and market broke it out and even has reached 0.786 Fib resistance. Trend is bullish, level of overbought above the market. The next target is 100% expansion at 1.5879 and I expect that market can reach it. If 0.786 level will stop market for awhile, then we will have a possibility to enter long. So let’s look at support levels and where is better to possess ourselves on the long side…
Daily#1
As contrasted with EUR, here I prefer the nearest support level to enter Long. Here is why – we do not at overbought and there is no strong resistance just above us. Market has touched 0.786 resistance already, and in general this is a minor level. So I suppose that we should come aboard aggressively. All trends are bullish. My preferable area to enter – first support at 1.5705-1.5720. It includes previous highs, weekly pivot at 1.5713 and daily Fib support at 1.5705. Also, 1.5732 – is a Fib expansion, that has been achieved and if market is really strong I do not like to see deep retracement and return under the previous highs. The next strong support is 1.5624-1.5625 Confluence Fib support. Enter on the first Fib support with stops below the Confluence looks like not bad idea.
Daily#2
4-hour
This time frame adds some details and now we can see, that in fact 1.5705-1.5710 – is 4-hour Confluence support, previous highs and weekly pivot at 1.5713. Also take a note of 1.5758 Fib support. I’ve drawn AB-CD move to Confluence support just as an example of price action that I’ll be watching for. Market can just reach a nearest support at 1.5758 and then continue it’s move up. In this scenario buying at 1.5758 with stop below 1.5705 will be good opportunity to enter long, but I still think that market should touch 1.5715-1.5720, because, usually, when market breaks previous highs, it retests them later.
That’s being said, in contrast to EUR, we do not have overbought level and strong resistances above the market. Also market has passed already 61.8% expansion. So, I think that we should come aboard more aggressive than on EUR.
Personally, I will be watching for price action around two levels – 1.5758 and 1.5705-1.5710. Market can continue it’s move up from both of them. But I still think that 1.5705-1.5710 is more suitable, because very often market revisits previous highs before continuation move. The nearest target is 1.5879.
The technical portion of Sive's analysis owes a great deal to Joe DiNapoli's methods, and uses a number of Joe's proprietary indicators. Please note that Sive's analysis is his own view of the market and is not endorsed by Joe DiNapoli or any related companies.
")