Sive Morten
Special Consultant to the FPA
- Messages
- 18,669
Fundamentals
I suppose that there are some moments have accumulated since we’ve talked about fundamentals last time. First of all, I would like to note, that pressure on USD will continue. Current run USD to the downside is driven mostly by fundamentals rather then other factors. And the main reason is a recent Fed policy. Continuation of QE (Support Emergency program for US economy), statement, that Fed will start to buyback US Treasuries from the market and may be even increase it’s value on Fed’s balance and talks about anemic situation in US economy are made clear for everybody that pace of recovery of US economy is slowing. This, in turn leads us to assumption that Fed fund rate in US will stay at 0.25% for a long time. Will we come to Japan scenario and will not be able to exit from a recession? I don’t think so. And the main reason for that is a big difference in population of US and Japan. US have a 2% annual increase in population while there is a decrease in Japan. Besides, US’s population is younger then in Japan.
The second US problem is a sunset of Bush’s tax cuts program that leads to uncertainty amongst small business and consumers. And this will press on Retail Sales, Consumer spending, their sentiment and other important moments. All these events will lead to lower interest rates and small demand for US assets and hence for USD. From the seasonal point of view, USD does not perform well in the second part of the year, especially in autumn and winter.
Now let’s shift to EU. Although EUR has gained well during the recent couple of months, I think EUR is overvalued and from fundamental point of view GBP is more preferable. Understand, currently, when US situation comes forward and attract most part of attention of investors, EU problems, especially PIIGS and peripheries did not disappear. They are just at backseat currently. EU economy is also weak, and I expect that ECB will not allow uncontrolled gain of EUR relative to USD. ECB can easily enter in currency wars sooner rather than later, as BoJ. As mentioned earlier, the recent discourse on the Fed’s possible credit easing has escalated the recent dollar negativity and maybe has lifted EUR/USD above an equilibrium for the cross. If the weak data continues in the US, EUR/USD may make a run further. Keep in mind however, that G3 central banks are now active participants in the currency wars. It is only a matter of time before Euro Zone officials start trying to talk down the euro.
Résumé: Despite possible occasional positive splashing in NFP or other fundamental indicators, overall economy situation in US and corresponding Fed’s policy will hold USD under pressure. At the same time, EU problems didn’t disappear, that’s why I think that EU a bit overvalued and think that GBP is more attractive currency. Nevertheless, if negative data continues to come from US, EUR/USD can run further.
Also I believe that ECB will start talking EUR down. This is just a question of time.
Monthly
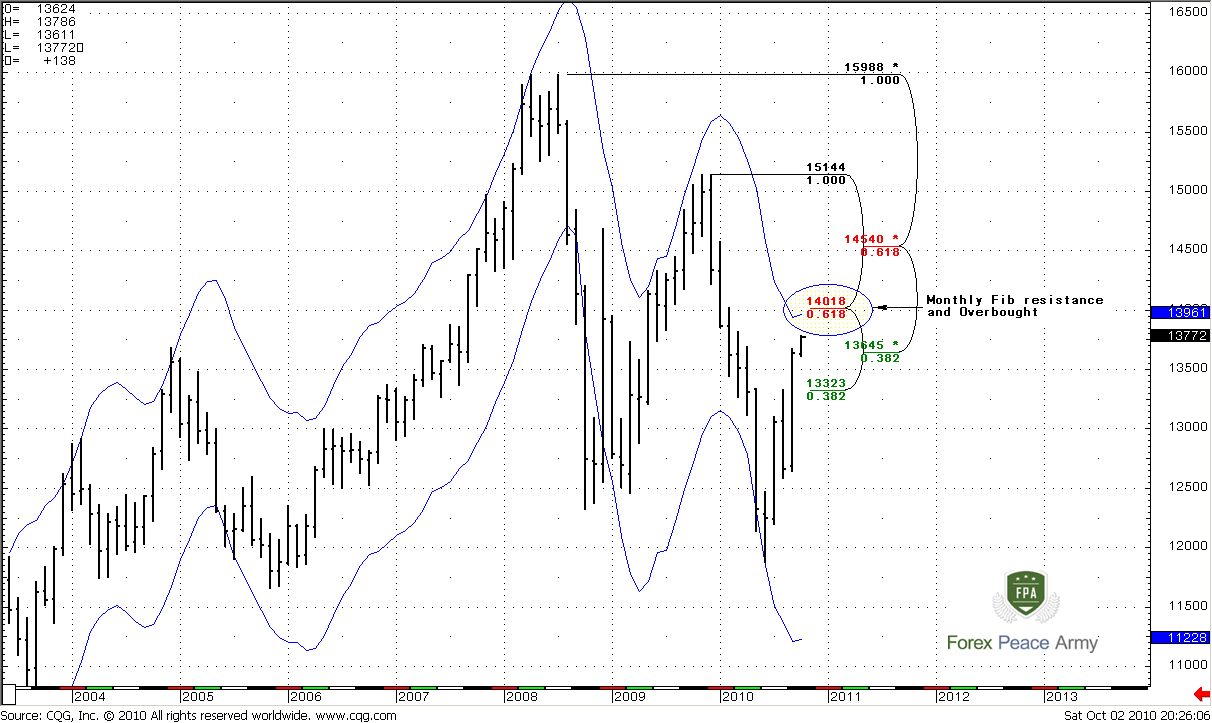
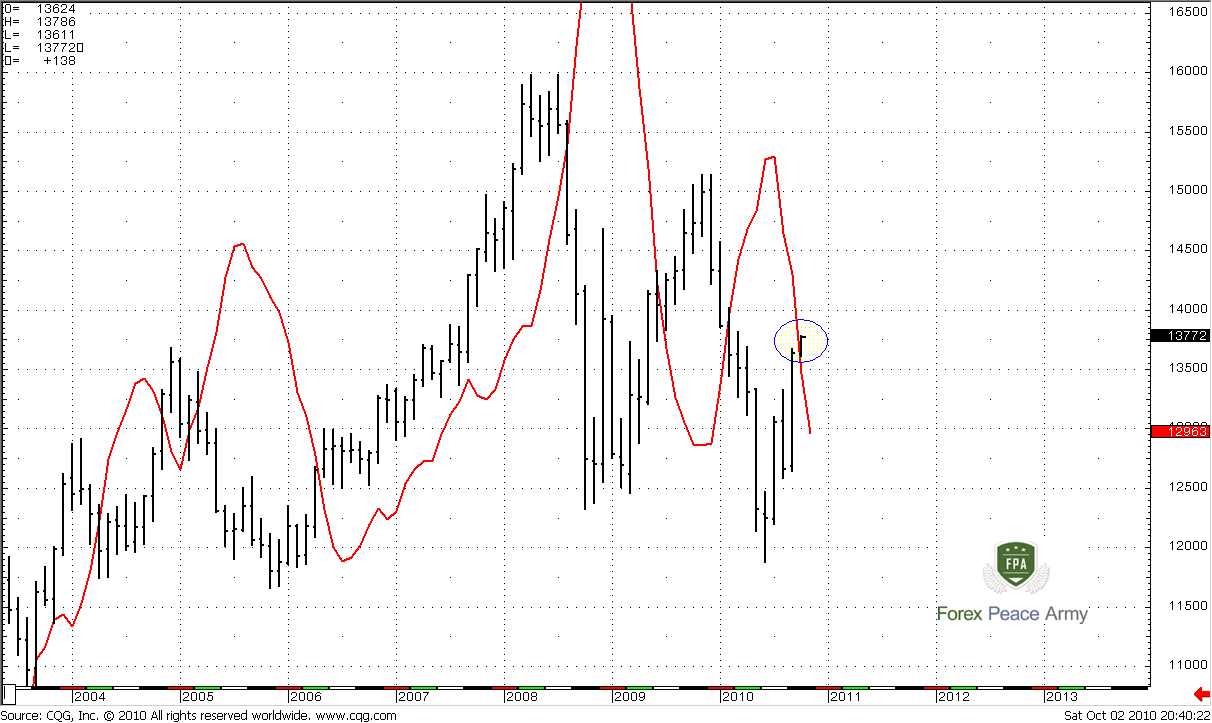
There are couple important moments on monthly chart. We will talk about resistances due exceptional strength of the market. Besides, monthly supports are far enough from current price levels.
First of all, look at blue lines on the chart #1. This is Oscillator Predictor that shows levels of oversold (lower band) and overbought (upper band) that is particularly interesting for us. Take a note how calm market has passed through two Fib resistances. Both of them are 3/8 resistances, but 1.3645 is a 0.382 resistance from a major all time high. This is strong level. This fact tells us about real strength of the market.
The next Fib resistance is 1.4018 and it’s very important for coming week, because it coincides with monthly overbought level that is 1.3961 for October. Market very often shows this kind of price action – when it has reached oversold, it can reach overbought. As you know, combination of strong Fib resistance with Overbought is DiNapoli Directional “Stretch” Sell pattern. It means that when market will reach overbought at Fib resistance we should look for some signs of weakness on lower time frames, such as weekly and daily. The approximate target of this possible Sell signal is a level in the middle between bands of Oscillator predictor – 1.30 area. This is large move, but if we can able to reach at least nearest 0.382 Fib support. This is already will be significant. For more detail analysis we should look at lower time frames. But keep in mind this area – 1.3961-1.4018.
#1
On the second chart I just want to show you that unconfirmed trend has turned bullish. I said “Unconfirmed” because October bar has not closed yet. We need close above the red line to talk about confirmation. One such a scenario however can be MACD failure signal, if October bar will close below red line. In this case we can expect move to previous lows…
#2
Weekly
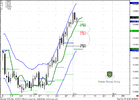
Weekly time frame has a crucial importance for coming week. It shows very important additional details for delicate analysis. So we’ve estimated the monthly level of resistance and overbought – 1.3961-1.4018. And now look at weekly time frame – 1.4046 is a weekly OP target that is a 100% expansion from ABC-bottom pattern. 1.40 – is a weekly oversold for coming week and 1.3994 is a monthly pivot resistance 1.
Also I’ve marked for you AB and CD moves (Z-form line on the chart). Look, how harmonic they are, how identical their speed. The more harmonic AB and CD legs, the more probable that we can meet a strong resistance at point “D”. Some traders call this pattern as “AB-CD Sell”, when they see perfect symmetry in their move.
Will market stop there and reverse to the down side? I don’t think so, and here is why. Remember what we’ve talked about in previous research. Right, 1.3446-1.3489 that was weekly Confluence resistance, 0.618% expansion target, daily overbought and some kind of pivot resistance (I do not remember which one). And what? Market didn’t even a bounce from there. It has passed through strong resistance like a hot knife through the butter. Also, look, how market increase speed from 61,8% to 100% expansion target. This is a sign that there is a solid probability that market can go further to the 1.618 expansion at 1.4948 area. But, I believe that market definitely will bounce from 1.40, and sometimes this retracement is deep, as far as 0.618 from the whole move up.
#1
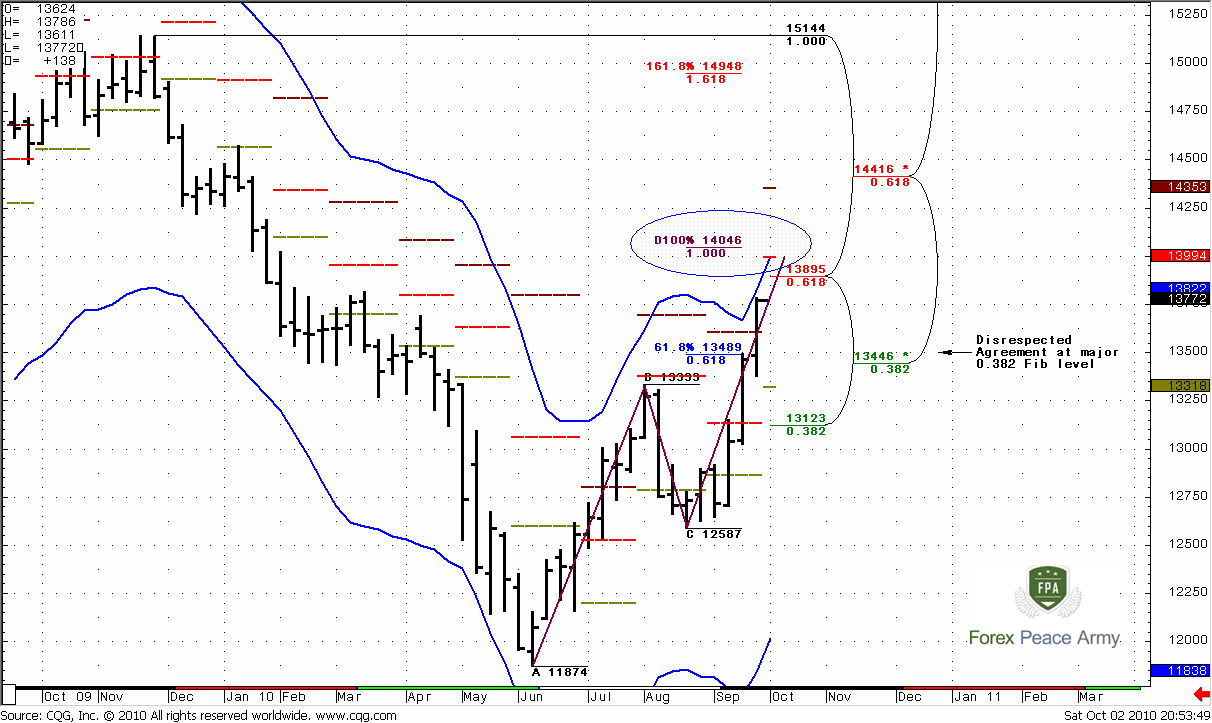
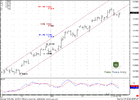
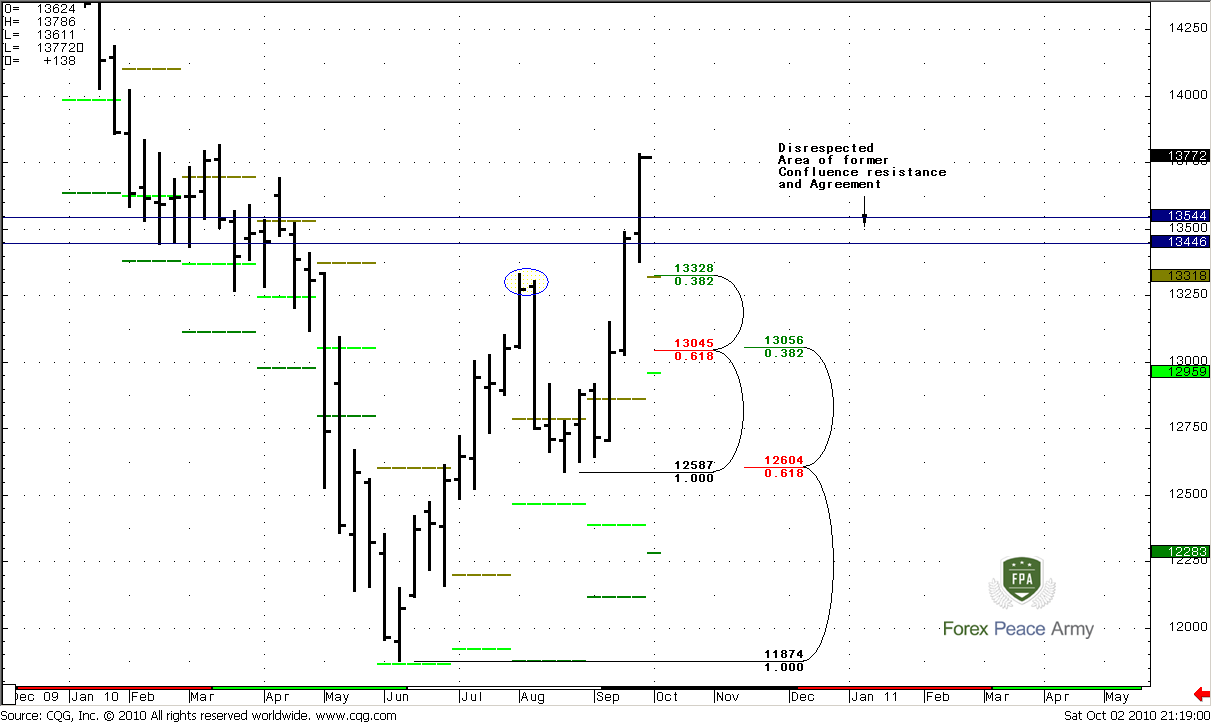
On the second chart I want to show you levels of support, that can be used for enter on the Long side, if market will show some retracement before reaching the D point at 1.4046. Personally, I think that market should not show deeper retracement than first level at 1.3318-1.3328. It includes monthly pivot point, Fib support and previous highs at 1.3333. The next Fib support area is much stronger. This is a weekly Confluence support and monthly pivot support 1.2959-1.3056. But, if market will reach this area, it should move below previous highs and below achieved 61.8% expansion target. This is not good for Bull momentum. I do not expect that market will reach it before 1.4048.
But there is another hidden support level is existed. The Disrespected weekly Confluence support and Agreement at 1.3446- 1.3544. So, I prefer to see retracement to this level or to 1.3330. This will be normal and expected. The deeper retracement is not nice for Bulls. If market is really strong, it should not retrace too deep.
#2
Daily
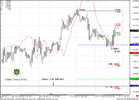
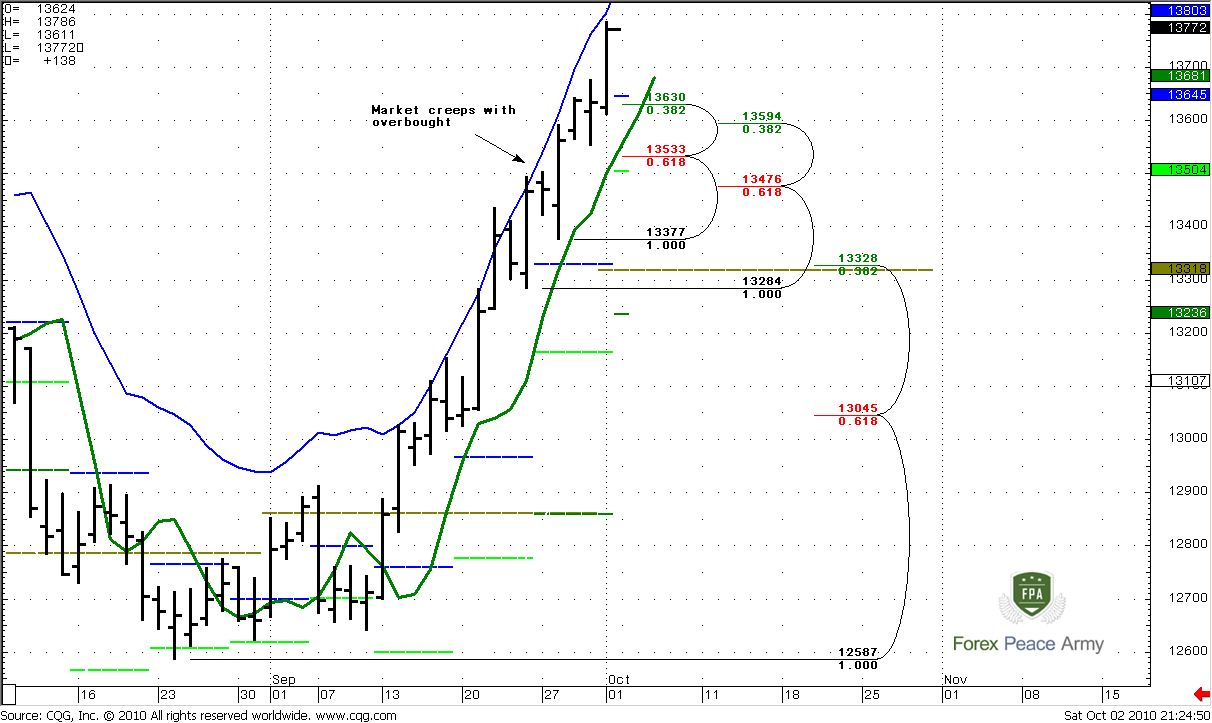
Now some important moments from daily time frame. First of all, look how market just creeps with overbought blue line. This is very important, because financial markets, as contrasted with commodities, rare stay at overbought or oversold for a long time. If this happens, it means that there is really strong buying on the market. Second, the green line on the chart is 3x3 SMA and we have a really excellent thrust. So, if we will see any close below this line, this can be the first bell of possible B&B or even DRPO directional trade. I do not see any right now, but I just inform you what we should look for during coming week. Speaking about supports, I like 1.35-3533 area, or maybe 1.3476. First, because it coincides with weekly disrespected level, that we’ve talked about, second, because it below 3x3 and just above weekly pivot support 1 (small Lime line on the chart). And when market makes retracement during strong up move, it usually retraces to weekly pivot support 1. Also I’ve drawn for you other levels as well.
You may ask, why I do not talk about the first Fib support at 1.3630 and about weekly pivot at 1.3645 that I usually do. Well, we’re at daily overbought, so I suppose that market should show a bit deeper retracement, and the highest levels are not very interesting for possession on the Long side of the market.
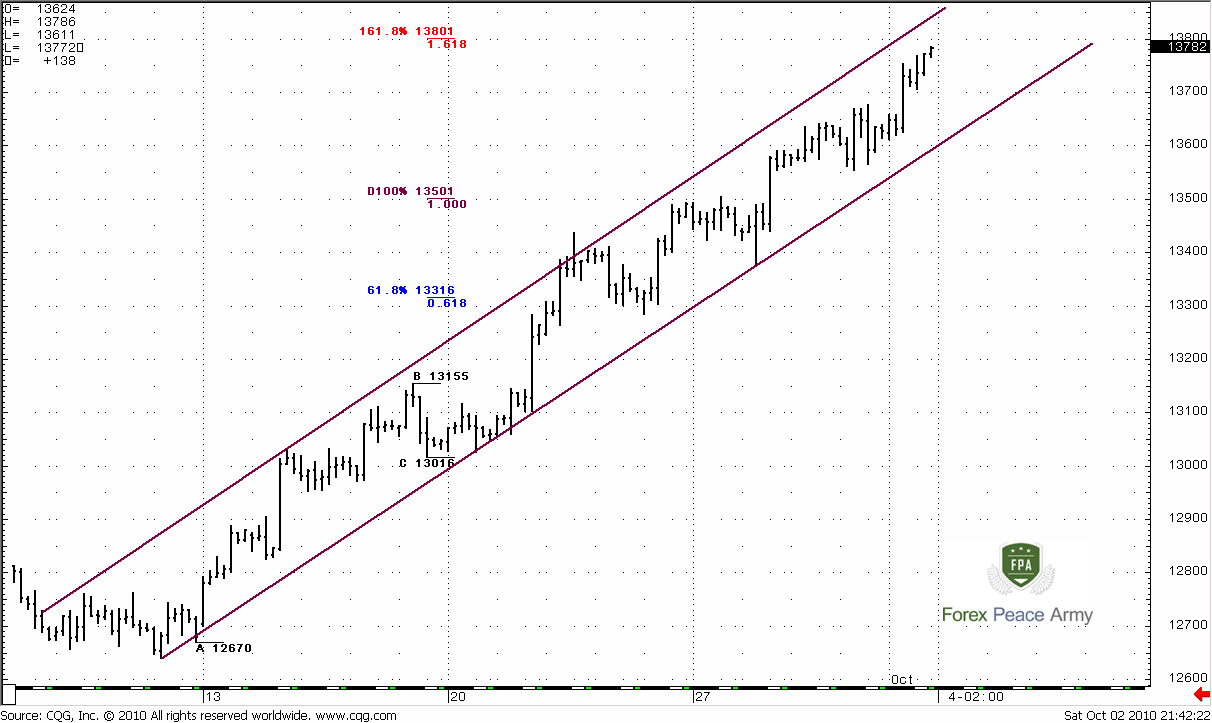
4-Hour
Well, this time frame does show us nothing except parallel channel and 161.8% expansion target at 1.38. May be retracement can start from 1.38, when market will achieve it. But for now I do not see anything at this time frame, that can help us in estimation of possible start of retracement and its deepness.
Conclusion:
Long-term. Market should show retracement to the downside, possibly as deep as 1.30 level. Then move to 1.4948 is very probable. I strongly recommend you do not establish “Long” positions right now, because we at monthly/weekly overbought and monthly Fib resistance. Wait the end of retracement.
Short term
After reaching 1.38 market can start retracement to the down side. I do not expect that it will be deep. We can enter “Long” from 1.35-1.3540 area, just be sure that market is retracing and not show impulse fast move against you. Move to the downside should be gradual. When entered, you can possess yourself till 1.4046 target or just trade B&B daily trade, because we have a really excellent up thrust.
The technical portion of Sive's analysis owes a great deal to Joe DiNapoli's methods, and uses a number of Joe's proprietary indicators. Please note that Sive's analysis is his own view of the market and is not endorsed by Joe DiNapoli or any related companies.
I suppose that there are some moments have accumulated since we’ve talked about fundamentals last time. First of all, I would like to note, that pressure on USD will continue. Current run USD to the downside is driven mostly by fundamentals rather then other factors. And the main reason is a recent Fed policy. Continuation of QE (Support Emergency program for US economy), statement, that Fed will start to buyback US Treasuries from the market and may be even increase it’s value on Fed’s balance and talks about anemic situation in US economy are made clear for everybody that pace of recovery of US economy is slowing. This, in turn leads us to assumption that Fed fund rate in US will stay at 0.25% for a long time. Will we come to Japan scenario and will not be able to exit from a recession? I don’t think so. And the main reason for that is a big difference in population of US and Japan. US have a 2% annual increase in population while there is a decrease in Japan. Besides, US’s population is younger then in Japan.
The second US problem is a sunset of Bush’s tax cuts program that leads to uncertainty amongst small business and consumers. And this will press on Retail Sales, Consumer spending, their sentiment and other important moments. All these events will lead to lower interest rates and small demand for US assets and hence for USD. From the seasonal point of view, USD does not perform well in the second part of the year, especially in autumn and winter.
Now let’s shift to EU. Although EUR has gained well during the recent couple of months, I think EUR is overvalued and from fundamental point of view GBP is more preferable. Understand, currently, when US situation comes forward and attract most part of attention of investors, EU problems, especially PIIGS and peripheries did not disappear. They are just at backseat currently. EU economy is also weak, and I expect that ECB will not allow uncontrolled gain of EUR relative to USD. ECB can easily enter in currency wars sooner rather than later, as BoJ. As mentioned earlier, the recent discourse on the Fed’s possible credit easing has escalated the recent dollar negativity and maybe has lifted EUR/USD above an equilibrium for the cross. If the weak data continues in the US, EUR/USD may make a run further. Keep in mind however, that G3 central banks are now active participants in the currency wars. It is only a matter of time before Euro Zone officials start trying to talk down the euro.
Résumé: Despite possible occasional positive splashing in NFP or other fundamental indicators, overall economy situation in US and corresponding Fed’s policy will hold USD under pressure. At the same time, EU problems didn’t disappear, that’s why I think that EU a bit overvalued and think that GBP is more attractive currency. Nevertheless, if negative data continues to come from US, EUR/USD can run further.
Also I believe that ECB will start talking EUR down. This is just a question of time.
Monthly
There are couple important moments on monthly chart. We will talk about resistances due exceptional strength of the market. Besides, monthly supports are far enough from current price levels.
First of all, look at blue lines on the chart #1. This is Oscillator Predictor that shows levels of oversold (lower band) and overbought (upper band) that is particularly interesting for us. Take a note how calm market has passed through two Fib resistances. Both of them are 3/8 resistances, but 1.3645 is a 0.382 resistance from a major all time high. This is strong level. This fact tells us about real strength of the market.
The next Fib resistance is 1.4018 and it’s very important for coming week, because it coincides with monthly overbought level that is 1.3961 for October. Market very often shows this kind of price action – when it has reached oversold, it can reach overbought. As you know, combination of strong Fib resistance with Overbought is DiNapoli Directional “Stretch” Sell pattern. It means that when market will reach overbought at Fib resistance we should look for some signs of weakness on lower time frames, such as weekly and daily. The approximate target of this possible Sell signal is a level in the middle between bands of Oscillator predictor – 1.30 area. This is large move, but if we can able to reach at least nearest 0.382 Fib support. This is already will be significant. For more detail analysis we should look at lower time frames. But keep in mind this area – 1.3961-1.4018.
#1
On the second chart I just want to show you that unconfirmed trend has turned bullish. I said “Unconfirmed” because October bar has not closed yet. We need close above the red line to talk about confirmation. One such a scenario however can be MACD failure signal, if October bar will close below red line. In this case we can expect move to previous lows…
#2
Weekly
Weekly time frame has a crucial importance for coming week. It shows very important additional details for delicate analysis. So we’ve estimated the monthly level of resistance and overbought – 1.3961-1.4018. And now look at weekly time frame – 1.4046 is a weekly OP target that is a 100% expansion from ABC-bottom pattern. 1.40 – is a weekly oversold for coming week and 1.3994 is a monthly pivot resistance 1.
Also I’ve marked for you AB and CD moves (Z-form line on the chart). Look, how harmonic they are, how identical their speed. The more harmonic AB and CD legs, the more probable that we can meet a strong resistance at point “D”. Some traders call this pattern as “AB-CD Sell”, when they see perfect symmetry in their move.
Will market stop there and reverse to the down side? I don’t think so, and here is why. Remember what we’ve talked about in previous research. Right, 1.3446-1.3489 that was weekly Confluence resistance, 0.618% expansion target, daily overbought and some kind of pivot resistance (I do not remember which one). And what? Market didn’t even a bounce from there. It has passed through strong resistance like a hot knife through the butter. Also, look, how market increase speed from 61,8% to 100% expansion target. This is a sign that there is a solid probability that market can go further to the 1.618 expansion at 1.4948 area. But, I believe that market definitely will bounce from 1.40, and sometimes this retracement is deep, as far as 0.618 from the whole move up.
#1
On the second chart I want to show you levels of support, that can be used for enter on the Long side, if market will show some retracement before reaching the D point at 1.4046. Personally, I think that market should not show deeper retracement than first level at 1.3318-1.3328. It includes monthly pivot point, Fib support and previous highs at 1.3333. The next Fib support area is much stronger. This is a weekly Confluence support and monthly pivot support 1.2959-1.3056. But, if market will reach this area, it should move below previous highs and below achieved 61.8% expansion target. This is not good for Bull momentum. I do not expect that market will reach it before 1.4048.
But there is another hidden support level is existed. The Disrespected weekly Confluence support and Agreement at 1.3446- 1.3544. So, I prefer to see retracement to this level or to 1.3330. This will be normal and expected. The deeper retracement is not nice for Bulls. If market is really strong, it should not retrace too deep.
#2
Daily
Now some important moments from daily time frame. First of all, look how market just creeps with overbought blue line. This is very important, because financial markets, as contrasted with commodities, rare stay at overbought or oversold for a long time. If this happens, it means that there is really strong buying on the market. Second, the green line on the chart is 3x3 SMA and we have a really excellent thrust. So, if we will see any close below this line, this can be the first bell of possible B&B or even DRPO directional trade. I do not see any right now, but I just inform you what we should look for during coming week. Speaking about supports, I like 1.35-3533 area, or maybe 1.3476. First, because it coincides with weekly disrespected level, that we’ve talked about, second, because it below 3x3 and just above weekly pivot support 1 (small Lime line on the chart). And when market makes retracement during strong up move, it usually retraces to weekly pivot support 1. Also I’ve drawn for you other levels as well.
You may ask, why I do not talk about the first Fib support at 1.3630 and about weekly pivot at 1.3645 that I usually do. Well, we’re at daily overbought, so I suppose that market should show a bit deeper retracement, and the highest levels are not very interesting for possession on the Long side of the market.
4-Hour
Well, this time frame does show us nothing except parallel channel and 161.8% expansion target at 1.38. May be retracement can start from 1.38, when market will achieve it. But for now I do not see anything at this time frame, that can help us in estimation of possible start of retracement and its deepness.
Conclusion:
Long-term. Market should show retracement to the downside, possibly as deep as 1.30 level. Then move to 1.4948 is very probable. I strongly recommend you do not establish “Long” positions right now, because we at monthly/weekly overbought and monthly Fib resistance. Wait the end of retracement.
Short term
After reaching 1.38 market can start retracement to the down side. I do not expect that it will be deep. We can enter “Long” from 1.35-1.3540 area, just be sure that market is retracing and not show impulse fast move against you. Move to the downside should be gradual. When entered, you can possess yourself till 1.4046 target or just trade B&B daily trade, because we have a really excellent up thrust.
The technical portion of Sive's analysis owes a great deal to Joe DiNapoli's methods, and uses a number of Joe's proprietary indicators. Please note that Sive's analysis is his own view of the market and is not endorsed by Joe DiNapoli or any related companies.
")