AUD/USD Daily Video, October 26, 2010

Sive Morten

Special Consultant to the FPA
Messages
18,621
Hello everybody,

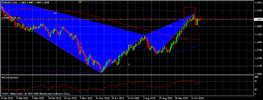
There is really nothing interesting on GBP and EUR - price action is choppy there, so, this leads me to look at other pairs, and situation on Aussie I've found interesting. Also, as a small bonus, I take a fast look at 4-hour EUR FX, just to see, how is there our possible butterfly:


technical portion of Sive's analysis owes a great deal to Joe DiNapoli's methods, and uses a number of Joe's proprietary indicators. Please note that Sive's analysis is his own view of the market and is not endorsed by Joe DiNapoli or any related companies.
 
Last edited by a moderator:
Hello Sive

We cant see the video as it says video not available. Can you please check this?

Thanks
Mili
 
I cant see the video...besides i wanted to ask you a aquestoin steve..

how much should we expect to make profit in a month .. i heared 5% is really good.. what is your oppinion?
 
Hi sive morten

Good Morning

Just like the focus of some traders....

are we looking towards 0.9975 and parity?

Thanks for the video but I the video is not showing.

I think it is on verification.

I have not been able to watch the video.

Thanks as your reply will be awaited.

Thanks.
 
Video is Ok,

We will touch at least monthly 0.618 Fib expansion target from recent ABC.
But, when it usually happens, market participants should run prices to the parity... Besides, it's impossible to talk about monthly target pips to pips, it's just nonsense.
 
I posted something on GBP USD video thread

Hi Sive Morten

I'm sorry to post this here.

I have posted something on the GBP USD video thread.

Please I really need your reply.

I also want to know if the strong GBP(q/q) data for gbp will let the market to remain positioned to the upside.

Is downside temporary context still valid.....as in 1.5650 level?

Please your reply is highly awaited.

Thanks for your help.

Hi, Forexclue. Well, market can remain positioned to the upside. Because, if you've read weekly thread carefully, market just above one of the strong support areas. And the main question was - will it pass through or not.
Also, remember, that I've talked about possible MACD Predictor failure signal on a weekly chart. In one word, this signal is forming right now and for termination and completing trend shifting to bearish, market has to close below 1.5690 on Friday. If this will not happen, then we can see a new highs on GBP...
 
EurUsd

Hello Sive,

I believe the euro retracement to the downside is now underway as of October 25 with a bearish candle on the daily timeframe and price pivoting above and now below 1.3950. The daily timeframe shows a butterfly sell pattern that begins on November 29, 2009 at 1.5144. Price has made a .707 fibo retracement from that high to the 1.1876 low, at 1.4158.

This sell pattern may not hold if price bounces from the 1.3763 support you reference in your daily video analysis. However, if price breaks this support, we may be in for a much deeper retracement, perhaps to 1.2748.

What do you think?

Thanks for your insight,

Jeremiah
 

Attachments

  • eur retracement begins10-25-10.gif
    eur retracement begins10-25-10.gif
    28.2 KB · Views: 220
Hello Sive,

I believe the euro retracement to the downside is now underway as of October 25 with a bearish candle on the daily timeframe and price pivoting above and now below 1.3950. The daily timeframe shows a butterfly sell pattern that begins on November 29, 2009 at 1.5144. Price has made a .707 fibo retracement from that high to the 1.1876 low, at 1.4158.

This sell pattern may not hold if price bounces from the 1.3763 support you reference in your daily video analysis. However, if price breaks this support, we may be in for a much deeper retracement, perhaps to 1.2748.

What do you think?

Thanks for your insight,

Jeremiah

Hi, Jeremiah.
In one word, your butterfly is not correct. Right wing should be higher/lower then left, and not inside it. In fact right wing is an expansion of left and not vice versa. Butterfly is not just a painting. ;)
 
Back
Top