Sive Morten
Special Consultant to the FPA
- Messages
- 18,648
Fundamentals
During the recent week on the surface there are a couple of events – FOMC statement and NFP data. Concerning the NFP – there is nothing really to add, because numbers are talk for themselves. NFP increased for 151K, compares to expectations of 60K. Besides, previous number was revised to upside from -95K to -41K. The conclusion about the FOMC statement is not so obvious and positive. All of you know that Fed intends to buy from the market 600 Bln. of bonds during the couple of quarters and hold rate low for the long time. There is a rule exists that buying of 100 Bln. of bonds is equivalent the reducing of Fed Fund rate for 0.1%. This method is used when rate at the lowest level and it’s impossible to stimulate an economy any other way. The main question however still stands – does money really flow in the real sector of economy, loans and credits, or they just return back to Fed? Because results of QE I program were shallow, Fed was not very successive in stimulating of credit and loan activity. Liquidity that was provided by Fed just stays on banks sheets.
At the same time, September Consumer Credit surges for 2.1 Bln. This was the first rise since January. Now we’ve seen impressive NFP. There are a lot of talks about strong contradiction between Republicans and Democrats that can negatively influence on economy, because it demands fast and strong decisions to be made fast and in time currently. But the majority of Republicans in Congress after the elections can let us hope that President Obama will have to extend Bush’s tax cut program. Buy purchasing US Treasuries Fed tries to keep rates low and make unattractive for US bank investing in government bonds. It should stimulate them to send money in loans and real sector of economy. So, may be US economy is ready to slowly turn back on the engine of growth that is credit.
Now let’s shift to EU. I suppose that in nearest future their problems will get more attention. Yields on Irish 10-year bonds are up for 1.2% in last two weeks as investors start to fear peripheral debt. The Russian sovereign wealth fund has declared Irish and Spanish debt ineligible for purchase and a UK clearing house stated that it may require clients to put up extra margin on Irish bonds. Portugal struggled and Ireland appears to be on the same path. Germany continues to push for a permanent crisis mechanism but ECB President Trichet has warned that such a tool would unnerve bonds markets. Moreover, Polish PM Tusk stated that changes to the treaty must be designed to benefit the needs of all members of the Euro-Zone not just to protect the interests of a few. “Neither a borrower nor lender be, for loan oft loses both itself and friend.” Europe is learning Shakespeare’s lesson the hard way.
Conclusion: Although we can see some improvements in macro US data, the question is how stable these improvements will be. FOMC policy will leave USD under pressure. At the same time, the problems in EU are escalating, so the domination EUR over USD due to difference in policy will gradually fade out. EUR starts to loose their positions against USD. As I’ve said a month ago, GBP has much more strong positions and more attractive against USD in long-term perspective.
Monthly
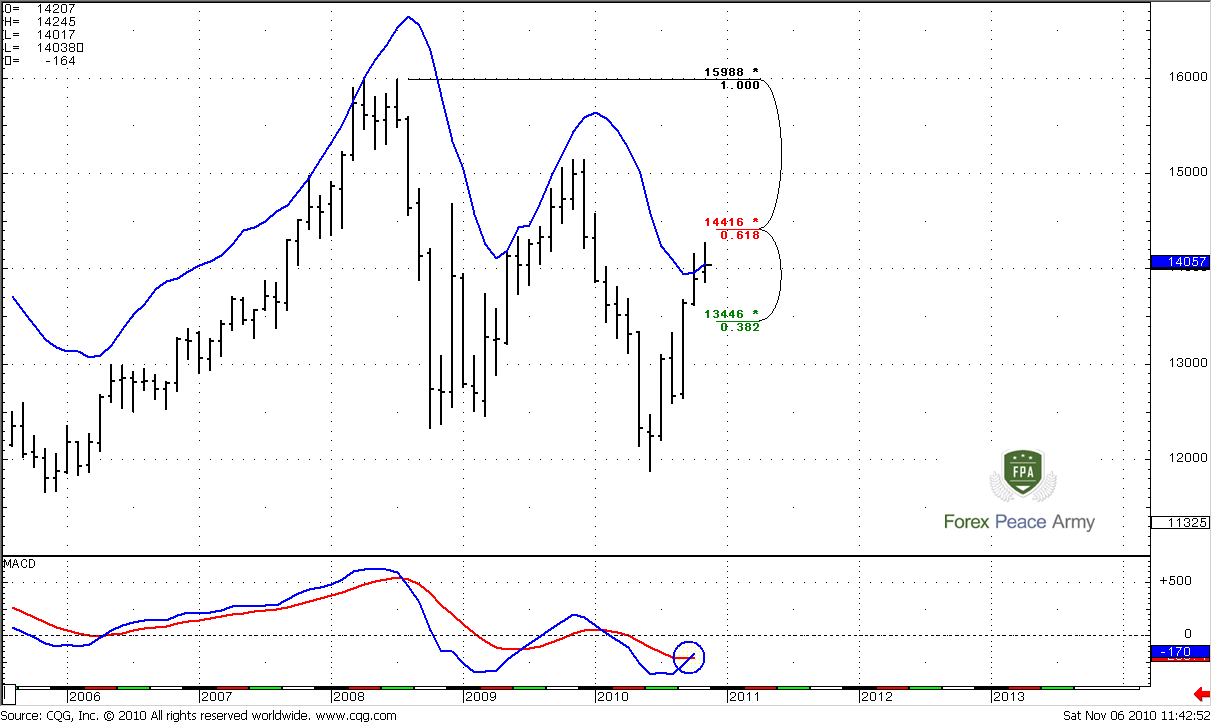
Although we didn’t talk about EUR currency for couple of weeks, there are no much changes on monthly chart. Trend shifting to bullish has confirmed now. For the second month market stays at monthly overbought level that is for November at 1.4057. It means that it’s not a time for establishing new long-term “Long” positions. The next resistance just above the market – 5/8 Fib resistance at 1.4416
#1
Weekly
On this time frame however, there are some important changes. Look at initial price action – market has accelerated from 61.8% expansion directly to 100% expansion and hit weekly overbought (the first circle). Market absolutely disrespected 61.8% target and didn’t even a bounce. Also note, that CD leg is faster than AB. Usually this kind of price action leads to 1.618% Fib expansion target that is at 1.4948, but after meaningful retracement. As a rule the depth of retracement is 5/8 Fib support from the latest swing up. This is at 1.3232-1.3558 area that includes weekly Confluence support, monthly pivot support 2 and previous highs at 1.3333.
And the first bell for starting of this retracement has rung already. Market has tried to move higher there was no overbought and any resistances above the market, but failed and shown wash and rinse of a previous highs. I believe that this is a sign that market is ready to move lower. I don’t confirm that it definitely will reach 1.33-1.35 area, but some move to the downside should happen.
The first level of support is monthly pivot point at 1.3885. If market will move below it, it will mean than bears take control of the market and we can count on deeper retracement, at least till next support level 1.3614-1.3631 – the combination Fib support and monthly pivot support 1.
Next support area is one that we’ve talked about already – 1.3232-1.3558. And the last gasp for the bulls – last 5/8 Fib support at 1.2792.
Also take a note that trend, based on MACDP (red line on the chart) will remain bullish even till 1.3232-1.3558 area. Personally, I think that either 1.3630 or 1.33 area should hold the market. IF not – then the further up move will be under question.
Daily
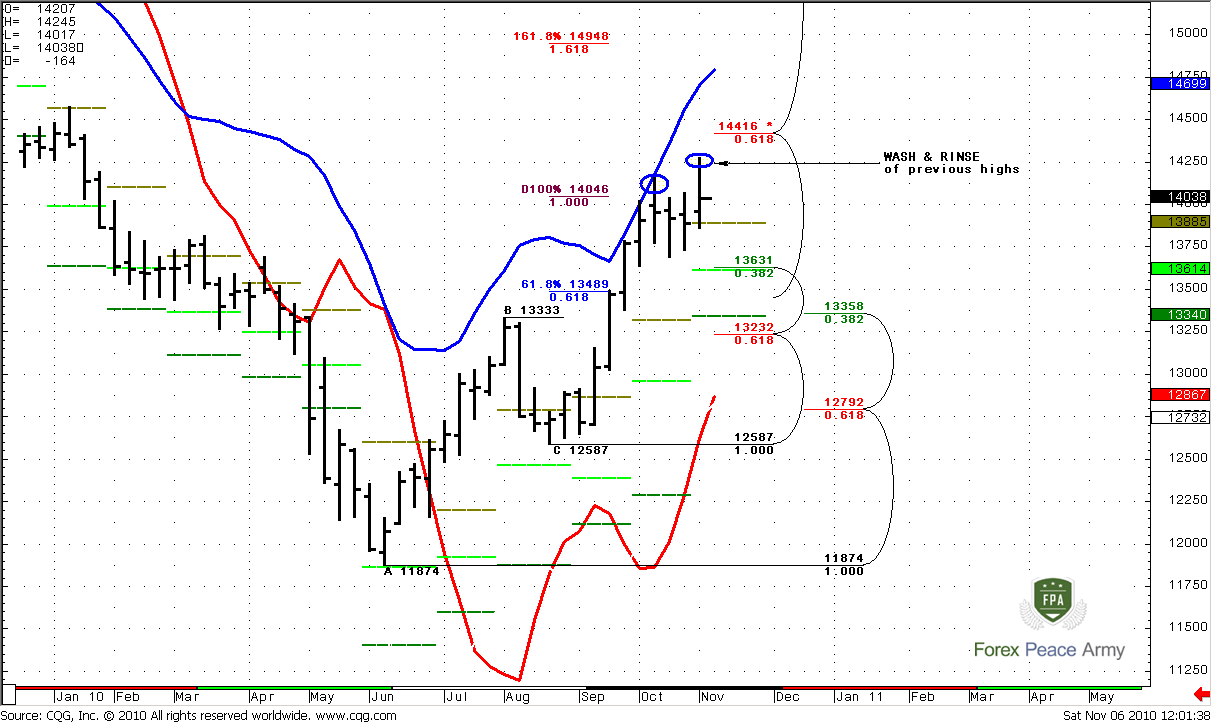
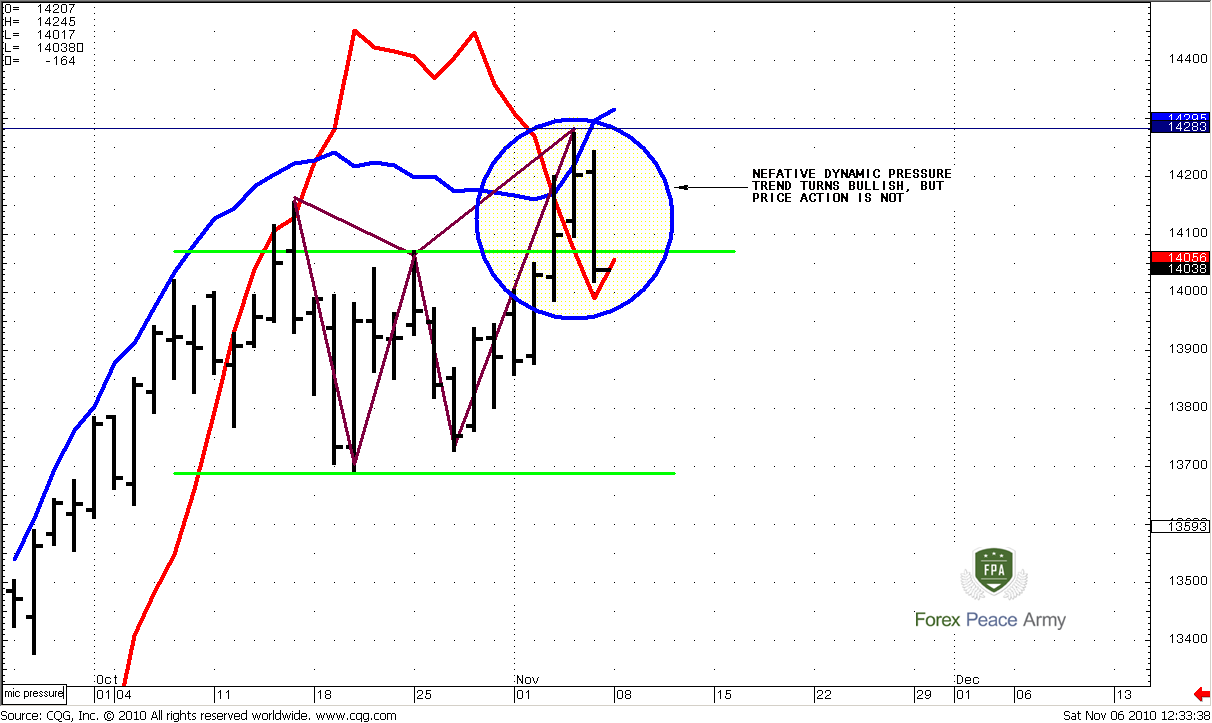
Before start talking about entry points, supports and resistance, let take a look at recent price action and I show you how you can get very important information if you’re attentive enough to nuances. For the first look on #1 there is not much interesting here. So, here is you home task – try to analyze this chart, before reading my analysis of this fragment, and then compare them. Here is your chart for analyzing, what can you say based on it?
#1
Here is my view. During couple of previous weeks market is forming a butterfly Sell pattern, with a 1.27 target around 1.4280 area. Until the moment of a last move in right wing of butterfly, market has been in the range. Now, market has shown upper breakout of the range, accomplished the butterfly, hit daily overbought and returned back in the range. Simultaneously, as we’ve talked in weekly time frame, market demonstrated a W&R of previous highs. What it can tells us about the targets to the downside? First, of all, as we’ve seen on example of USD/CHF trade – the target of the Butterfly is 1.618 expansion of a whole move to the upside – this is around 1.33 area (you can confirm it by yourself). Second, market has shown upper breakout failure of the range, so it should reach at least lower border of it. Furthermore, if market will break this trading range (lime lines) to the downside, then, according the rule, it should move to the downside at least the width of this range – this is also around 1.33 area.
And the last one. Look at the red line – this is MACD Predictor indicator. You can see, that trend has turned bullish – but price action is bearish. This is an excellent example of negative dynamic pressure that leads continuation of a down move.
#2
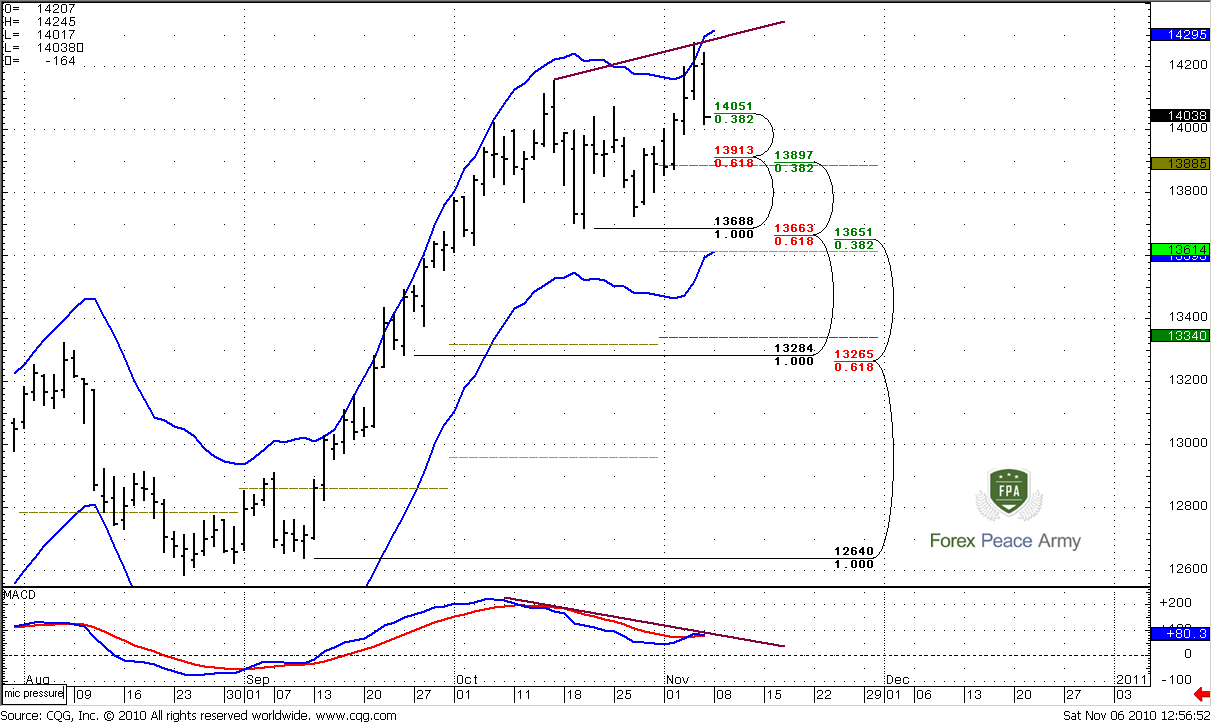
Ok, now let’s shift to particular levels. 1.4051 is not more the support level – it was penetrated by the price already. The next area of support – monthly pivot point and daily Confluence support at 1.3885-1.3913. And the next area – monthly pivot support 1, daily confluence support and daily oversold at 1.3614-1.3663. This is the last logical support area for nearest couple of days, because other support levels are beyond of daily oversold, so we will not speak about them currently.
By the way, you can see nice bearish divergence with MACD indicator…
#3
4-Hour
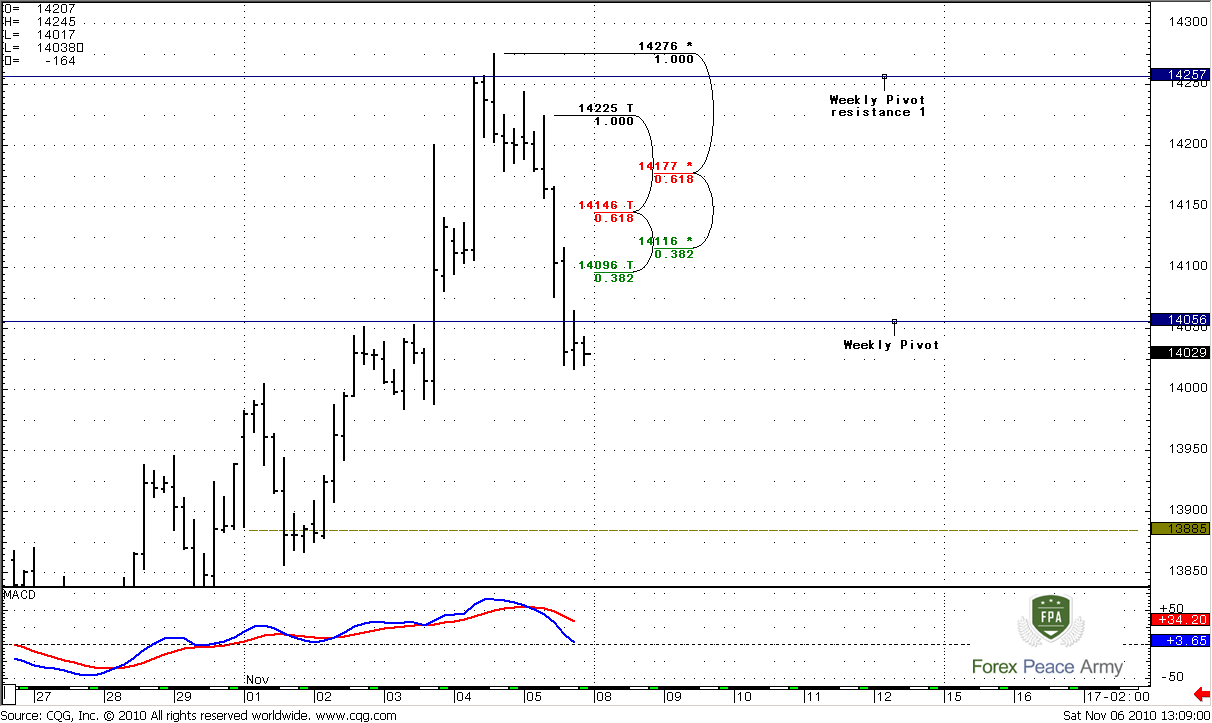
MACD gives perfect “sell” signal, very good angle of piercing lines. Nice thrust to the downside. Weekly pivot is very close to the market. If market will show continuation of a down move right after the opening, then, we can wait for some retracement up to weekly pivot for enter short. If market will open above it – then better wait some retracement to one of the levels that I show on the chart. The problem is that there are no definite swings currently for estimation ABC’s and Agreement areas to definitely speak about suitable areas for entering. But I suppose that 1.4150 is a not bad area, if market will show this retracement up.
Conclusion:
Long-term.
EUR has bullish bias but it overbought at monthly time frame. It’s not the time to establish long-term bullish position. Wait for retracement lower.
Short term
I have bearish view on EUR currency. The weakness on weekly time frame (Wash and Rinse) and failure to continue move to upside after normalizing overbought level makes me think that market is ready to retrace lower. I think that there are 2 possible targets for that – 1.36 or 1.33 areas.
The technical portion of Sive's analysis owes a great deal to Joe DiNapoli's methods, and uses a number of Joe's proprietary indicators. Please note that Sive's analysis is his own view of the market and is not endorsed by Joe DiNapoli or any related companies.
During the recent week on the surface there are a couple of events – FOMC statement and NFP data. Concerning the NFP – there is nothing really to add, because numbers are talk for themselves. NFP increased for 151K, compares to expectations of 60K. Besides, previous number was revised to upside from -95K to -41K. The conclusion about the FOMC statement is not so obvious and positive. All of you know that Fed intends to buy from the market 600 Bln. of bonds during the couple of quarters and hold rate low for the long time. There is a rule exists that buying of 100 Bln. of bonds is equivalent the reducing of Fed Fund rate for 0.1%. This method is used when rate at the lowest level and it’s impossible to stimulate an economy any other way. The main question however still stands – does money really flow in the real sector of economy, loans and credits, or they just return back to Fed? Because results of QE I program were shallow, Fed was not very successive in stimulating of credit and loan activity. Liquidity that was provided by Fed just stays on banks sheets.
At the same time, September Consumer Credit surges for 2.1 Bln. This was the first rise since January. Now we’ve seen impressive NFP. There are a lot of talks about strong contradiction between Republicans and Democrats that can negatively influence on economy, because it demands fast and strong decisions to be made fast and in time currently. But the majority of Republicans in Congress after the elections can let us hope that President Obama will have to extend Bush’s tax cut program. Buy purchasing US Treasuries Fed tries to keep rates low and make unattractive for US bank investing in government bonds. It should stimulate them to send money in loans and real sector of economy. So, may be US economy is ready to slowly turn back on the engine of growth that is credit.
Now let’s shift to EU. I suppose that in nearest future their problems will get more attention. Yields on Irish 10-year bonds are up for 1.2% in last two weeks as investors start to fear peripheral debt. The Russian sovereign wealth fund has declared Irish and Spanish debt ineligible for purchase and a UK clearing house stated that it may require clients to put up extra margin on Irish bonds. Portugal struggled and Ireland appears to be on the same path. Germany continues to push for a permanent crisis mechanism but ECB President Trichet has warned that such a tool would unnerve bonds markets. Moreover, Polish PM Tusk stated that changes to the treaty must be designed to benefit the needs of all members of the Euro-Zone not just to protect the interests of a few. “Neither a borrower nor lender be, for loan oft loses both itself and friend.” Europe is learning Shakespeare’s lesson the hard way.
Conclusion: Although we can see some improvements in macro US data, the question is how stable these improvements will be. FOMC policy will leave USD under pressure. At the same time, the problems in EU are escalating, so the domination EUR over USD due to difference in policy will gradually fade out. EUR starts to loose their positions against USD. As I’ve said a month ago, GBP has much more strong positions and more attractive against USD in long-term perspective.
Monthly
Although we didn’t talk about EUR currency for couple of weeks, there are no much changes on monthly chart. Trend shifting to bullish has confirmed now. For the second month market stays at monthly overbought level that is for November at 1.4057. It means that it’s not a time for establishing new long-term “Long” positions. The next resistance just above the market – 5/8 Fib resistance at 1.4416
#1
Weekly
On this time frame however, there are some important changes. Look at initial price action – market has accelerated from 61.8% expansion directly to 100% expansion and hit weekly overbought (the first circle). Market absolutely disrespected 61.8% target and didn’t even a bounce. Also note, that CD leg is faster than AB. Usually this kind of price action leads to 1.618% Fib expansion target that is at 1.4948, but after meaningful retracement. As a rule the depth of retracement is 5/8 Fib support from the latest swing up. This is at 1.3232-1.3558 area that includes weekly Confluence support, monthly pivot support 2 and previous highs at 1.3333.
And the first bell for starting of this retracement has rung already. Market has tried to move higher there was no overbought and any resistances above the market, but failed and shown wash and rinse of a previous highs. I believe that this is a sign that market is ready to move lower. I don’t confirm that it definitely will reach 1.33-1.35 area, but some move to the downside should happen.
The first level of support is monthly pivot point at 1.3885. If market will move below it, it will mean than bears take control of the market and we can count on deeper retracement, at least till next support level 1.3614-1.3631 – the combination Fib support and monthly pivot support 1.
Next support area is one that we’ve talked about already – 1.3232-1.3558. And the last gasp for the bulls – last 5/8 Fib support at 1.2792.
Also take a note that trend, based on MACDP (red line on the chart) will remain bullish even till 1.3232-1.3558 area. Personally, I think that either 1.3630 or 1.33 area should hold the market. IF not – then the further up move will be under question.
Daily
Before start talking about entry points, supports and resistance, let take a look at recent price action and I show you how you can get very important information if you’re attentive enough to nuances. For the first look on #1 there is not much interesting here. So, here is you home task – try to analyze this chart, before reading my analysis of this fragment, and then compare them. Here is your chart for analyzing, what can you say based on it?
#1
Here is my view. During couple of previous weeks market is forming a butterfly Sell pattern, with a 1.27 target around 1.4280 area. Until the moment of a last move in right wing of butterfly, market has been in the range. Now, market has shown upper breakout of the range, accomplished the butterfly, hit daily overbought and returned back in the range. Simultaneously, as we’ve talked in weekly time frame, market demonstrated a W&R of previous highs. What it can tells us about the targets to the downside? First, of all, as we’ve seen on example of USD/CHF trade – the target of the Butterfly is 1.618 expansion of a whole move to the upside – this is around 1.33 area (you can confirm it by yourself). Second, market has shown upper breakout failure of the range, so it should reach at least lower border of it. Furthermore, if market will break this trading range (lime lines) to the downside, then, according the rule, it should move to the downside at least the width of this range – this is also around 1.33 area.
And the last one. Look at the red line – this is MACD Predictor indicator. You can see, that trend has turned bullish – but price action is bearish. This is an excellent example of negative dynamic pressure that leads continuation of a down move.
#2
Ok, now let’s shift to particular levels. 1.4051 is not more the support level – it was penetrated by the price already. The next area of support – monthly pivot point and daily Confluence support at 1.3885-1.3913. And the next area – monthly pivot support 1, daily confluence support and daily oversold at 1.3614-1.3663. This is the last logical support area for nearest couple of days, because other support levels are beyond of daily oversold, so we will not speak about them currently.
By the way, you can see nice bearish divergence with MACD indicator…
#3
4-Hour
MACD gives perfect “sell” signal, very good angle of piercing lines. Nice thrust to the downside. Weekly pivot is very close to the market. If market will show continuation of a down move right after the opening, then, we can wait for some retracement up to weekly pivot for enter short. If market will open above it – then better wait some retracement to one of the levels that I show on the chart. The problem is that there are no definite swings currently for estimation ABC’s and Agreement areas to definitely speak about suitable areas for entering. But I suppose that 1.4150 is a not bad area, if market will show this retracement up.
Conclusion:
Long-term.
EUR has bullish bias but it overbought at monthly time frame. It’s not the time to establish long-term bullish position. Wait for retracement lower.
Short term
I have bearish view on EUR currency. The weakness on weekly time frame (Wash and Rinse) and failure to continue move to upside after normalizing overbought level makes me think that market is ready to retrace lower. I think that there are 2 possible targets for that – 1.36 or 1.33 areas.
The technical portion of Sive's analysis owes a great deal to Joe DiNapoli's methods, and uses a number of Joe's proprietary indicators. Please note that Sive's analysis is his own view of the market and is not endorsed by Joe DiNapoli or any related companies.
