Sive Morten
Special Consultant to the FPA
- Messages
- 18,664
Fundamentals
Flat FOMC meeting statement on recent week turns all investor’s attention to different macro data that was rather positive during the recent time, especially different sentiment indexes and claims numbers. Although GDP number with 3.2% in IVQ was neither impressive nor disappointing, particularly compares to previous 2.6% and other previous GDP numbers after crisis starting in 2008. The last strongly expected data is NFP of cause, particularly because Fed reiterated, that labor market carried the major risk for upside economy’s momentum. Due to some rumors on the market these number expected to be as high as 140K. If it will really appear around that, then possibly EUR/USD will meet some difficulties to go up further. Besides, technically EUR is also overbought a bit, but we will talk about this with more details in technical part of research.
EUR also carries some non-uniquely defined circumstances. Talking about positive moments, we can mention such as rate differential that still holds, some investor’s calming with sovereign debt panic that has hit Europe in December-January, better economic data in core countries, supportive Trichet comments about inflation and stronger Germany’s data. Also, some short covering in the beginning of current rally was also supportive. But not all things are so unclouded.
Also we should point some things that should put us on guard. First, technically, the recent rallies become weaker, it seems that rally a bit exhausted. But the more important in long-term, that is hardly possible that EU can support the same speed of economy repair for strong core countries and periphery. Besides, there are some concerns on the market with Spanish restructuring or cajas, because merging of the banks not necessary will resolve the problem positively. Banks has started to unveil the property risks. Couple of banks show that they have a solid real estate exposure for about B10-11 EUR each. The possible transparency can reduce uncertainty but at the same time add expensive troubles.
Conclusion: Concerning US – major attention will be attracted to labor market, partially because it was specified as primary object for further economy growth by Fed. If upside trend in claims data and NFP will hold, possibly we even can expect a rate tight in 3-4Q of 2011 from the Fed.
Although EUR still can continue its upside move in near term, existing problems and blurring perspectives can add some barriers to further EUR/USD growth. Currently it seems that EUR/USD will have to struggle to move above 1.375-1.38.
Monthly
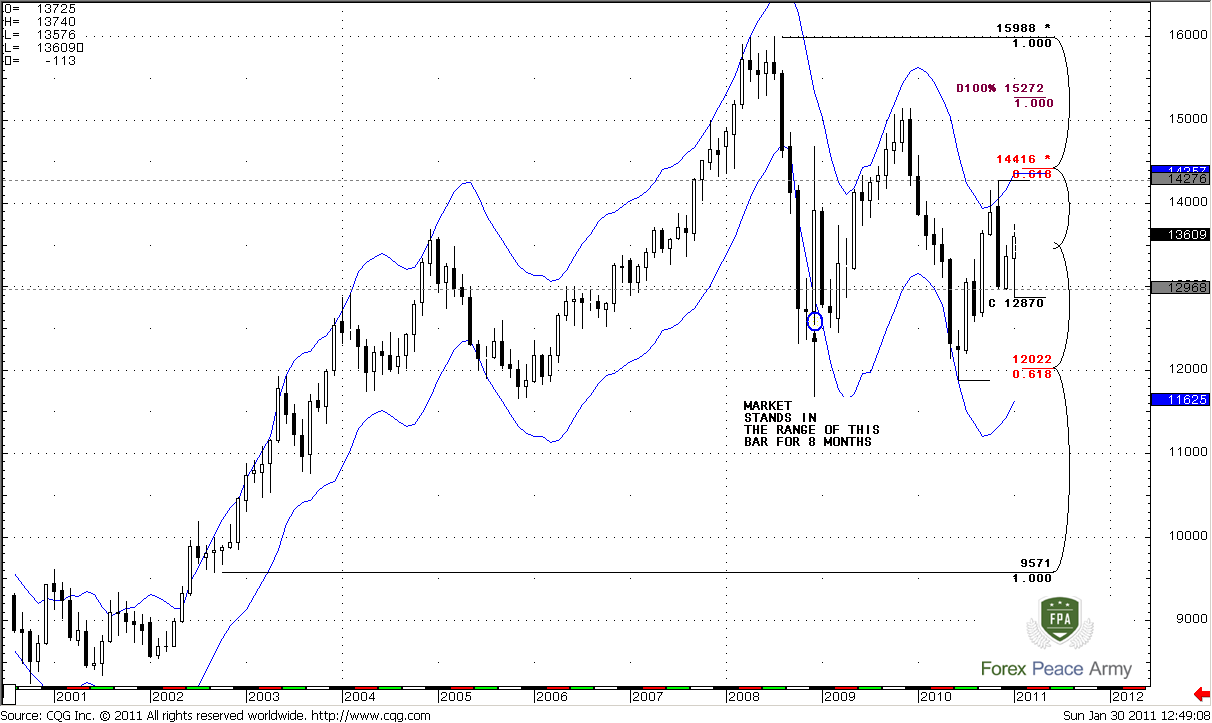
Although Trend holds bullish during three previous months, only in January price has pushed up a bit. At the same time, do you remember this huge bearish engulfing pattern that we’ve discussed previously? So, it has not been triggered yet – market has closed neither higher nor lower than the high and low of this pattern. In fact, market just stuck in the range of this huge black candle for the second month. Now take a look at the bar in blue circle – market has stood it its range for 8 months after collapse in 2008. This is quite common, when after strong move market stands in their range for some time. Currently we see it on monthly time frame.
And speaking definitely in terms of monthly time frame – we can call some event “meaningful” only when market will move beyond the borders that I’ve pointed on the chart. Before that will happen only lower time frames analysis will be more interesting for us. Other words speaking, for the coming week we should concentrate on inside price action of this black candle.
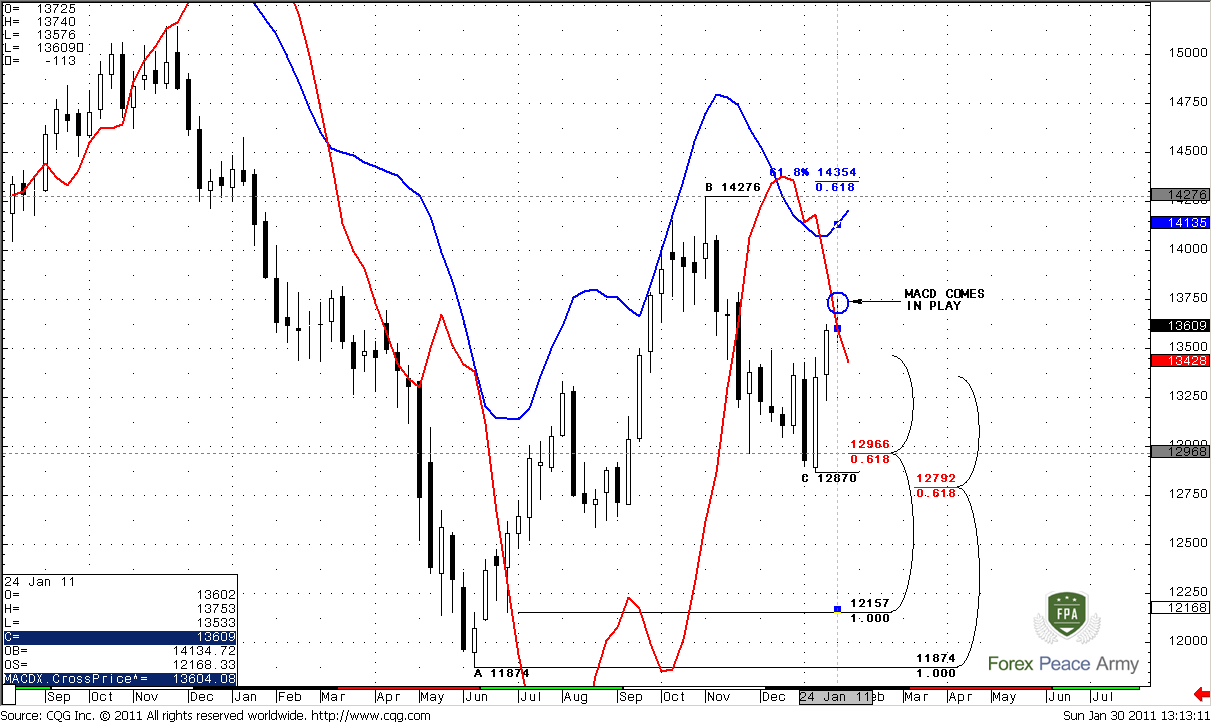
Nevertheless, I’ve marked the nearest upside target, based on monthly chart and the nearest resistance and support levels. 0.618 Fib expansion is at 1.4354 from marked ABC-bottom, that creates an Agreement with 5/8 Fib resistance at 1.4416. Support stands at 1.2022 and it has been tested once already.
Weekly
Situation on weekly chart has not changed much. On previous week we’ve discussed couple of moments. First, ABC target at 1.4354, but it still beyond the weekly overbought and I think that it hardly be actual for coming week. The second thing is much more important. This is potential MACDP failure pattern. Currently we have doji week. Formally, market has closed above red line – i.e. above MACDP (see table on the chart in the corner). It means that trend has turned bullish, but this is for 5 pips. If market on coming weak will close below the red line – this will be MACDP failure pattern. In this case we can count on move at least to 1.29 area. Besides, 1.3730 is 5/8 Fib resistance. So, in fact, this is a single moment that important on weekly time frame.
Daily
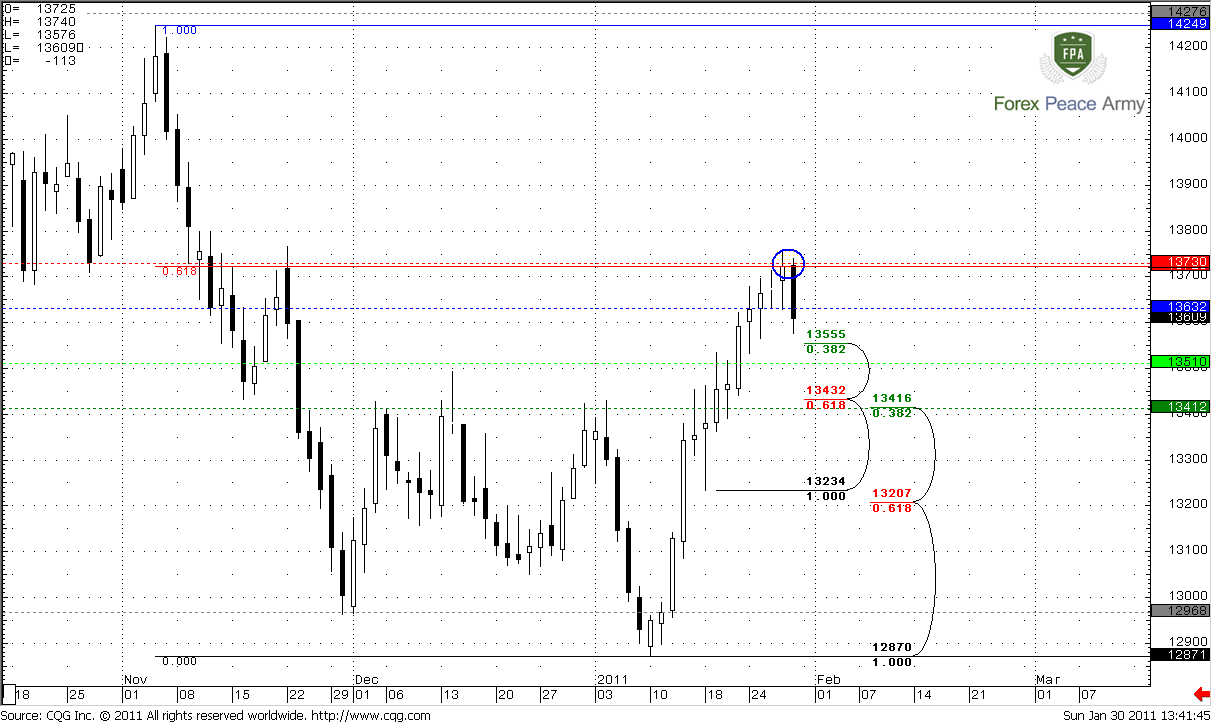
Daily trend is still bullish. We’ve carefully watched for 1.3730-1.3750 area on recent week and looks like it confirms our expectations as solid resistance level. It includes 5/8 Fib resistance and weekly pivot resistance 1. So, we can see nice bounce from it to the downside. Will it be reversal or just a retracement – we don’t know currently (although fundamentally, EUR rally is a bit overbought). So, how we can trade this bounce?
First, after strong thrusts to the upside during reversal the W - shape is more probable than V. It means that after some move down market will definitely will show attempt to continue move up. And we should see these possible support levels for that purpose. Weekly pivot at 1.3632 we should treat as a beacon. If market will fail on Monday around it – then deeper move down is more probable. Next area is 1.3510-1.3555. This is Fib support and weekly pivot support 1. Next area is a strong one – daily Confluence support and weekly pivot support 2 around 1.3416-1.3432, also these are the previous highs of consolidation. Odds suggest market usually respects such areas and this is a good target for potential short position. I think that market will bounce from 1.3510 or this confluence to create a W-shape of reversal (if it will be a reversal at all).
Second, if market will hold above weekly pivot – don’t be short, because in this case market can renew the previous local highs.
#1
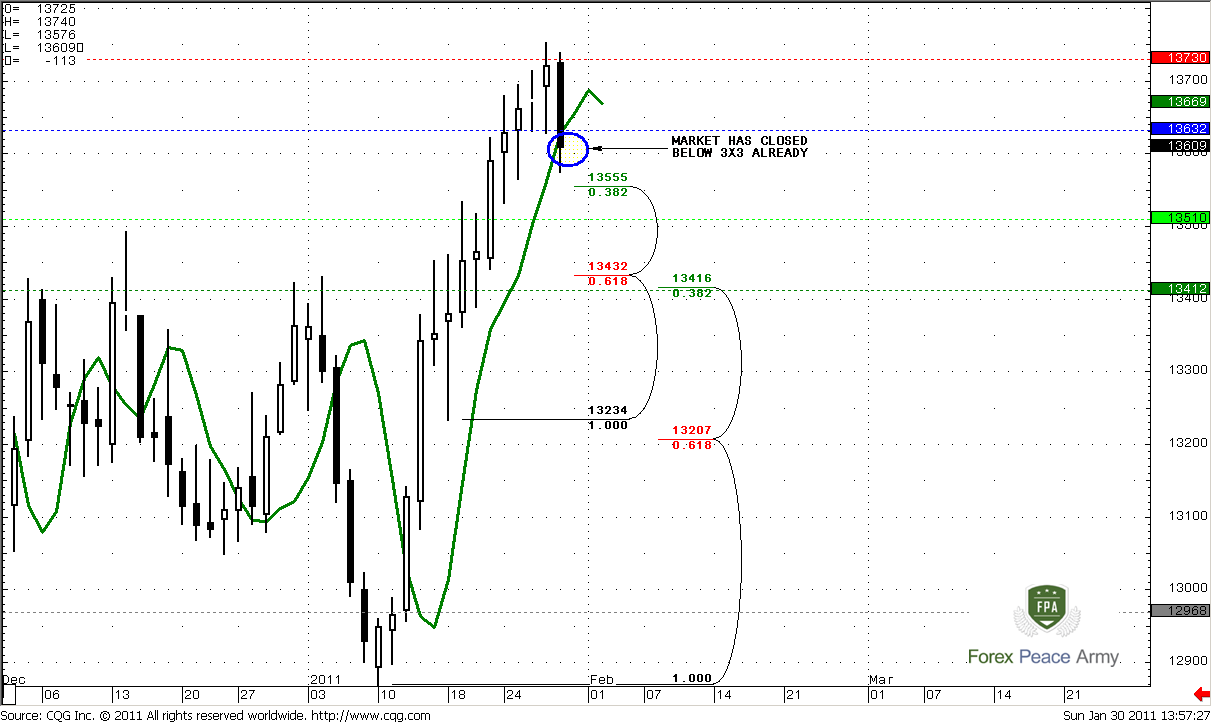
Now let’s take a look at this chart from another point of view. What do we see here? Right – excellent thrust up, good separation from 3x3. Market already has closed below 3x3 once. This is a context for B&B “Buy” or potential DRPO “Sell” pattern, depending from the depth of penetration 3x3. In DRPO case we want to see shallow penetration, market should not reach any meaningful Fib support level. If market will reach 1.35 area or even 1.3430 – this will be context for daily B&B.
#2
1-Hour
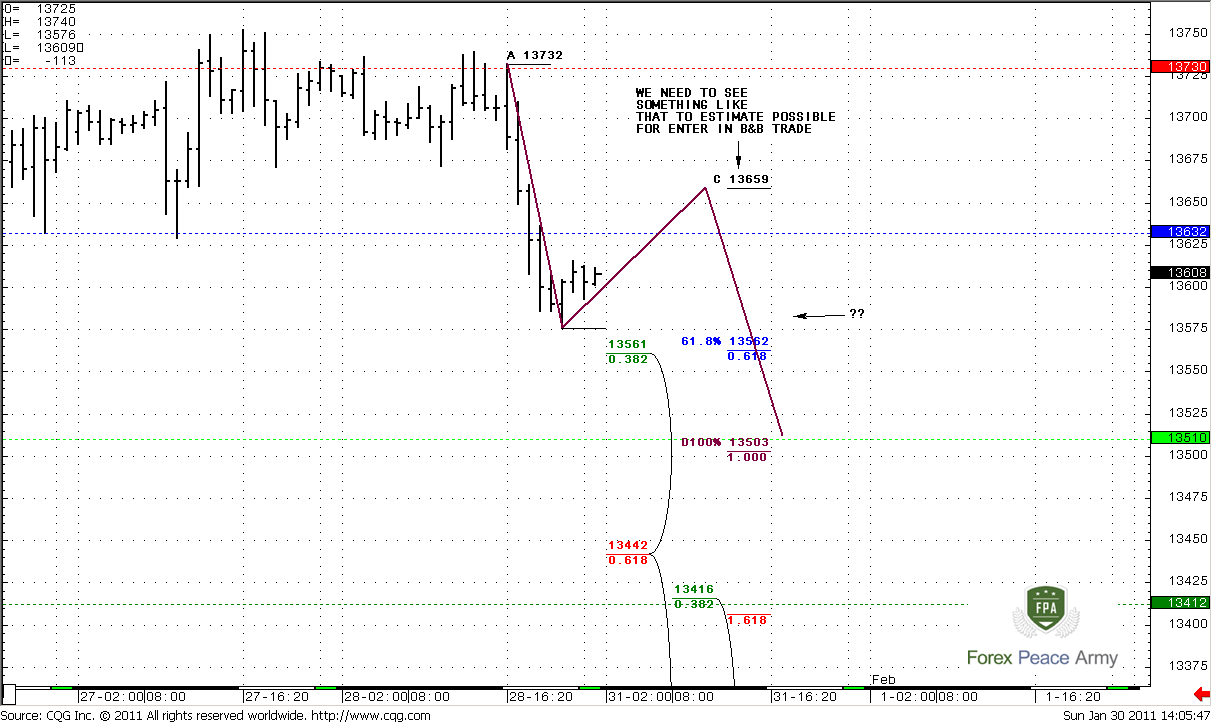
On hourly chart we need to see something like I draw – some ABC pattern that will allow us estimate possible target for entering in B&B trade. Currently we see just initial move down – that’s all. If market on Monday will move above blue line and hold there – hold your horses, and do not enter on short side for scalping. In fact, in this case market can continue move up or turn to forming DRPO “Sell” pattern.
Conclusion:
Fundamentally, EUR/USD looks heavy for further move up; although I can’t exclude that this is possible. 1.37-1.38 levels seems reasonable, and possibly here market can reestablish down trend.
On daily time frame market gives us a nice possibility for high probability trades – B&B or DRPO. If market will fail at weekly pivot on Monday and continue move down – estimate possible ABC’s and level where to buy in. In this case this will be B&B scalp buy.
If, market will move above pivot – don’t be short. Possibly market will form DRPO “Sell” or just continue move up. That is also possible.
The technical portion of Sive's analysis owes a great deal to Joe DiNapoli's methods, and uses a number of Joe's proprietary indicators. Please note that Sive's analysis is his own view of the market and is not endorsed by Joe DiNapoli or any related companies.
Flat FOMC meeting statement on recent week turns all investor’s attention to different macro data that was rather positive during the recent time, especially different sentiment indexes and claims numbers. Although GDP number with 3.2% in IVQ was neither impressive nor disappointing, particularly compares to previous 2.6% and other previous GDP numbers after crisis starting in 2008. The last strongly expected data is NFP of cause, particularly because Fed reiterated, that labor market carried the major risk for upside economy’s momentum. Due to some rumors on the market these number expected to be as high as 140K. If it will really appear around that, then possibly EUR/USD will meet some difficulties to go up further. Besides, technically EUR is also overbought a bit, but we will talk about this with more details in technical part of research.
EUR also carries some non-uniquely defined circumstances. Talking about positive moments, we can mention such as rate differential that still holds, some investor’s calming with sovereign debt panic that has hit Europe in December-January, better economic data in core countries, supportive Trichet comments about inflation and stronger Germany’s data. Also, some short covering in the beginning of current rally was also supportive. But not all things are so unclouded.
Also we should point some things that should put us on guard. First, technically, the recent rallies become weaker, it seems that rally a bit exhausted. But the more important in long-term, that is hardly possible that EU can support the same speed of economy repair for strong core countries and periphery. Besides, there are some concerns on the market with Spanish restructuring or cajas, because merging of the banks not necessary will resolve the problem positively. Banks has started to unveil the property risks. Couple of banks show that they have a solid real estate exposure for about B10-11 EUR each. The possible transparency can reduce uncertainty but at the same time add expensive troubles.
Conclusion: Concerning US – major attention will be attracted to labor market, partially because it was specified as primary object for further economy growth by Fed. If upside trend in claims data and NFP will hold, possibly we even can expect a rate tight in 3-4Q of 2011 from the Fed.
Although EUR still can continue its upside move in near term, existing problems and blurring perspectives can add some barriers to further EUR/USD growth. Currently it seems that EUR/USD will have to struggle to move above 1.375-1.38.
Monthly
Although Trend holds bullish during three previous months, only in January price has pushed up a bit. At the same time, do you remember this huge bearish engulfing pattern that we’ve discussed previously? So, it has not been triggered yet – market has closed neither higher nor lower than the high and low of this pattern. In fact, market just stuck in the range of this huge black candle for the second month. Now take a look at the bar in blue circle – market has stood it its range for 8 months after collapse in 2008. This is quite common, when after strong move market stands in their range for some time. Currently we see it on monthly time frame.
And speaking definitely in terms of monthly time frame – we can call some event “meaningful” only when market will move beyond the borders that I’ve pointed on the chart. Before that will happen only lower time frames analysis will be more interesting for us. Other words speaking, for the coming week we should concentrate on inside price action of this black candle.
Nevertheless, I’ve marked the nearest upside target, based on monthly chart and the nearest resistance and support levels. 0.618 Fib expansion is at 1.4354 from marked ABC-bottom, that creates an Agreement with 5/8 Fib resistance at 1.4416. Support stands at 1.2022 and it has been tested once already.

Weekly
Situation on weekly chart has not changed much. On previous week we’ve discussed couple of moments. First, ABC target at 1.4354, but it still beyond the weekly overbought and I think that it hardly be actual for coming week. The second thing is much more important. This is potential MACDP failure pattern. Currently we have doji week. Formally, market has closed above red line – i.e. above MACDP (see table on the chart in the corner). It means that trend has turned bullish, but this is for 5 pips. If market on coming weak will close below the red line – this will be MACDP failure pattern. In this case we can count on move at least to 1.29 area. Besides, 1.3730 is 5/8 Fib resistance. So, in fact, this is a single moment that important on weekly time frame.

Daily
Daily trend is still bullish. We’ve carefully watched for 1.3730-1.3750 area on recent week and looks like it confirms our expectations as solid resistance level. It includes 5/8 Fib resistance and weekly pivot resistance 1. So, we can see nice bounce from it to the downside. Will it be reversal or just a retracement – we don’t know currently (although fundamentally, EUR rally is a bit overbought). So, how we can trade this bounce?
First, after strong thrusts to the upside during reversal the W - shape is more probable than V. It means that after some move down market will definitely will show attempt to continue move up. And we should see these possible support levels for that purpose. Weekly pivot at 1.3632 we should treat as a beacon. If market will fail on Monday around it – then deeper move down is more probable. Next area is 1.3510-1.3555. This is Fib support and weekly pivot support 1. Next area is a strong one – daily Confluence support and weekly pivot support 2 around 1.3416-1.3432, also these are the previous highs of consolidation. Odds suggest market usually respects such areas and this is a good target for potential short position. I think that market will bounce from 1.3510 or this confluence to create a W-shape of reversal (if it will be a reversal at all).
Second, if market will hold above weekly pivot – don’t be short, because in this case market can renew the previous local highs.
#1

Now let’s take a look at this chart from another point of view. What do we see here? Right – excellent thrust up, good separation from 3x3. Market already has closed below 3x3 once. This is a context for B&B “Buy” or potential DRPO “Sell” pattern, depending from the depth of penetration 3x3. In DRPO case we want to see shallow penetration, market should not reach any meaningful Fib support level. If market will reach 1.35 area or even 1.3430 – this will be context for daily B&B.
#2

1-Hour
On hourly chart we need to see something like I draw – some ABC pattern that will allow us estimate possible target for entering in B&B trade. Currently we see just initial move down – that’s all. If market on Monday will move above blue line and hold there – hold your horses, and do not enter on short side for scalping. In fact, in this case market can continue move up or turn to forming DRPO “Sell” pattern.

Conclusion:
Fundamentally, EUR/USD looks heavy for further move up; although I can’t exclude that this is possible. 1.37-1.38 levels seems reasonable, and possibly here market can reestablish down trend.
On daily time frame market gives us a nice possibility for high probability trades – B&B or DRPO. If market will fail at weekly pivot on Monday and continue move down – estimate possible ABC’s and level where to buy in. In this case this will be B&B scalp buy.
If, market will move above pivot – don’t be short. Possibly market will form DRPO “Sell” or just continue move up. That is also possible.
The technical portion of Sive's analysis owes a great deal to Joe DiNapoli's methods, and uses a number of Joe's proprietary indicators. Please note that Sive's analysis is his own view of the market and is not endorsed by Joe DiNapoli or any related companies.
