Sive Morten
Special Consultant to the FPA
- Messages
- 18,621
I've decided to start current research with fast look at fundamental factors, because now they look significant, and because there are a lot of important event will come on next week. And we will start from Arab region turmoil. Situation on Middle East continue to be difficult and it’s far from final unravel. Although market has got a temporal relief from Saudi officials, that have given some assurance to compensate drawdown in Libyan production of oil. But the most interesting fact, that all these negative events and fast, strong escalation of conflicts had led to just moderately bullish reaction on US Treasuries rates, and bearish on USD. In fact, Buck outperformed just AUD, GBP and NZD, taking in account the fact of NZ Earthquake. So, these moments suggest that some strong forces are driving the market currently. Meantime, speaking purely about macro indicators, I think that the focus as Fed as ECB gradually shifts from unemployment to inflation and, hence to interest rates. The recent rhetoric of ECB officials and Fed representatives has confirmed that.
ECB speeches were EUR supportive on past week. Bundesbank President Weber noted that interest rates have nowhere to go but up. But US Fed authorities were not so peremptory. The St. Louis Fed President Bullard said that while Fed could slow down and reduce Treasuries purchases, the possibility of QE 3 cannot be ruled out. At the same time, Plosser noted that Fed may need to change policy even before unemployment will show demandable falling – this is a clear statement that further QE is under question. As usual, such kind of disagreement presses on USD.
At the same time, as we’ve already noted in previous researches, the EUR perspectives are not so cloudless, it rather a bit blurring. And the major risk here is misbalances in economy growth or EU Core and periphery countries. This distortion becomes even more important because is sustained by inability of policy makers to agree on a cohesive strategy to stabilize the EU area which speaks to the greater issues of political and social dissonance. You may argue that currently EUR moves in a row with Germany economy that is impressive in recent time. Well, probably it will continue to do so, until one of the events that we’ve just discussed (some strong economy problems in one of the periphery countries) will not manifest itself with all the power. And this will happen – sooner or later. EU becomes wider and wider but preparation of new members and requirements to them from elder members become lighter. One day this discrepancy and misleading will hit the EU. So, that’s why our view on EUR is moderately bearish. And we can see the first signs of it even on the next week:
So, as you can see the coming week will be tough.
Conclusion: There are an early signs that as ECB as Fed shift their priorities to inflation rather than to employment and we become closer to rising of interest rates. Although EUR performs well in recent months, I think that some “Phantom menace” exists in EU economy – perspectives of periphery countries. That’s why I’m not so sure in bullish EUR perspectives.
Monthly
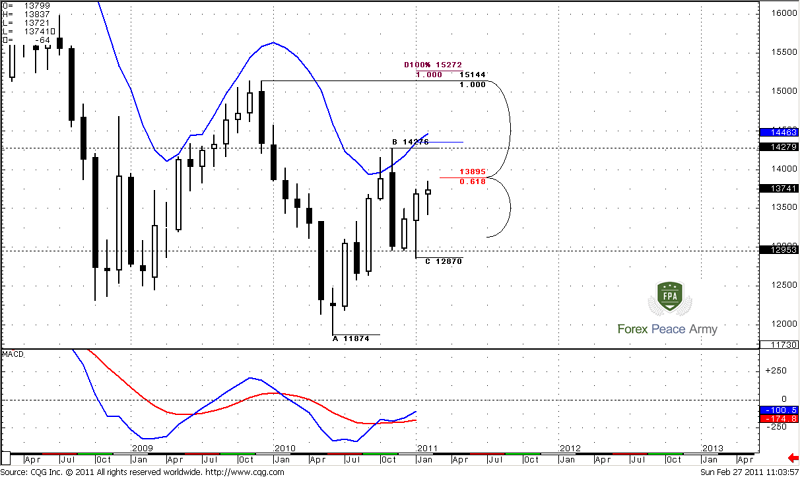
Although we didn’t talk about EUR whole previous week, monthly time frame is not very interesting still. Trend is bullish, but market still holds in a range of strong black bar. Market neither oversold nor overbought currently; there are no support or resistance levels that could influence on price action during the coming week. Although we can see 5/8 Fib resistance at 1.3895 – just above the market, it has been hardly penetrated once already, so it will be rather weak during the second touch.
Since trend is bullish – next monthly target stands at 1.4356 – just above the previous highs and very close to monthly overbought at 1.4450 area.
It turns out that lower time frames are more important for us on coming week.
Weekly
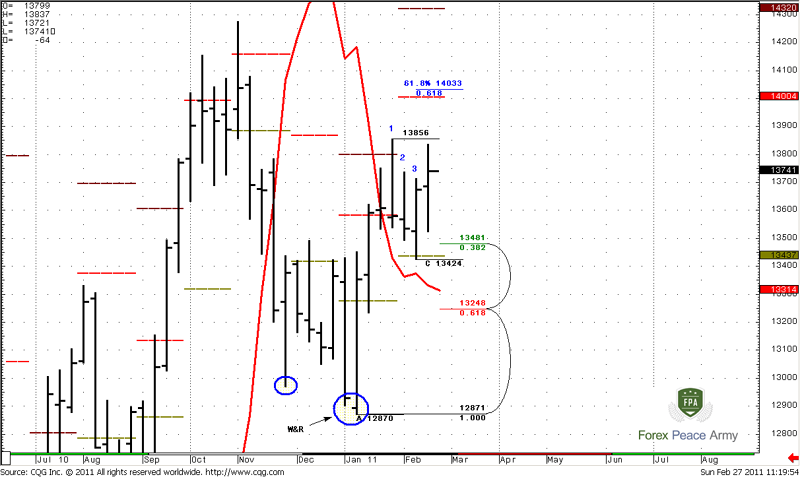
There are some interesting moments here. First of all trend is bullish. If you remember, we’ve tracked the building of bearish dynamic pressure (DP) in previous EUR research that could lead to acceleration to the downside. Now, look at the chart – I’ve marked bars of DP with numbers. See, trend was bullish, but price formed low highs, and closes near the low of the week. But this pattern has been broken by recent price action – market has supported MACD by price action. This is bullish sign.
Second, market stands above monthly pivot at 1.3437 – bullish.
Third – last retracement down was just 3/8 – bullish.
Forth – current move up has started from Wash&Rinse directional pattern that looks like Rail Road Tracks pattern (but it’s not RRT). This is also bullish pattern – it confirmed support at 5/8 Fib level during retracement.
So, on weekly time frame we have no context to enter short – monthly trend is bullish, weekly trend is bullish, market also shows some other bullish signs. Let’s take a look at possible targets. The nearest target is 0.618 Fib expansion at 1.4033 that is also a monthly pivot resistance 1.
#1
Daily
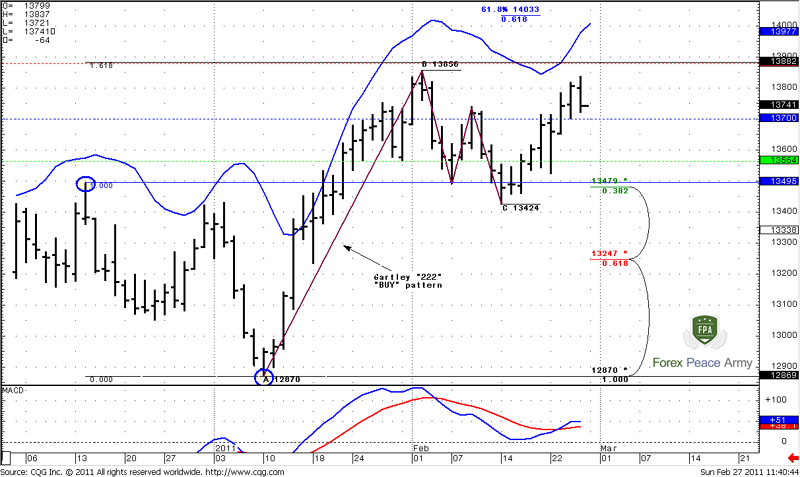
Daily trend is also bullish. Here we clearly see Gartley “222” Buy pattern. Retracement was very shallow – just to 3/8 Fib support. The nearest target of this pattern is 1.4033 that is also daily Overbought. But even earlier market will meet 1.618 target of Butterfly “Buy” and weekly pivot resistance 1 at 1.3878 (red dash line). I think that we should be aware of possible Wash and Rinse of previous highs. It seems that our primary swing for trading will be the recent swing up and couple of targets above the market.
Also here you can see weekly pivot at 1.37 and weekly pivot support 1 at 1.3564
#1
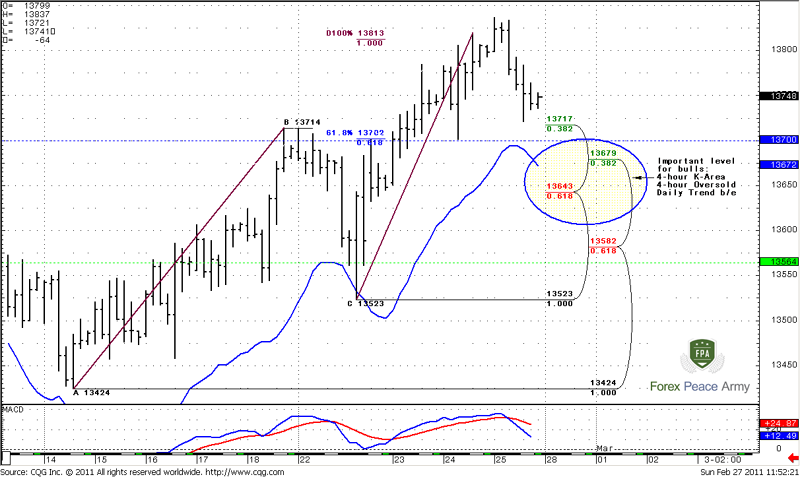
Now let’s shift at most recent price action at daily time frame. Here we have excellent Butterfly “Sell” pattern. It’s 1.27 target coincides with daily overbought and near target of AB-CD pattern. Also 1.30 is monthly pivot resistance 2 and upper border of the wedge. Also around 1.25-1.30 stand some weekly targets. It means that we should look for opportunity to enter on the Long side of the market. And I think that recent swing, from C-point could be used for that purpose, so let’s shift to 4-hour time frame.
Intraday
Intraday price action gives us absolutely clear context for trading. Market has accomplished AB-CD pattern and turned to retracement. You can see that CD leg is a bit faster than AB – this is a bullish sign.
Trend is bearish. There are two areas that are suitable for enter on the long side – 1.3700-1.3720, that includes Pivot point, Fib support and previous highs at 1.3714. Second area is my preferable one, I intend to enter from there – 1.3643-1.3680 and here is why:
- 4-hour Confluence support;
- 4-hour Oversold;
- Daily trend remains bullish till 1.3650, so I will have no context to enter Long, if market will break it.
- it allows to place tight stop - just below it.
- it allows to move stop to b/e, because market has a great probability to bounce from it after the first touch. So, even if I will become wrong, I have chances to exit without loss.
4-Hour
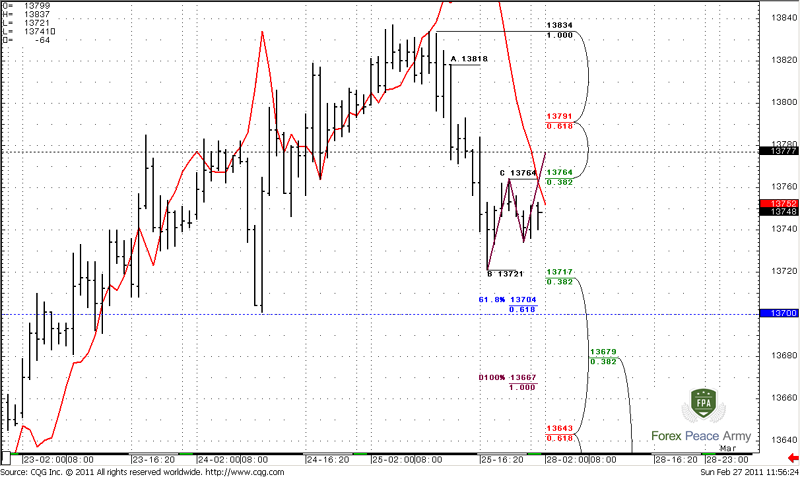
Hourly chart gives me even more confidence with this area, because it shows Agreement with AB-CD hourly pattern.
Even you very short-term trader and use hourly trend as a context, then, you possibly can try to short this market from current retracement with target around 1.3650.
1-Hour
Conclusion:
Day traders:
We have no context for enter short, because we have no bearish directional signals and all trends are bullish. Personally, I will follow the plan:
The technical portion of Sive's analysis owes a great deal to Joe DiNapoli's methods, and uses a number of Joe's proprietary indicators. Please note that Sive's analysis is his own view of the market and is not endorsed by Joe DiNapoli or any related companies.
ECB speeches were EUR supportive on past week. Bundesbank President Weber noted that interest rates have nowhere to go but up. But US Fed authorities were not so peremptory. The St. Louis Fed President Bullard said that while Fed could slow down and reduce Treasuries purchases, the possibility of QE 3 cannot be ruled out. At the same time, Plosser noted that Fed may need to change policy even before unemployment will show demandable falling – this is a clear statement that further QE is under question. As usual, such kind of disagreement presses on USD.
At the same time, as we’ve already noted in previous researches, the EUR perspectives are not so cloudless, it rather a bit blurring. And the major risk here is misbalances in economy growth or EU Core and periphery countries. This distortion becomes even more important because is sustained by inability of policy makers to agree on a cohesive strategy to stabilize the EU area which speaks to the greater issues of political and social dissonance. You may argue that currently EUR moves in a row with Germany economy that is impressive in recent time. Well, probably it will continue to do so, until one of the events that we’ve just discussed (some strong economy problems in one of the periphery countries) will not manifest itself with all the power. And this will happen – sooner or later. EU becomes wider and wider but preparation of new members and requirements to them from elder members become lighter. One day this discrepancy and misleading will hit the EU. So, that’s why our view on EUR is moderately bearish. And we can see the first signs of it even on the next week:
- On Monday (28 February) – Greece third visitation by IMF. Although there are no expectation concerning Greece review, IMF visit is worthy to monitor;
- 2d of March – ECB will announce new bank’s stress test methodology;
- 3d of March – ECB meeting. AS we’ve mentioned above, market now expects hawkish commentary from ECB. IF they will miss expectations, this could lead to bearish move on EUR;
- 3d March -Bernanke testimony and 4th of March – NFP release.
So, as you can see the coming week will be tough.
Conclusion: There are an early signs that as ECB as Fed shift their priorities to inflation rather than to employment and we become closer to rising of interest rates. Although EUR performs well in recent months, I think that some “Phantom menace” exists in EU economy – perspectives of periphery countries. That’s why I’m not so sure in bullish EUR perspectives.
Monthly
Although we didn’t talk about EUR whole previous week, monthly time frame is not very interesting still. Trend is bullish, but market still holds in a range of strong black bar. Market neither oversold nor overbought currently; there are no support or resistance levels that could influence on price action during the coming week. Although we can see 5/8 Fib resistance at 1.3895 – just above the market, it has been hardly penetrated once already, so it will be rather weak during the second touch.
Since trend is bullish – next monthly target stands at 1.4356 – just above the previous highs and very close to monthly overbought at 1.4450 area.
It turns out that lower time frames are more important for us on coming week.
Weekly
There are some interesting moments here. First of all trend is bullish. If you remember, we’ve tracked the building of bearish dynamic pressure (DP) in previous EUR research that could lead to acceleration to the downside. Now, look at the chart – I’ve marked bars of DP with numbers. See, trend was bullish, but price formed low highs, and closes near the low of the week. But this pattern has been broken by recent price action – market has supported MACD by price action. This is bullish sign.
Second, market stands above monthly pivot at 1.3437 – bullish.
Third – last retracement down was just 3/8 – bullish.
Forth – current move up has started from Wash&Rinse directional pattern that looks like Rail Road Tracks pattern (but it’s not RRT). This is also bullish pattern – it confirmed support at 5/8 Fib level during retracement.
So, on weekly time frame we have no context to enter short – monthly trend is bullish, weekly trend is bullish, market also shows some other bullish signs. Let’s take a look at possible targets. The nearest target is 0.618 Fib expansion at 1.4033 that is also a monthly pivot resistance 1.
#1
Daily
Daily trend is also bullish. Here we clearly see Gartley “222” Buy pattern. Retracement was very shallow – just to 3/8 Fib support. The nearest target of this pattern is 1.4033 that is also daily Overbought. But even earlier market will meet 1.618 target of Butterfly “Buy” and weekly pivot resistance 1 at 1.3878 (red dash line). I think that we should be aware of possible Wash and Rinse of previous highs. It seems that our primary swing for trading will be the recent swing up and couple of targets above the market.
Also here you can see weekly pivot at 1.37 and weekly pivot support 1 at 1.3564
#1
Now let’s shift at most recent price action at daily time frame. Here we have excellent Butterfly “Sell” pattern. It’s 1.27 target coincides with daily overbought and near target of AB-CD pattern. Also 1.30 is monthly pivot resistance 2 and upper border of the wedge. Also around 1.25-1.30 stand some weekly targets. It means that we should look for opportunity to enter on the Long side of the market. And I think that recent swing, from C-point could be used for that purpose, so let’s shift to 4-hour time frame.
Intraday
Intraday price action gives us absolutely clear context for trading. Market has accomplished AB-CD pattern and turned to retracement. You can see that CD leg is a bit faster than AB – this is a bullish sign.
Trend is bearish. There are two areas that are suitable for enter on the long side – 1.3700-1.3720, that includes Pivot point, Fib support and previous highs at 1.3714. Second area is my preferable one, I intend to enter from there – 1.3643-1.3680 and here is why:
- 4-hour Confluence support;
- 4-hour Oversold;
- Daily trend remains bullish till 1.3650, so I will have no context to enter Long, if market will break it.
- it allows to place tight stop - just below it.
- it allows to move stop to b/e, because market has a great probability to bounce from it after the first touch. So, even if I will become wrong, I have chances to exit without loss.
4-Hour
Hourly chart gives me even more confidence with this area, because it shows Agreement with AB-CD hourly pattern.
Even you very short-term trader and use hourly trend as a context, then, you possibly can try to short this market from current retracement with target around 1.3650.
1-Hour
Conclusion:
Day traders:
We have no context for enter short, because we have no bearish directional signals and all trends are bullish. Personally, I will follow the plan:
- Buy at 1.3640-1.3670 area (from the target of hourly AB-CD pattern).
- Initial stop below 1.3580. If market will show bounce up – move stop to b/e.
- Target - 1.3880-1.39. Be aware of W&R of previous highs.
- Wait for retracement on hourly chart – it could be AB-CD, or enter right from current resistance at 1.3764
- Stop above 1.38
- Target 1.3650 area – calculate AB-CD as I did after retracement to estimate target definitely
- When market move below low at 1.3720 – shift s/l to b/e.
The technical portion of Sive's analysis owes a great deal to Joe DiNapoli's methods, and uses a number of Joe's proprietary indicators. Please note that Sive's analysis is his own view of the market and is not endorsed by Joe DiNapoli or any related companies.
")