EUR/USD Daily Video, March 18, 2011

Sive Morten

Special Consultant to the FPA
Messages
18,621
Good morning,
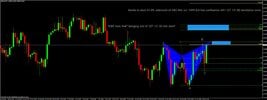
Looks like our yesterday's trading plan has done well.
So, if you have long positions - the nearest target is 1.41. If not, and you want to get some - here is a possiblity for you, but only if you're scalper and like to trade on Friday...


The technical portion of Sive's analysis owes a great deal to Joe DiNapoli's methods, and uses a number of Joe's proprietary indicators. Please note that Sive's analysis is his own view of the market and is not endorsed by Joe DiNapoli or any related companies.
 
Last edited by a moderator:
short eurusd stop

Hello Sive, I intend to open a short position at around 1.40900-1.41060, but it is not clear for me what SL I should use in this case? Thank you: Peter
 
Hello Sive, I intend to open a short position at around 1.40900-1.41060, but it is not clear for me what SL I should use in this case? Thank you: Peter

Hi Peter,
Because you want to enter from this area blindly - just because this is a resistance. This is not best way to do that. Precisely due to that you do not see a level for placing stop.
The better way is to drop time frame to hourly for instance and wait for Sell signals. If you'll see, for example, H&S, then you will easily find the proper area for stop order. Other words - when market will show you that it indend to move lower, it will allow you to find and area for placing stop.
Just be patient...
 
Hi Sive,

GBPUSD chart as discussed yesterday.

Thanks in advance for taking the time to review this.

Cheers

Dave.
 

Attachments

  • gbpusd 1.jpg
    gbpusd 1.jpg
    87 KB · Views: 103
I really appreciate your read of the fx market. Great job you're doing here. Praises and thanks go to FPA as well in providing us your very useful service.
 
Hi Sive,

GBPUSD chart as discussed yesterday.

Thanks in advance for taking the time to review this.

Cheers

Dave.

Dave,
Butterfly is OK. The target will be 1.27 expansion (or 1.618) from the whole swing down from the top of left wing to your A point.

Thing that you've called as W&R.... I'm not sure that this is correct. Usually W&R happens at solid and important levels.

Also, if you let me to add. Take a look at weekly time frame - market just accomplished AB-CD "Sell" pattern and has formed Bearish engulfing. So, your butterfly could be just a retracement in weekly bearish picture. From probability point of view - is better to take 1.272 target. Anyway be careful with that.
 
usd/chf

hi guys,if I read well we got a 3drive pattern on usd/chf weekly chart..first it hit 127 and had a nice correction to 61.8...now it's couple of pips under 161.8...if it's going to work the target around 0.94..please check it...
 
Dave,
Butterfly is OK. The target will be 1.27 expansion (or 1.618) from the whole swing down from the top of left wing to your A point.

Thing that you've called as W&R.... I'm not sure that this is correct. Usually W&R happens at solid and important levels.

Also, if you let me to add. Take a look at weekly time frame - market just accomplished AB-CD "Sell" pattern and has formed Bearish engulfing. So, your butterfly could be just a retracement in weekly bearish picture. From probability point of view - is better to take 1.272 target. Anyway be careful with that.

Hi Sive,

Thanks for taking the time to reply.

The W&R I checked by placing a horizontal line at that level and looking at a weekly chart there is reaction to that level back to April 2009.

I have been watching GBPUSD for a lower TF bearish pattern due to the weekly bearish engulfer. Price action has also retraced 61.8 of bearish engulfer and is now back down near 50% retracement.

Seemed like a logical setup however maybe because it is logical this is why it is more dangerous :)

Anyway enjoy your weekend.

Cheers

Dave.
 
Back
Top