Sive Morten
Special Consultant to the FPA
- Messages
- 18,648
Monthly
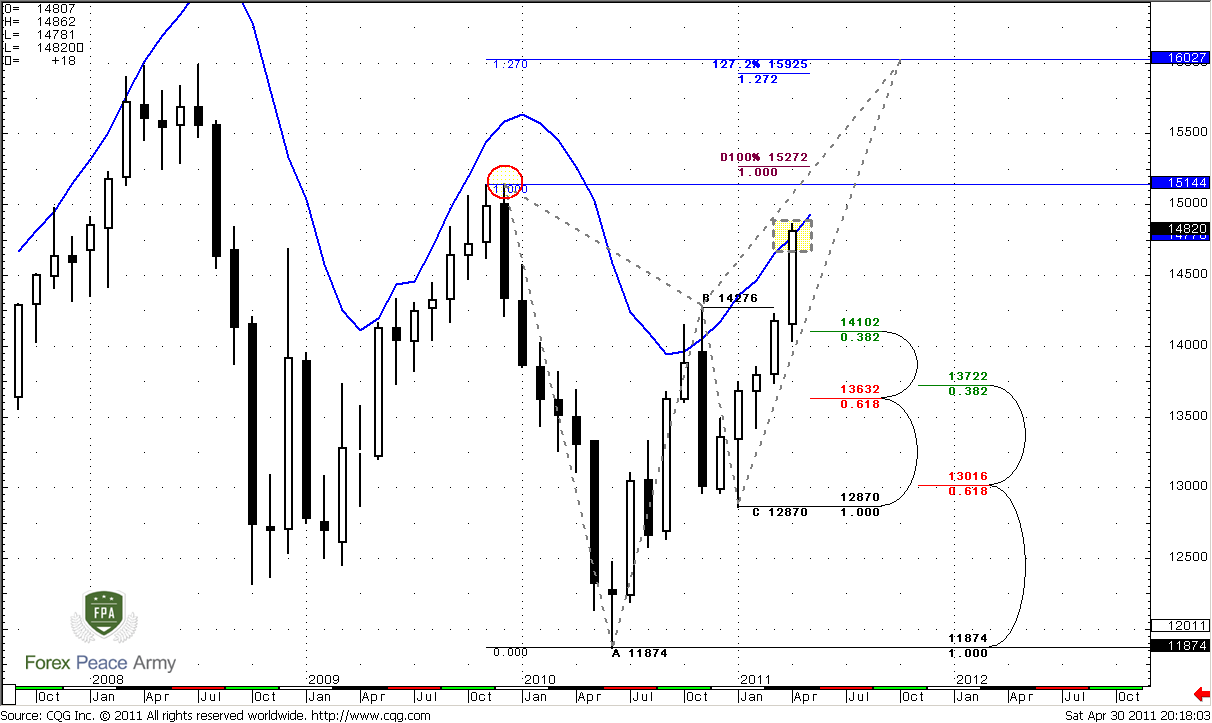
Now we start with new months, so today we have some additional details - overbought area for May stands at 1.4933. Also market has erased all Fib resistances from the recent swing down. Now the major importance for us is high at 1.5144 (red circle). If market will take out this level – then large down AB-CD pattern will be cancelled, since 1.5144 is a “C” point and market will get a free space to continue move to upside. But this is a bit long-term perspective and just a way of development of situation among some others. Nearest target stands at 1.5272, but in perspective it could turn to butterfly “Sell” pattern. The target of this pattern is 1.27 extension at 1.6027. Also it almost coincides with 1.27 target of recent bullish AB-CD. In fact, this view is a bullish one, and now this is a dominating view.
So, that’s about the targets and overall bias on the market. But in near term situation is a bit different. If you’re positional trader (you trade on long-term charts – weekly, monthly) – this is not the time to establish bullish position, because market stands at overbought condition. You need some pullback to enter the market. Also you can’t enter short, because there is no context for that. It’s hard to expect retracement now even to nearest Fib support, because market is not at any Fib resistance, or say, at some important Fib extension target. Still I’ve marked monthly Fib levels here. It means, that possibly market will turn to some consolidation or small range month, mostly sideways.
Weekly
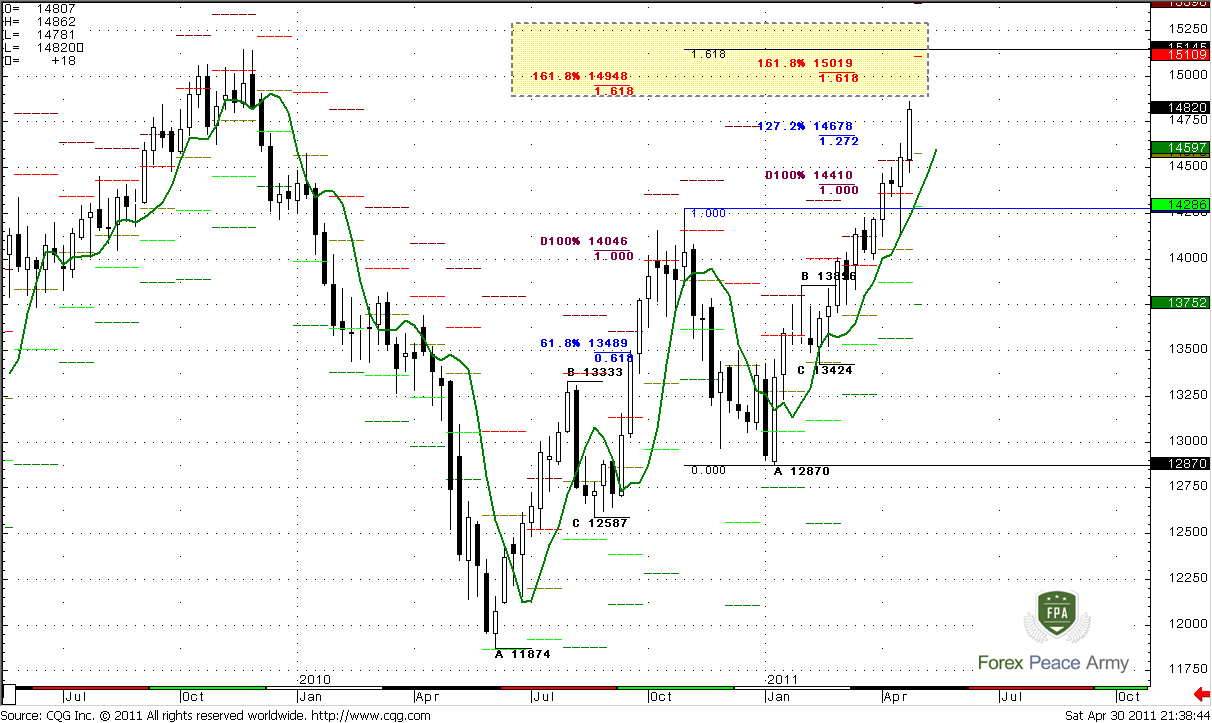
Let’s continue to look at market from the position traders’ view. Trend is obviously bullish, and on weekly time frame, by the way, market is neither oversold nor overbought. The nearest target is 1.50-1.5150, and this is compound target – it includes 1.618 target from the initial AB-CD pattern at 1.4948, 1.618 target from most recent AB-CD at 1.5019 and 1.618 extension of previous retracement at 1.5145. During the previous research we’ve treated it as butterfly sell…
But this is not the end. May pivot points have coincided with 1.51 target area – monthly pivot resistance 1 stands at 1.5109 and previous highs at 1.4270 – pivot support 1 stands at 1.4286. May pivot itself stands at 1.4575.
So, it seems that very probable scenario is a reaching of 1.5144 highs, their wash & Rinse and then retracement lower at least till pivot point. From the probability point of view this is harder and harder to move higher for market due monthly overbought and when it will reach important target – it could turn to retracement.
Also, as you can see weekly chart gives us perfect thrust up – no deep retracements, participants still hold their positions, they have not fixed profits yet. So, it could turn to very sweet weekly Bread & Butter “Buy” pattern or may be even to DRPO ”Sell”- we’ll see, but this is very interesting situation, where we can forecast market’s direction with solid probability, since this pattern will start. Of cause this is not the question of 1-2 weeks, probably we will not see this scenario prior the summer, but still we should track it.
Daily
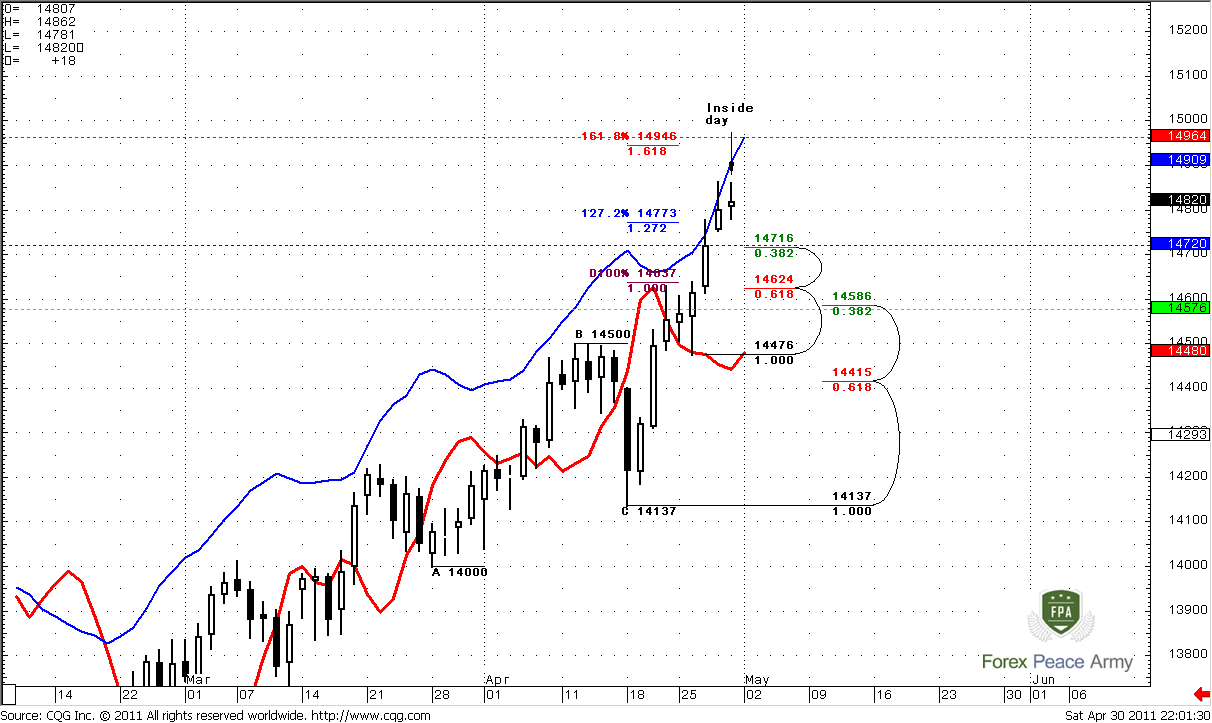
So as we have relatively strict trading plan for longer time frames – this is not a peace a cake to do this in shorter term charts. Furthermore, it is very hard to estimate upside target, because they follow one by one with 50 pips step – nearest is 1.4946 (that is also an overbought), then 1.50 and then weekly targets start – 1.5120 and 1.5145. But, so as this is daily analysis – let’s move day by day, and the nearest target is 1.4950.
Also take a look that 1.4964 is a weekly pivot resistance 1. I suppose that there are no many chances that market will pass this area on Monday. Pivot point stands right at nearest Fib support - 1.4716-1.4720, weekly pivot support coincides with monthly pivot and daily confluence support – 1.4586-1.4624. This area should hold if bulls area still in charge. But, very probable that market will creep somehow to 1.5150-1.52 before any significant retracement, but this suspicion does not cancel the possibility of retracement till pivot point each week. So, 14716 is an area to watch for. And something should happen – see, Friday’s day was inside day. Market either jump to 1.4950 or retrace lower.
Intraday
4-hour chart #1 tells us that trend turns bearish. Around 1.4710-1.4721 stand Fib support, pivot point and 4-hour oversold. First, market should hold above it, if it has plans to reach 1.4950. But, even if it will break it, it hardly will happen during initial touch. Hence, you may use this touch for entering Long. When market will show first pullback – move your stop to breakeven. Also follow a common sense – if market falls like a stone – do not enter long. If market will hold below pivot – then, retracement could be deeper.
#1
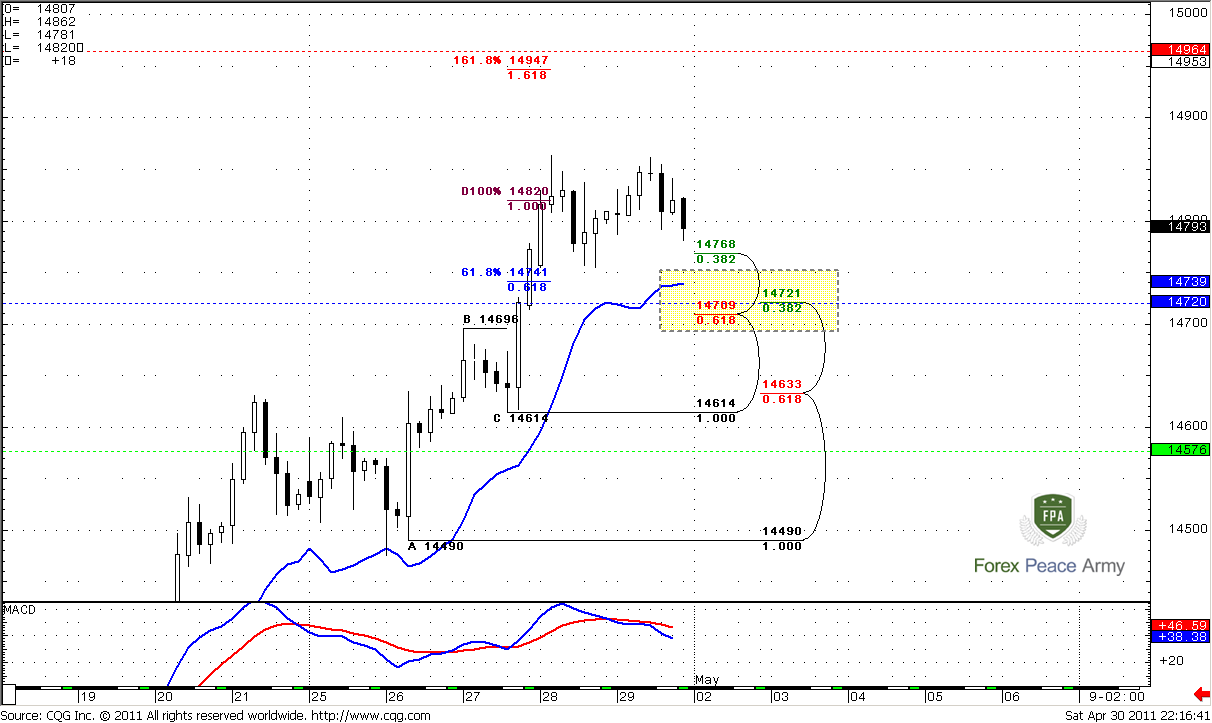
On hourly chart #2 analysis will be a bit advanced. Recent move down could be just AB-CD retracement and lead to Gartley “222” pattern. This pattern, in turn, could be a part of Butterfly “Sell” with target around the same 1.4950 area. Even AB-CD will complete – it will not erase the butterfly. Also, this AB-CD makes an Agreement with nearest Fib support. That’s why it very difficult to say – will market retrace to pivot or not – or it will move on a way of Butterfly.
#2
Conclusion:
Position traders:
If you have position – you may try to hold them a bit longer, possibly even till 1.52 but tight stops.
If you are flat now – stay flat. Although context is bullish, market stands at resistance and monthly overbought.
You can’t be sure at any situation when market at overbought.
Intraday traders:
Although trend is bullish, market stands at overbought. Hence – do not marry any position. Exit at previous highs or at nearest targets. Nearest target is 1.4950.
1. On Monday possibly could happen solid move, because Friday was an inside day.
2. Market could retrace till 1.4770 and start to complete Butterfly sell, or erase Butterfly and reach 1.4710-1.4720;
3. What it will be – impossible to say currently. But, Confluence support is safer and more probable, because market near daily overbought;
4. You may try to enter Long at initial touch of this area with hope that market will show some pull back after the first touch. This will allow you to move stop at breakeven.
5. Be sure that market shows gradual move to this level and not in free fall.
6. Be sure that once you’ve entered – market holds above the pivot. If not – then probably better out. It could be an early sign that market will show deeper retracement down.
The technical portion of Sive's analysis owes a great deal to Joe DiNapoli's methods, and uses a number of Joe's proprietary indicators. Please note that Sive's analysis is his own view of the market and is not endorsed by Joe DiNapoli or any related companies.
Now we start with new months, so today we have some additional details - overbought area for May stands at 1.4933. Also market has erased all Fib resistances from the recent swing down. Now the major importance for us is high at 1.5144 (red circle). If market will take out this level – then large down AB-CD pattern will be cancelled, since 1.5144 is a “C” point and market will get a free space to continue move to upside. But this is a bit long-term perspective and just a way of development of situation among some others. Nearest target stands at 1.5272, but in perspective it could turn to butterfly “Sell” pattern. The target of this pattern is 1.27 extension at 1.6027. Also it almost coincides with 1.27 target of recent bullish AB-CD. In fact, this view is a bullish one, and now this is a dominating view.
So, that’s about the targets and overall bias on the market. But in near term situation is a bit different. If you’re positional trader (you trade on long-term charts – weekly, monthly) – this is not the time to establish bullish position, because market stands at overbought condition. You need some pullback to enter the market. Also you can’t enter short, because there is no context for that. It’s hard to expect retracement now even to nearest Fib support, because market is not at any Fib resistance, or say, at some important Fib extension target. Still I’ve marked monthly Fib levels here. It means, that possibly market will turn to some consolidation or small range month, mostly sideways.
Weekly
Let’s continue to look at market from the position traders’ view. Trend is obviously bullish, and on weekly time frame, by the way, market is neither oversold nor overbought. The nearest target is 1.50-1.5150, and this is compound target – it includes 1.618 target from the initial AB-CD pattern at 1.4948, 1.618 target from most recent AB-CD at 1.5019 and 1.618 extension of previous retracement at 1.5145. During the previous research we’ve treated it as butterfly sell…
But this is not the end. May pivot points have coincided with 1.51 target area – monthly pivot resistance 1 stands at 1.5109 and previous highs at 1.4270 – pivot support 1 stands at 1.4286. May pivot itself stands at 1.4575.
So, it seems that very probable scenario is a reaching of 1.5144 highs, their wash & Rinse and then retracement lower at least till pivot point. From the probability point of view this is harder and harder to move higher for market due monthly overbought and when it will reach important target – it could turn to retracement.
Also, as you can see weekly chart gives us perfect thrust up – no deep retracements, participants still hold their positions, they have not fixed profits yet. So, it could turn to very sweet weekly Bread & Butter “Buy” pattern or may be even to DRPO ”Sell”- we’ll see, but this is very interesting situation, where we can forecast market’s direction with solid probability, since this pattern will start. Of cause this is not the question of 1-2 weeks, probably we will not see this scenario prior the summer, but still we should track it.
Daily
So as we have relatively strict trading plan for longer time frames – this is not a peace a cake to do this in shorter term charts. Furthermore, it is very hard to estimate upside target, because they follow one by one with 50 pips step – nearest is 1.4946 (that is also an overbought), then 1.50 and then weekly targets start – 1.5120 and 1.5145. But, so as this is daily analysis – let’s move day by day, and the nearest target is 1.4950.
Also take a look that 1.4964 is a weekly pivot resistance 1. I suppose that there are no many chances that market will pass this area on Monday. Pivot point stands right at nearest Fib support - 1.4716-1.4720, weekly pivot support coincides with monthly pivot and daily confluence support – 1.4586-1.4624. This area should hold if bulls area still in charge. But, very probable that market will creep somehow to 1.5150-1.52 before any significant retracement, but this suspicion does not cancel the possibility of retracement till pivot point each week. So, 14716 is an area to watch for. And something should happen – see, Friday’s day was inside day. Market either jump to 1.4950 or retrace lower.
Intraday
4-hour chart #1 tells us that trend turns bearish. Around 1.4710-1.4721 stand Fib support, pivot point and 4-hour oversold. First, market should hold above it, if it has plans to reach 1.4950. But, even if it will break it, it hardly will happen during initial touch. Hence, you may use this touch for entering Long. When market will show first pullback – move your stop to breakeven. Also follow a common sense – if market falls like a stone – do not enter long. If market will hold below pivot – then, retracement could be deeper.
#1
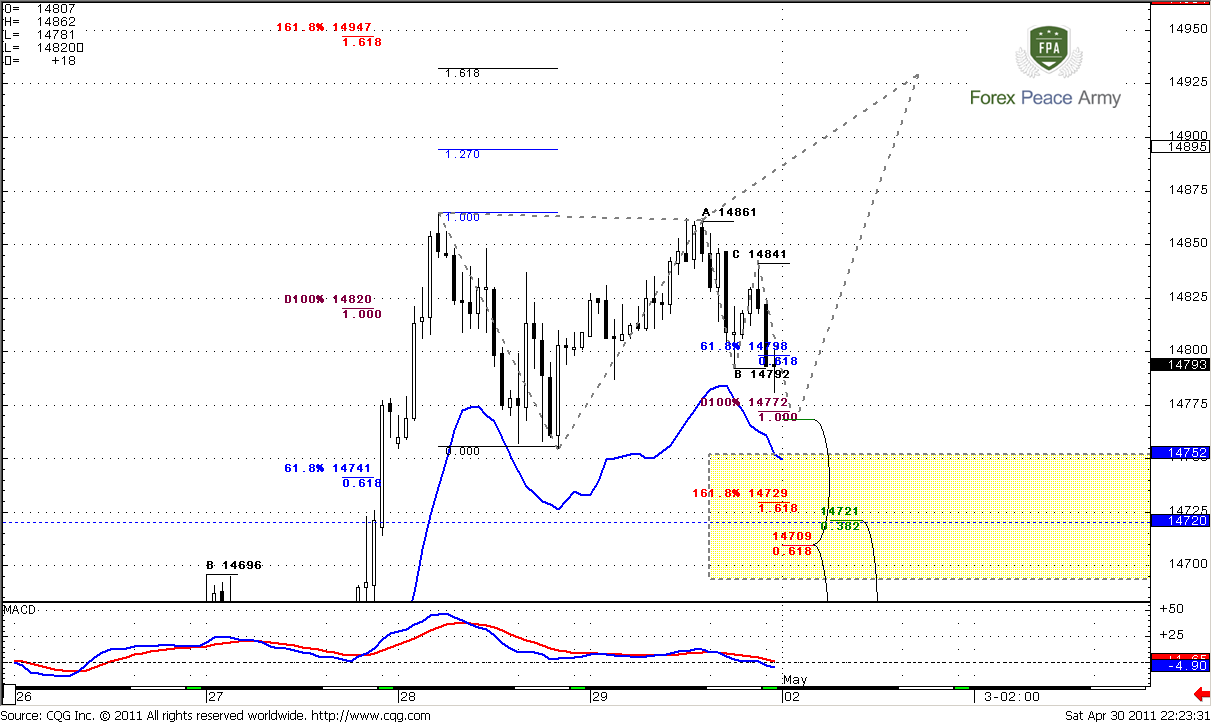
On hourly chart #2 analysis will be a bit advanced. Recent move down could be just AB-CD retracement and lead to Gartley “222” pattern. This pattern, in turn, could be a part of Butterfly “Sell” with target around the same 1.4950 area. Even AB-CD will complete – it will not erase the butterfly. Also, this AB-CD makes an Agreement with nearest Fib support. That’s why it very difficult to say – will market retrace to pivot or not – or it will move on a way of Butterfly.
#2
Conclusion:
Position traders:
If you have position – you may try to hold them a bit longer, possibly even till 1.52 but tight stops.
If you are flat now – stay flat. Although context is bullish, market stands at resistance and monthly overbought.
You can’t be sure at any situation when market at overbought.
Intraday traders:
Although trend is bullish, market stands at overbought. Hence – do not marry any position. Exit at previous highs or at nearest targets. Nearest target is 1.4950.
1. On Monday possibly could happen solid move, because Friday was an inside day.
2. Market could retrace till 1.4770 and start to complete Butterfly sell, or erase Butterfly and reach 1.4710-1.4720;
3. What it will be – impossible to say currently. But, Confluence support is safer and more probable, because market near daily overbought;
4. You may try to enter Long at initial touch of this area with hope that market will show some pull back after the first touch. This will allow you to move stop at breakeven.
5. Be sure that market shows gradual move to this level and not in free fall.
6. Be sure that once you’ve entered – market holds above the pivot. If not – then probably better out. It could be an early sign that market will show deeper retracement down.
The technical portion of Sive's analysis owes a great deal to Joe DiNapoli's methods, and uses a number of Joe's proprietary indicators. Please note that Sive's analysis is his own view of the market and is not endorsed by Joe DiNapoli or any related companies.
