Sive Morten
Special Consultant to the FPA
- Messages
- 18,664
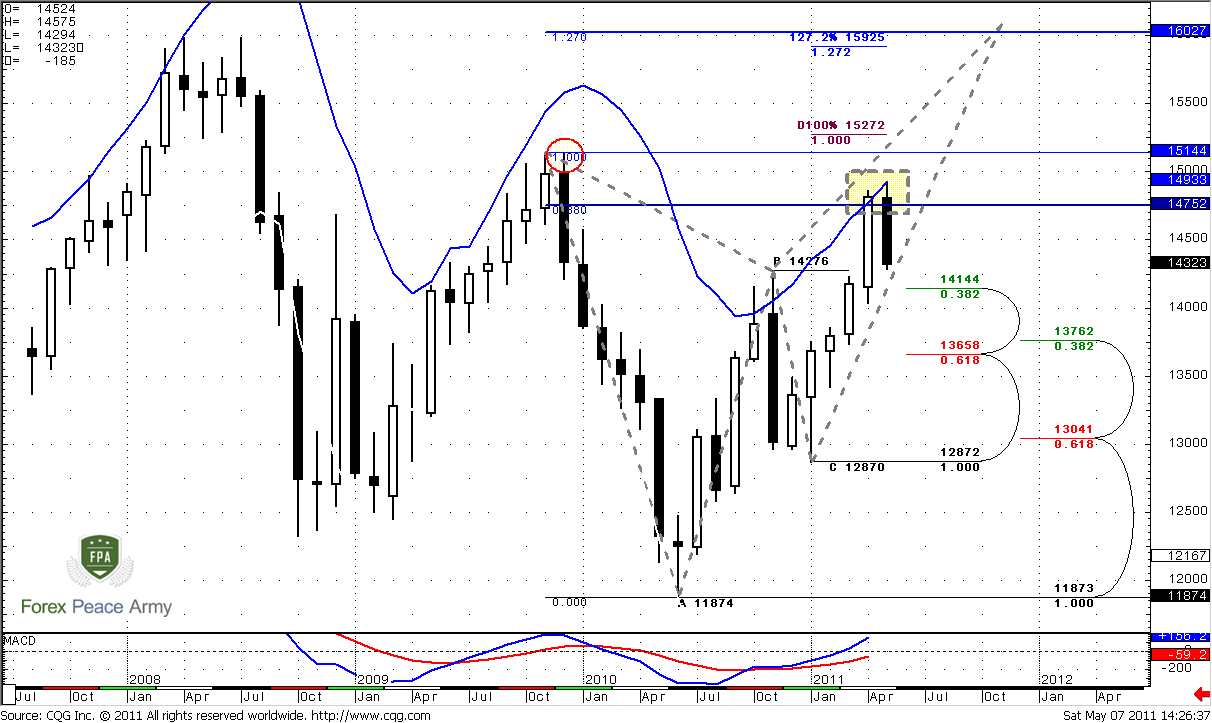
Monthly
As we’ve specified couple of weeks ago in fundamental part of research – EUR could continue its growth only if Germany economy will continue to show strong data, and ECB will continue to hike rate. Neither former nor latter has happened. Although US economy pace is shallow also and Fed action looks indecisive and anemic – this substances are static currently, better than expected NFP data add some fuel to retracement pace and it seems logical. Now let’s turn to pure technical analysis.
As usual this part of research will be very interesting for positional traders – those who trade on weekly and monthly time frames, i.e. long-term. As we’ve said, overall context is bullish, but market stands at monthly overbought, so this is not the moment to establish bullish positions. We need some pullback to enter long, and look like it has started. Now the major question - where it will finish…
The first area to watch is 1.4144 – previous highs and nearest Fib support. But I have some suspicions that this level could not hold market, because market at overbought. Usual retracement target during overbought is zero point of Detrended Oscillator and this level stands around monthly Confluence support 1.3762 - 1.3858. Still, if market will hold on first Fib support, this will be much better for current bullish bias and Butterfly pattern. Anyway, the first level to wait for is 1.4140 and then when & if market will reach it – we will take a look and discuss further price action. If market will take out “C” point at 1.2870 – this could lead to cancelling of bullish perspectives.
Nearest target stands at 1.5272, but potentially it could turn to butterfly “Sell” pattern. The target of this pattern is 1.27 extension at 1.6027. Also it almost coincides with 1.27 target of recent bullish AB-CD.
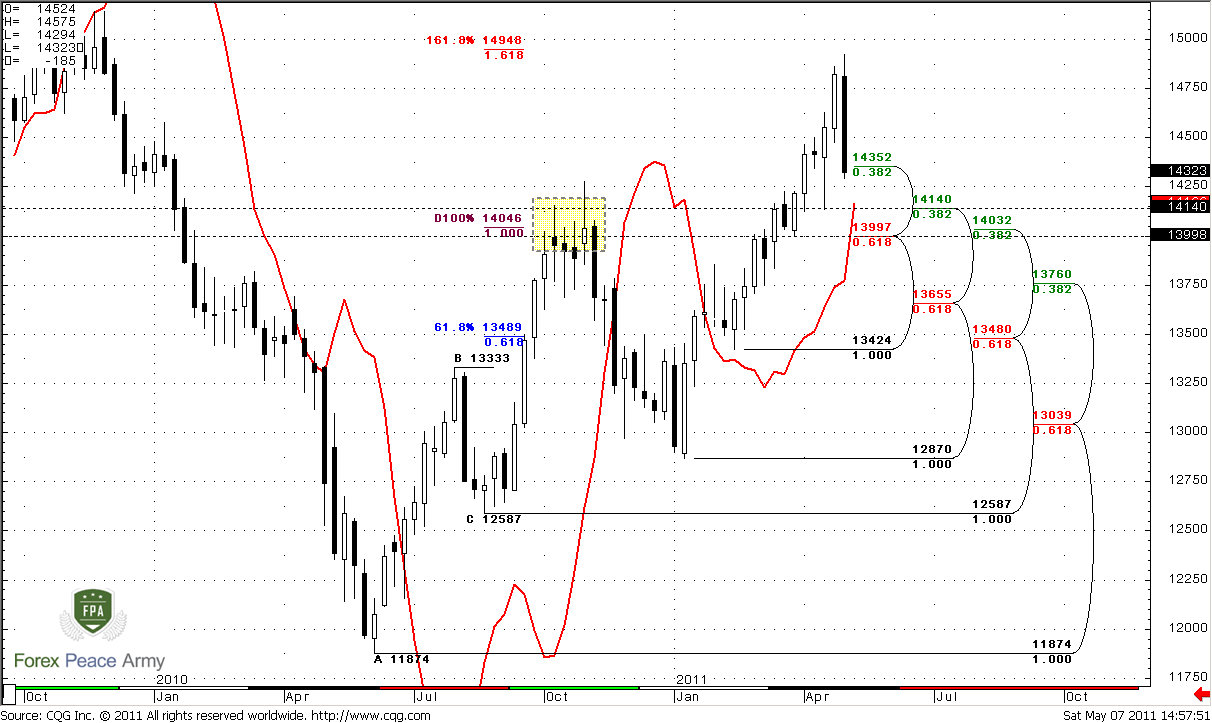
Weekly
Here we can see that trend is still bullish, but on current week market has shown a strong plunge, it engulfs previous two weeks. Take a note that this has happened, when market has hit 1.618 target at 1.4950 area. As we’ve said, the major area to watch for is 1.40-1.4140. This is weekly confluence support, previous highs and trend will remain bullish precisely till that area. It will be good for bullish bias if market will hold at this level. Even if it will not hold totally, we can count on some jump up from there, at least during first touch.
#1
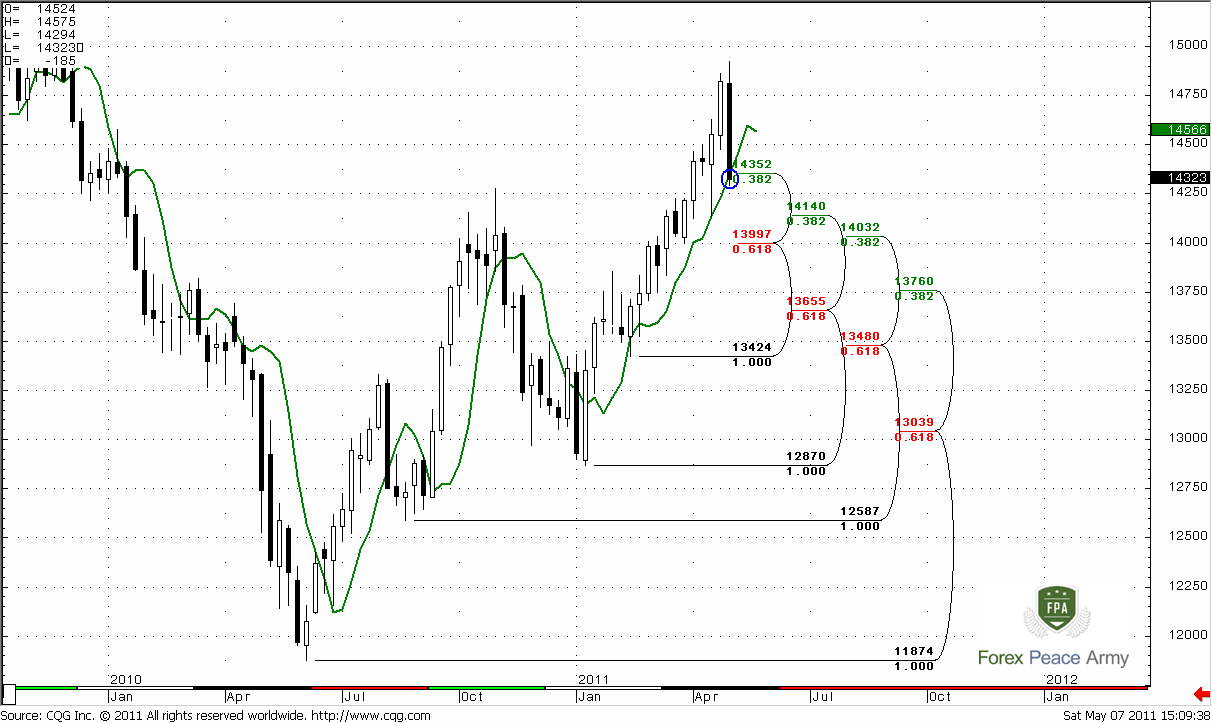
Now let’s take a look at chart #2. It shows perfect context for weekly Bread & Butter “Buy” directional pattern. B&B pattern has some important issues to accomplish – strong thrust up, then close below 3x3 DMA (green line) during 1-3 bars and reaching some significant Fib support. So here we already have first close below 3x3 DMA. First significant support area - 1.40-1.4140 and possibly retracement up could start from there. We should estimate that from daily time frame and it will become clear at the end of next week.
Why is it so big deal with this B&B? Because when it will start – it will point for us market direction for whole week. And even if you do not trade weekly charts – you will know the direction of market. This is the same as somebody will tell you – “During the whole week market will rise”. Will it help you?
But before that we should find some confirmation signals on daily time frame that will come a bit later.
#2
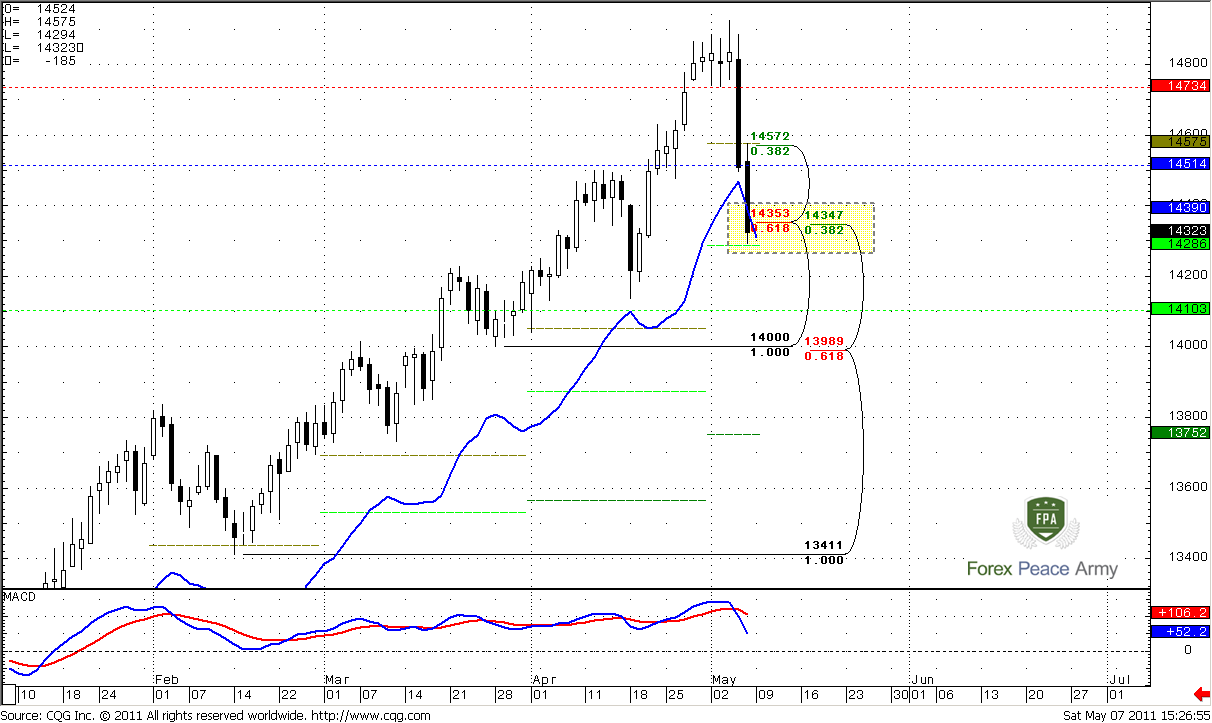
Daily
Here trend has turned bearish, market has reached daily confluence support, monthly pivot support1 and daily oversold. So, context is strongly bearish, but to establish short position we need some retracement up. Horizontal colored lines are weekly pivots. The fact that market is oversold at daily does not tell much, because it overbought at monthly and higher time frames overrules lower one. It means that market could deeper dive in oversold due to overbought on monthly.
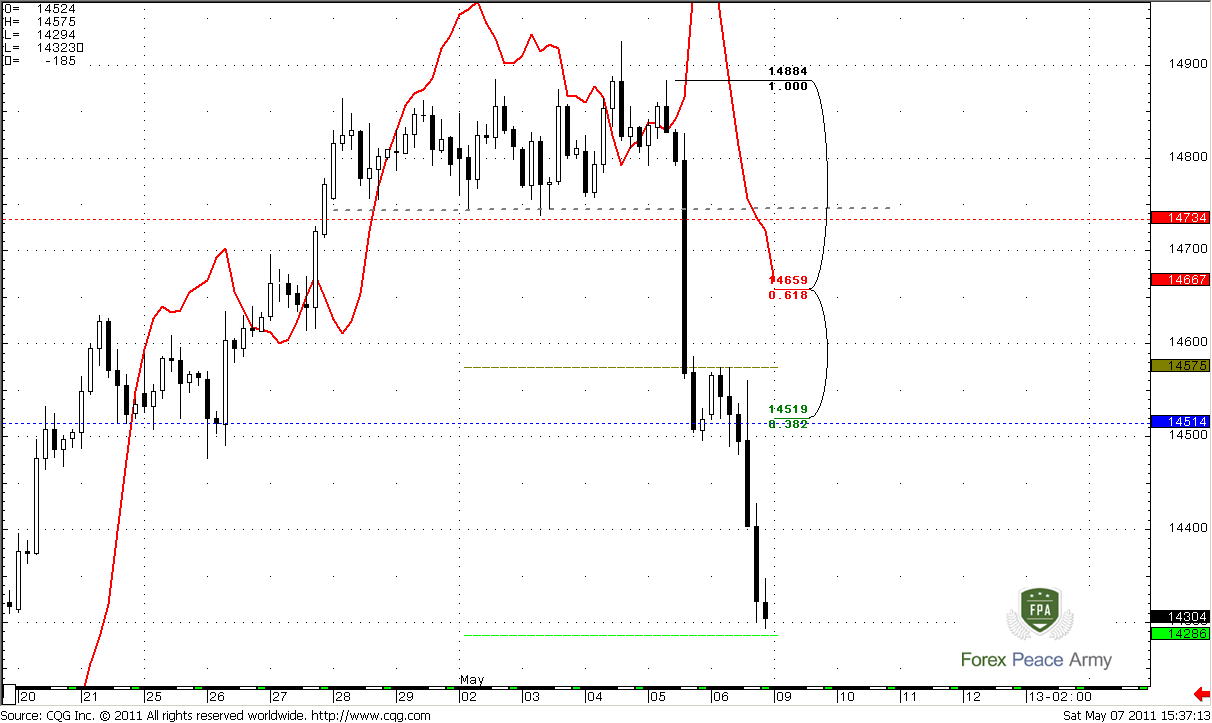
4-hour
Here we will act, as usual. While market has reached strong support and oversold on daily time frame, we should wait for some pullback to ride downside momentum and trade possible extension to the downside. The first area to watch for is weekly pivot at 1.4514 that is almost coincides with Fib resistance and monthly pivot at 1.4575. Next area – 1.4659 – 0.618 Fib resistance and 50% of nasty black candle. But major level that market should not take to hold bearish bias is 1.4730-1.4750 that is pivot resistance1 and the border of previous consolidation – market will protect it. Possibly weekly B&B could start even from current level, but I have some feelings that retracement should be deeper, because market has strong momentum down. Anyway, price action around pivot will tell us. If market will flirt it and continue move down – then we can count on 1.40-1.41 area. If it will move above it, then it could return back to 1.47-1.4750
Conclusion:
Position traders:
Retracement that we’ve discussed has started. Odds suggest that it could reach at least 1.40-1.4150 area, where you can think about reestablishing longs. But this is an assumption only. We should track daily time frame for clearer signals.
Intraday traders:
Trend is bearish, but market at strong support. Wait for pullback at least till 1.4520-1.4575 area before entering short. Then look how market will behave around the pivot. If it will fail there – establish shorts. The safest place for stops is somewhere inside consolidation above 1.4750. But you may try to place stop above 0.618 Fib resistance 1.4660.
If market will move above pivot and hold there – don’t be short, and wait for further developments. It could mean that weekly B&B will be right from this area, because formally, all necessary conditions for it have been accomplished, although market has not reached quite solid Fib support at weekly.
The technical portion of Sive's analysis owes a great deal to Joe DiNapoli's methods, and uses a number of Joe's proprietary indicators. Please note that Sive's analysis is his own view of the market and is not endorsed by Joe DiNapoli or any related companies.
As we’ve specified couple of weeks ago in fundamental part of research – EUR could continue its growth only if Germany economy will continue to show strong data, and ECB will continue to hike rate. Neither former nor latter has happened. Although US economy pace is shallow also and Fed action looks indecisive and anemic – this substances are static currently, better than expected NFP data add some fuel to retracement pace and it seems logical. Now let’s turn to pure technical analysis.
As usual this part of research will be very interesting for positional traders – those who trade on weekly and monthly time frames, i.e. long-term. As we’ve said, overall context is bullish, but market stands at monthly overbought, so this is not the moment to establish bullish positions. We need some pullback to enter long, and look like it has started. Now the major question - where it will finish…
The first area to watch is 1.4144 – previous highs and nearest Fib support. But I have some suspicions that this level could not hold market, because market at overbought. Usual retracement target during overbought is zero point of Detrended Oscillator and this level stands around monthly Confluence support 1.3762 - 1.3858. Still, if market will hold on first Fib support, this will be much better for current bullish bias and Butterfly pattern. Anyway, the first level to wait for is 1.4140 and then when & if market will reach it – we will take a look and discuss further price action. If market will take out “C” point at 1.2870 – this could lead to cancelling of bullish perspectives.
Nearest target stands at 1.5272, but potentially it could turn to butterfly “Sell” pattern. The target of this pattern is 1.27 extension at 1.6027. Also it almost coincides with 1.27 target of recent bullish AB-CD.
Weekly
Here we can see that trend is still bullish, but on current week market has shown a strong plunge, it engulfs previous two weeks. Take a note that this has happened, when market has hit 1.618 target at 1.4950 area. As we’ve said, the major area to watch for is 1.40-1.4140. This is weekly confluence support, previous highs and trend will remain bullish precisely till that area. It will be good for bullish bias if market will hold at this level. Even if it will not hold totally, we can count on some jump up from there, at least during first touch.
#1
Now let’s take a look at chart #2. It shows perfect context for weekly Bread & Butter “Buy” directional pattern. B&B pattern has some important issues to accomplish – strong thrust up, then close below 3x3 DMA (green line) during 1-3 bars and reaching some significant Fib support. So here we already have first close below 3x3 DMA. First significant support area - 1.40-1.4140 and possibly retracement up could start from there. We should estimate that from daily time frame and it will become clear at the end of next week.
Why is it so big deal with this B&B? Because when it will start – it will point for us market direction for whole week. And even if you do not trade weekly charts – you will know the direction of market. This is the same as somebody will tell you – “During the whole week market will rise”. Will it help you?
But before that we should find some confirmation signals on daily time frame that will come a bit later.
#2
Daily
Here trend has turned bearish, market has reached daily confluence support, monthly pivot support1 and daily oversold. So, context is strongly bearish, but to establish short position we need some retracement up. Horizontal colored lines are weekly pivots. The fact that market is oversold at daily does not tell much, because it overbought at monthly and higher time frames overrules lower one. It means that market could deeper dive in oversold due to overbought on monthly.
4-hour
Here we will act, as usual. While market has reached strong support and oversold on daily time frame, we should wait for some pullback to ride downside momentum and trade possible extension to the downside. The first area to watch for is weekly pivot at 1.4514 that is almost coincides with Fib resistance and monthly pivot at 1.4575. Next area – 1.4659 – 0.618 Fib resistance and 50% of nasty black candle. But major level that market should not take to hold bearish bias is 1.4730-1.4750 that is pivot resistance1 and the border of previous consolidation – market will protect it. Possibly weekly B&B could start even from current level, but I have some feelings that retracement should be deeper, because market has strong momentum down. Anyway, price action around pivot will tell us. If market will flirt it and continue move down – then we can count on 1.40-1.41 area. If it will move above it, then it could return back to 1.47-1.4750
Conclusion:
Position traders:
Retracement that we’ve discussed has started. Odds suggest that it could reach at least 1.40-1.4150 area, where you can think about reestablishing longs. But this is an assumption only. We should track daily time frame for clearer signals.
Intraday traders:
Trend is bearish, but market at strong support. Wait for pullback at least till 1.4520-1.4575 area before entering short. Then look how market will behave around the pivot. If it will fail there – establish shorts. The safest place for stops is somewhere inside consolidation above 1.4750. But you may try to place stop above 0.618 Fib resistance 1.4660.
If market will move above pivot and hold there – don’t be short, and wait for further developments. It could mean that weekly B&B will be right from this area, because formally, all necessary conditions for it have been accomplished, although market has not reached quite solid Fib support at weekly.
The technical portion of Sive's analysis owes a great deal to Joe DiNapoli's methods, and uses a number of Joe's proprietary indicators. Please note that Sive's analysis is his own view of the market and is not endorsed by Joe DiNapoli or any related companies.