Sive Morten
Special Consultant to the FPA
- Messages
- 18,621
Monthly
Here has nothing changed much – market trades in the same range, so monthly analysis remains untouched.
EUR/USD comes in very crucial period of time and this is partially confirmed by technical analysis. Ahead of us should be decided such questions as QE II finish, Greece bailout and US debt ceiling. Any of these events could drastically affect future behavior of EUR/USD pair. One of our long-term scenarios is a move to 1.60 area. This could happen, for instance, due US technical default and rating downgrading to AA. I’m telling all this stuff just to tune you on expectation of unexpected and be prepared to any scenario that just a couple of month ago have seemed as impossible. Don’t be deceived by summer period, when markets usually turn to calm and soft action.
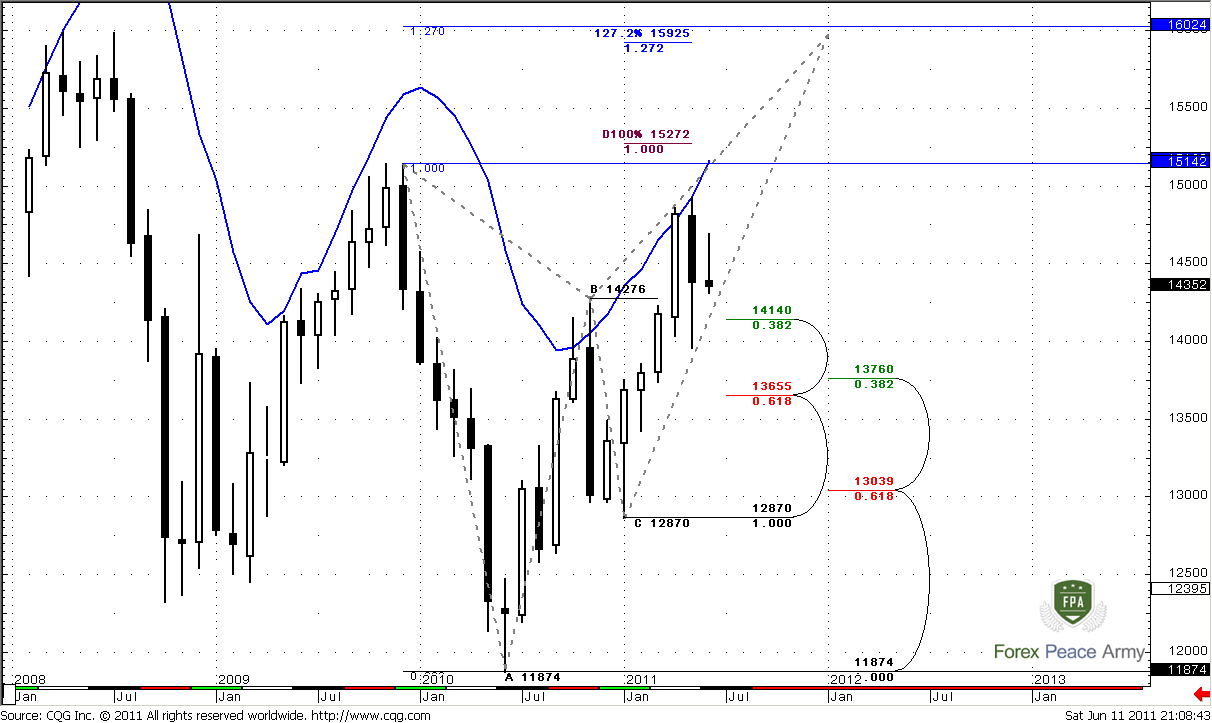
As we’ve appointed previously that the major task for us – to estimate will we see deeper AB-CD retracement to 1.37 level or market will continue move higher.
During the past two months market has shown retracement till nearest 3/8 Fib support at 1.4140 that stands very close to previous highs at 1.4276. Now it shows some bouncing from there. But this could be just respect of this level after initial touch or may be this is a real continuation to upside. Unfortunately we can’t estimate it from monthly chart.
Although we’ve counted to see bearish engulfing pattern, but its final view looks as insufficient. To confirm bearish bias we need close below 1.40. Downward possibility also implicitly confirms with market overbought. Usual retracement target during overbought is zero point of Detrended Oscillator and this level stands around monthly Confluence support. Also its worth to note here that trend will remain bullish, even if market will reach 1.37 area. Still, if market will hold on first Fib support, this will be much better for current bullish bias and Butterfly pattern.
Nearest target stands at 1.5272, but potentially it could turn to butterfly “Sell” pattern. The target of this pattern is 1.27 extension at 1.6024. Also it almost coincides with 1.27 target of recent bullish AB-CD at 1.5925.
Also take a note that overbought level for June stands at 1.5162 – right at previous highs 1.5144. Market should close above highs at 1.4925 to give us some confidence on bullish move continuation.
Weekly
On weekly time frame we have some very important news. As you remember on previous week we did not have this nasty black candle. That’s why we’ve said that market either continues move up to 1.52 or will show deeper retracement to 1.37. So, the first scenario now looks dubiously. There is only single week has passed, but we already have a lot of bearish signs:
1. Initial huge bearish engulfing still valid;
2. Trend holds bearish;
3. We’ve got next bearish engulfing;
4. We’ve got stop grabber pattern
First and second points are the same while third and fourth are new. Stop grabber is particularly important, because it points us the target – usually this pattern leads to taking out of previous lows, i.e. 1.3963. “Take out” means move lower than that level. If we take a look at the chart, then we will see that just below this level stands weekly Confluence support 1.3655-1.3760, that is also an Agreement with 1.3733 AB=CD target. Combination of new bearish engulfing, stop grabber and bear trend probably tells that we’ll see 1.37. Although that anything could happen, common sense does not show me any other scenarios. Or, rather there is a variant of upward move, but now it looks shy.
So, the major conclusion from weekly chart – we can count on retracement to 1.37.
Daily
Trend is still bullish, market neither overbought nor oversold currently. Here, as you remember, in medium term we expect to see Butterfly “Sell” pattern (although it could be cancelled by weekly scenario if stop grabber will work), while in short term there were two scenarios – Double Repo “Sell” pattern or Bread & Butter “Buy”. Now we might say that DRPO has been erased by price action – too deep retracement down, for DRPO this is unacceptable. But for B&B this is very nice context. Although I prefer to see greater thrust than we have currently and we can’t exclude the possibility that it could appear that this thrust will become insufficient for proper action from B&B, as we accustom to see it. Still, this scenario seems to me probable, and I offer you to keep an eye on it.
Besides, B&B has twofold importance. First, we can trade it itself, second – it will help us to possess for short trading due weekly context.
On chart #1 we see nice context for B&B – thrust, penetration of 3x3 SMA (green line), reaching of significant support – 50% of overall thrust up and two closes below 3x3. That’s nice. All that we still have to do is look for Buy signals on lower time frames. But we must note here, that current 50% Fib support is not so strong, besides this pattern has one more day, because B&B could start after 1-3 closes below 3x3 DMA. That’s why we can’t exclude start of this pattern from 1.42-1.4220 area – this is 0.618 Fib support and weekly pivot support 1.
Now take a look at red line – this is MACD Predictor and it will come in play right on Monday. As usual, we have to watch for trend shifting. If it will turn bearish and hold – it will give us more confidence about weekly’s bearish scenario. If we will see bullish stop grabber – that could become our signals of starting bullish B&B. As you can see, we must to do a lot of work on daily time frame.
#1
Now let’s take a look at chart #2. Here is the potential target of B&B and, our level to enter short according to weekly time frame – 1.4510, 0.618 Fib resistance from whole down move. But to be honest, may be this level will drift lower in the area of weekly pivot at 1.4456, if B&B will start not from current level but from 1.42-1.4220.
#2
4-hour
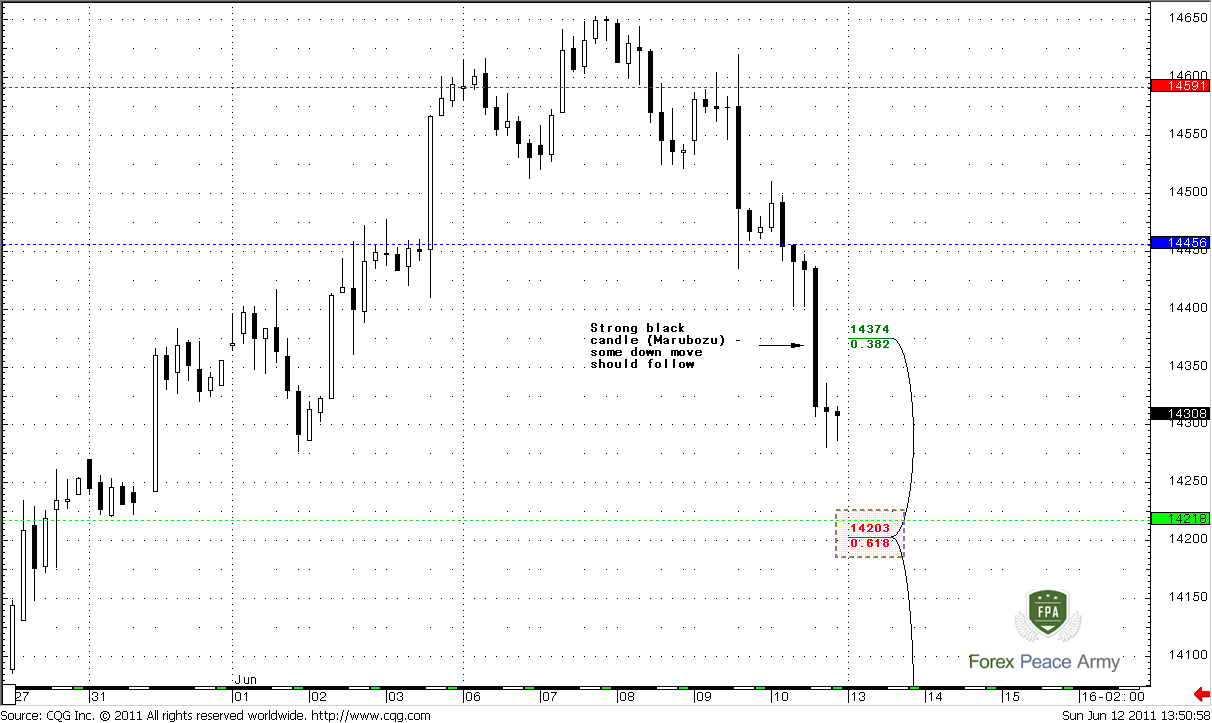
This time frame does not tell us much except the fact that down move should continue a bit more. This conclusion could be made based on strong nasty black Marubozu candle. After such strong moves even if market intends to reverse, it should slow down its pace first. This usually happens in a way like on followed chart but on the way to top. See – strong white candle – then some retracement, i.e. slowdown of upside pace, then market continue move up due to some momentum. So, something like that should happen on a way to 1.42 strong support area. If you scalp trader it could allow you to make fast bearish trade. Let’s take a look at in on hourly chart.
1-hour
This part of research is mostly for those who trade very short-term. First, we clear see that market stands at 50% daily support that we’ve discussed. We expect start of daily B&B, but we do not know will it start here or from 1.42 area. Hence, we should look for buy opportunities as here as from 1.42 if market will reach it.
Also keep in mind that if even market will show some pullback right from current level it is not necessary mean that B&B has started – it could be just short term retracement, slowdown of downward momentum and market can continue move to 1.42-1.4220 area. So, what we could do in such sophisticated environment?
1. Look at current level. We see nice thrust. Also note that 1.27 Fib target from AB=CD pattern stands a bit lower 1. 4275 and market has not reached it yet. Hence, looks like not bad idea to watch for some reversal pattern here that will touch 1.4275. For instance, it could be DRPO “Buy” or Butterfly “Buy”.
2. Let’s assume that market starts move up then. Here we will have to estimate is it really start point of B&B or not. If market will break 1.4368-1.4377 Confluence resistance, or even move above weekly pivot at 1.4456, then this is B&B. If it will stop somewhere around 1.4370-1.4380, then it will turn to 1.42 target.
For those of you who want to ride on both ways – you will have to take much more risk, since you will have to close Long around 1.4370 and due some “sell” patterns on 5-30 min charts enter short with target 1.42-1.4220. In this trade stop could be placed above another Confluence support 1.4423 or even above pivot point 1.4456. But, do not enter short if market will explode to the upside. Based on the way how move up will develop you’ll understand what to wait – if it will be gradual lazy move up, then probably we’ll see 1.4220, if fast and strong thrusting move, then probably this is B&B itself.
Current environment, as you see, very sophisticated, so be extra careful. May be it makes sense to skip some blur trades and concentrate on major ones.
Conclusion:
Position traders:
Now move to 1.3650-1.37 looks more probable that week ago.
Intraday and daily traders:
At least three trade probabilities exist now:
1. Scalp on 60 min chart on possible upward pullback from 50% daily support;
2. Scalp on 60-min chart to 1.42 area if market will show just respect of 50% Fib support and not B&B;
3. Daily B&B, although it is unclear yet, from which level it will start - current level or 1.42. We should know it in 1-2 days.
The technical portion of Sive's analysis owes a great deal to Joe DiNapoli's methods, and uses a number of Joe's proprietary indicators. Please note that Sive's analysis is his own view of the market and is not endorsed by Joe DiNapoli or any related companies.
Now September Futures is leading contract, so my quotes will be lower than on spot market.
Here has nothing changed much – market trades in the same range, so monthly analysis remains untouched.
EUR/USD comes in very crucial period of time and this is partially confirmed by technical analysis. Ahead of us should be decided such questions as QE II finish, Greece bailout and US debt ceiling. Any of these events could drastically affect future behavior of EUR/USD pair. One of our long-term scenarios is a move to 1.60 area. This could happen, for instance, due US technical default and rating downgrading to AA. I’m telling all this stuff just to tune you on expectation of unexpected and be prepared to any scenario that just a couple of month ago have seemed as impossible. Don’t be deceived by summer period, when markets usually turn to calm and soft action.
As we’ve appointed previously that the major task for us – to estimate will we see deeper AB-CD retracement to 1.37 level or market will continue move higher.
During the past two months market has shown retracement till nearest 3/8 Fib support at 1.4140 that stands very close to previous highs at 1.4276. Now it shows some bouncing from there. But this could be just respect of this level after initial touch or may be this is a real continuation to upside. Unfortunately we can’t estimate it from monthly chart.
Although we’ve counted to see bearish engulfing pattern, but its final view looks as insufficient. To confirm bearish bias we need close below 1.40. Downward possibility also implicitly confirms with market overbought. Usual retracement target during overbought is zero point of Detrended Oscillator and this level stands around monthly Confluence support. Also its worth to note here that trend will remain bullish, even if market will reach 1.37 area. Still, if market will hold on first Fib support, this will be much better for current bullish bias and Butterfly pattern.
Nearest target stands at 1.5272, but potentially it could turn to butterfly “Sell” pattern. The target of this pattern is 1.27 extension at 1.6024. Also it almost coincides with 1.27 target of recent bullish AB-CD at 1.5925.
Also take a note that overbought level for June stands at 1.5162 – right at previous highs 1.5144. Market should close above highs at 1.4925 to give us some confidence on bullish move continuation.
Weekly
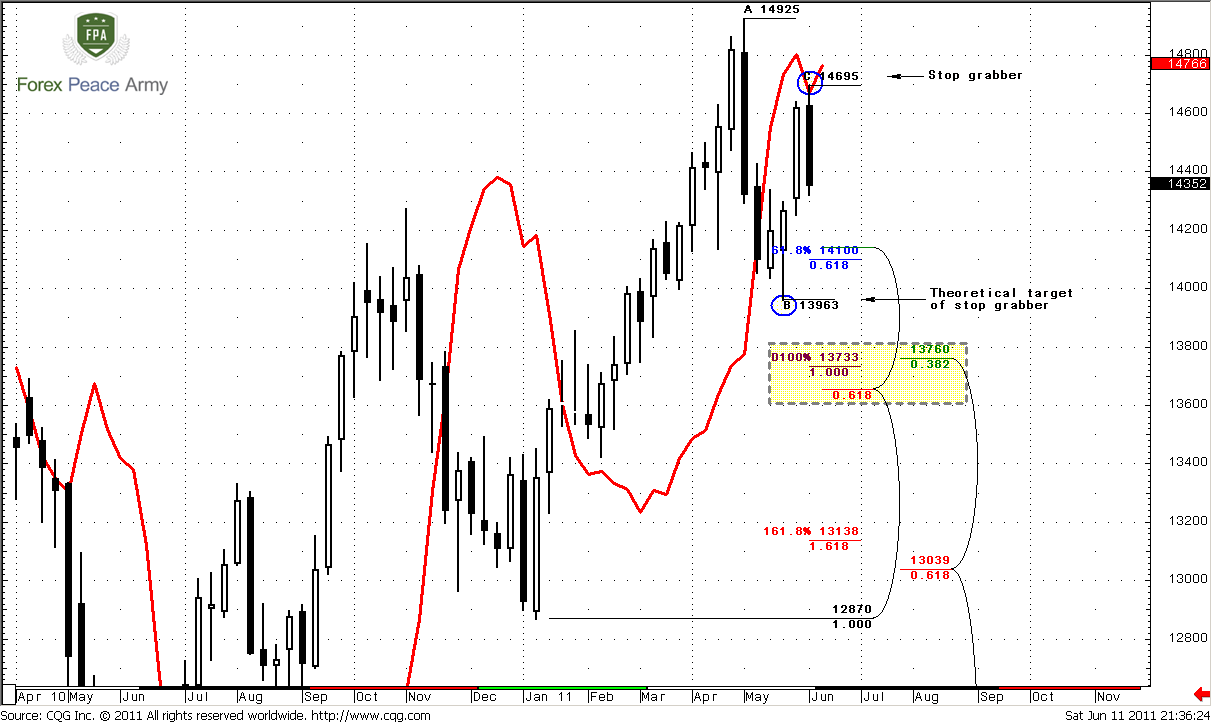
On weekly time frame we have some very important news. As you remember on previous week we did not have this nasty black candle. That’s why we’ve said that market either continues move up to 1.52 or will show deeper retracement to 1.37. So, the first scenario now looks dubiously. There is only single week has passed, but we already have a lot of bearish signs:
1. Initial huge bearish engulfing still valid;
2. Trend holds bearish;
3. We’ve got next bearish engulfing;
4. We’ve got stop grabber pattern
First and second points are the same while third and fourth are new. Stop grabber is particularly important, because it points us the target – usually this pattern leads to taking out of previous lows, i.e. 1.3963. “Take out” means move lower than that level. If we take a look at the chart, then we will see that just below this level stands weekly Confluence support 1.3655-1.3760, that is also an Agreement with 1.3733 AB=CD target. Combination of new bearish engulfing, stop grabber and bear trend probably tells that we’ll see 1.37. Although that anything could happen, common sense does not show me any other scenarios. Or, rather there is a variant of upward move, but now it looks shy.
So, the major conclusion from weekly chart – we can count on retracement to 1.37.
Daily
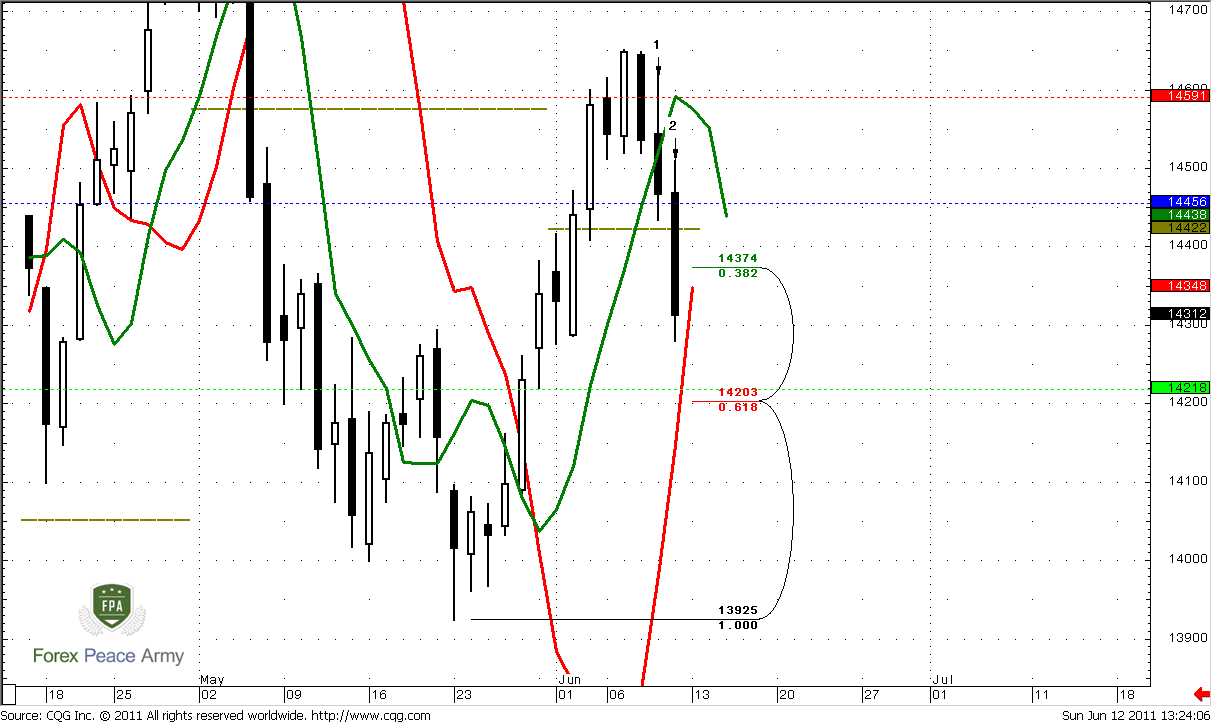
Trend is still bullish, market neither overbought nor oversold currently. Here, as you remember, in medium term we expect to see Butterfly “Sell” pattern (although it could be cancelled by weekly scenario if stop grabber will work), while in short term there were two scenarios – Double Repo “Sell” pattern or Bread & Butter “Buy”. Now we might say that DRPO has been erased by price action – too deep retracement down, for DRPO this is unacceptable. But for B&B this is very nice context. Although I prefer to see greater thrust than we have currently and we can’t exclude the possibility that it could appear that this thrust will become insufficient for proper action from B&B, as we accustom to see it. Still, this scenario seems to me probable, and I offer you to keep an eye on it.
Besides, B&B has twofold importance. First, we can trade it itself, second – it will help us to possess for short trading due weekly context.
On chart #1 we see nice context for B&B – thrust, penetration of 3x3 SMA (green line), reaching of significant support – 50% of overall thrust up and two closes below 3x3. That’s nice. All that we still have to do is look for Buy signals on lower time frames. But we must note here, that current 50% Fib support is not so strong, besides this pattern has one more day, because B&B could start after 1-3 closes below 3x3 DMA. That’s why we can’t exclude start of this pattern from 1.42-1.4220 area – this is 0.618 Fib support and weekly pivot support 1.
Now take a look at red line – this is MACD Predictor and it will come in play right on Monday. As usual, we have to watch for trend shifting. If it will turn bearish and hold – it will give us more confidence about weekly’s bearish scenario. If we will see bullish stop grabber – that could become our signals of starting bullish B&B. As you can see, we must to do a lot of work on daily time frame.
#1
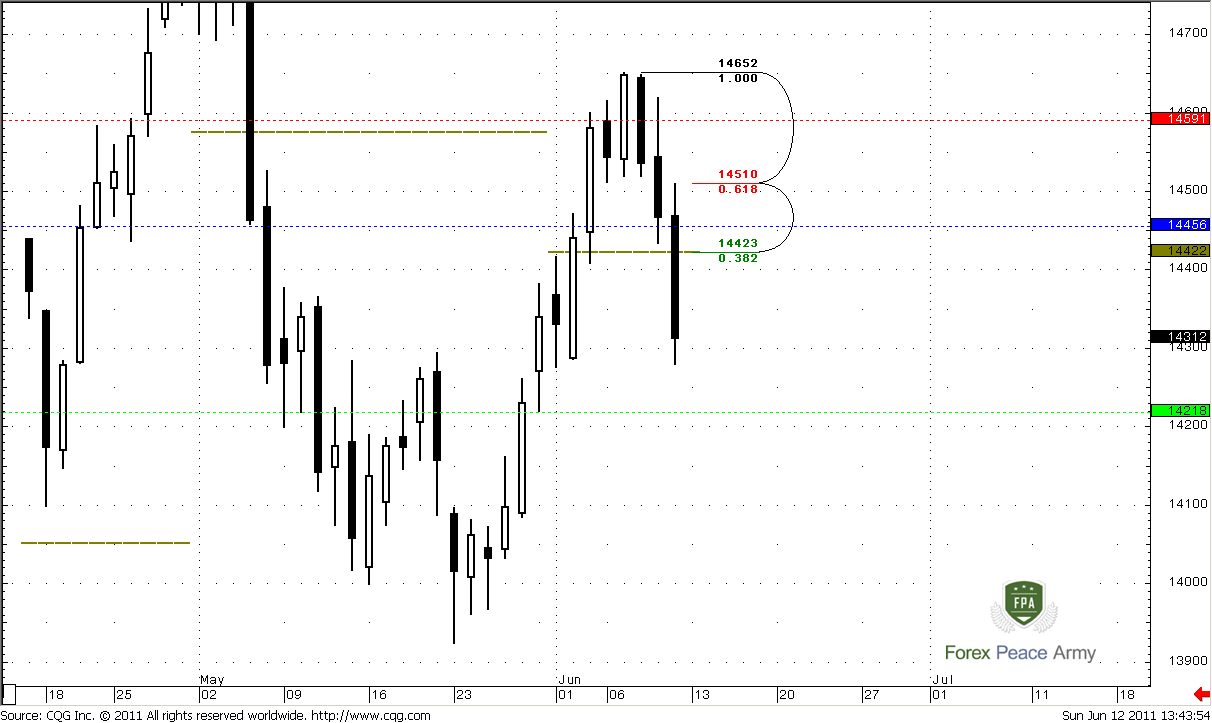
Now let’s take a look at chart #2. Here is the potential target of B&B and, our level to enter short according to weekly time frame – 1.4510, 0.618 Fib resistance from whole down move. But to be honest, may be this level will drift lower in the area of weekly pivot at 1.4456, if B&B will start not from current level but from 1.42-1.4220.
#2
4-hour
This time frame does not tell us much except the fact that down move should continue a bit more. This conclusion could be made based on strong nasty black Marubozu candle. After such strong moves even if market intends to reverse, it should slow down its pace first. This usually happens in a way like on followed chart but on the way to top. See – strong white candle – then some retracement, i.e. slowdown of upside pace, then market continue move up due to some momentum. So, something like that should happen on a way to 1.42 strong support area. If you scalp trader it could allow you to make fast bearish trade. Let’s take a look at in on hourly chart.
1-hour
This part of research is mostly for those who trade very short-term. First, we clear see that market stands at 50% daily support that we’ve discussed. We expect start of daily B&B, but we do not know will it start here or from 1.42 area. Hence, we should look for buy opportunities as here as from 1.42 if market will reach it.
Also keep in mind that if even market will show some pullback right from current level it is not necessary mean that B&B has started – it could be just short term retracement, slowdown of downward momentum and market can continue move to 1.42-1.4220 area. So, what we could do in such sophisticated environment?
1. Look at current level. We see nice thrust. Also note that 1.27 Fib target from AB=CD pattern stands a bit lower 1. 4275 and market has not reached it yet. Hence, looks like not bad idea to watch for some reversal pattern here that will touch 1.4275. For instance, it could be DRPO “Buy” or Butterfly “Buy”.
2. Let’s assume that market starts move up then. Here we will have to estimate is it really start point of B&B or not. If market will break 1.4368-1.4377 Confluence resistance, or even move above weekly pivot at 1.4456, then this is B&B. If it will stop somewhere around 1.4370-1.4380, then it will turn to 1.42 target.
For those of you who want to ride on both ways – you will have to take much more risk, since you will have to close Long around 1.4370 and due some “sell” patterns on 5-30 min charts enter short with target 1.42-1.4220. In this trade stop could be placed above another Confluence support 1.4423 or even above pivot point 1.4456. But, do not enter short if market will explode to the upside. Based on the way how move up will develop you’ll understand what to wait – if it will be gradual lazy move up, then probably we’ll see 1.4220, if fast and strong thrusting move, then probably this is B&B itself.
Current environment, as you see, very sophisticated, so be extra careful. May be it makes sense to skip some blur trades and concentrate on major ones.
Conclusion:
Position traders:
Now move to 1.3650-1.37 looks more probable that week ago.
Intraday and daily traders:
At least three trade probabilities exist now:
1. Scalp on 60 min chart on possible upward pullback from 50% daily support;
2. Scalp on 60-min chart to 1.42 area if market will show just respect of 50% Fib support and not B&B;
3. Daily B&B, although it is unclear yet, from which level it will start - current level or 1.42. We should know it in 1-2 days.
The technical portion of Sive's analysis owes a great deal to Joe DiNapoli's methods, and uses a number of Joe's proprietary indicators. Please note that Sive's analysis is his own view of the market and is not endorsed by Joe DiNapoli or any related companies.
") thanks again for your thorough analysis once again. please would like to know which area you will recommend to place stop loss from Long on 1.4275 region.
thanks again for your thorough analysis once again. please would like to know which area you will recommend to place stop loss from Long on 1.4275 region.