Sive Morten
Special Consultant to the FPA
- Messages
- 18,648
Monthly
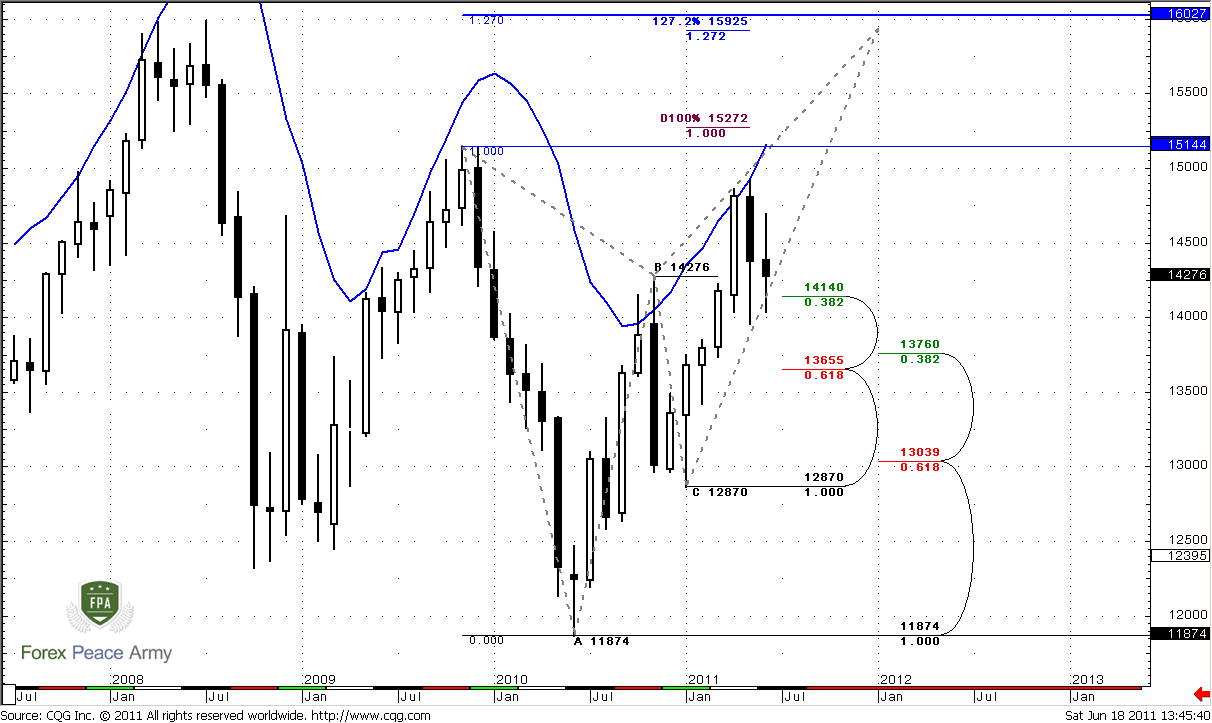
As we’ve appointed previously that the major task for us – to estimate will we see deeper AB-CD retracement to 1.37 level or market will continue move higher. Currently this possibility has not been cancelled yet, and still possible.
During the past two months market has shown retracement till nearest 3/8 Fib support at 1.4140 that stands very close to previous highs at 1.4276. Now it shows some bouncing from there. June as you can see now looks like inside trading month compares to May. Market stands in the same range after respecting of nearest Fib support at 1.4140.
Although we’ve counted to see bearish engulfing pattern, but its final view looks as insufficient. To confirm bearish bias we need close below 1.40. Downward possibility also implicitly confirms with market overbought. Usual retracement target during overbought is zero point of Detrended Oscillator and this level stands around monthly Confluence support. Also its worth to note here that trend will remain bullish, even if market will reach 1.37 area. Still, if market will hold on first Fib support, this will be much better for current bullish bias and Butterfly pattern.
Nearest target stands at 1.5272, but potentially it could turn to butterfly “Sell” pattern. The target of this pattern is 1.27 extension at 1.6024. Also it almost coincides with 1.27 target of recent bullish AB-CD at 1.5925.
Also take a note that overbought level for June stands at 1.5162 – right at previous highs 1.5144. Market should close above highs at 1.4925 to give us some confidence on bullish move continuation.
#1
As an alternative scenario I want to show you a bit different picture. This scenario suggests possible reversal not at 1.60 but at 1.52 area. Also it suggests retracement to 1.37 monthly confluence support. This is 3-Drive “Sell”:
#2
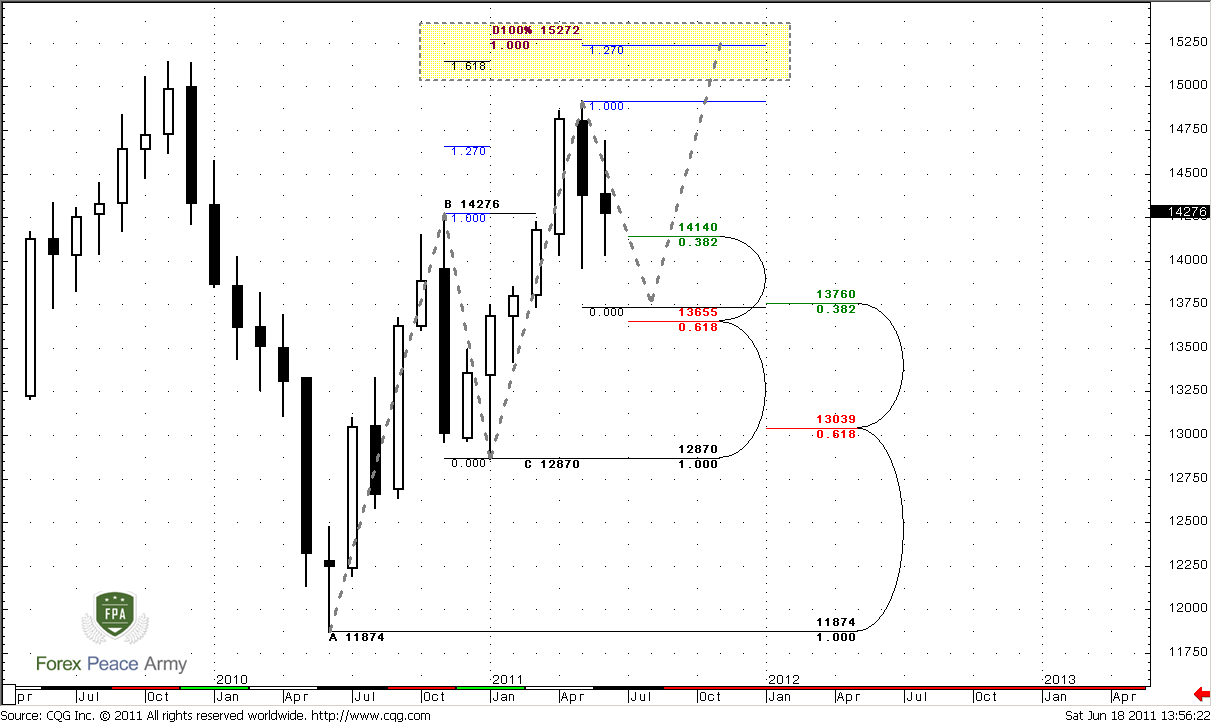
See – for agreement of 1.618 of first drive and 1.27 of second drive market should show retracement to 1.37 before acceleration to 1.52. Let’s see, what lower time frames tell us.
Weekly
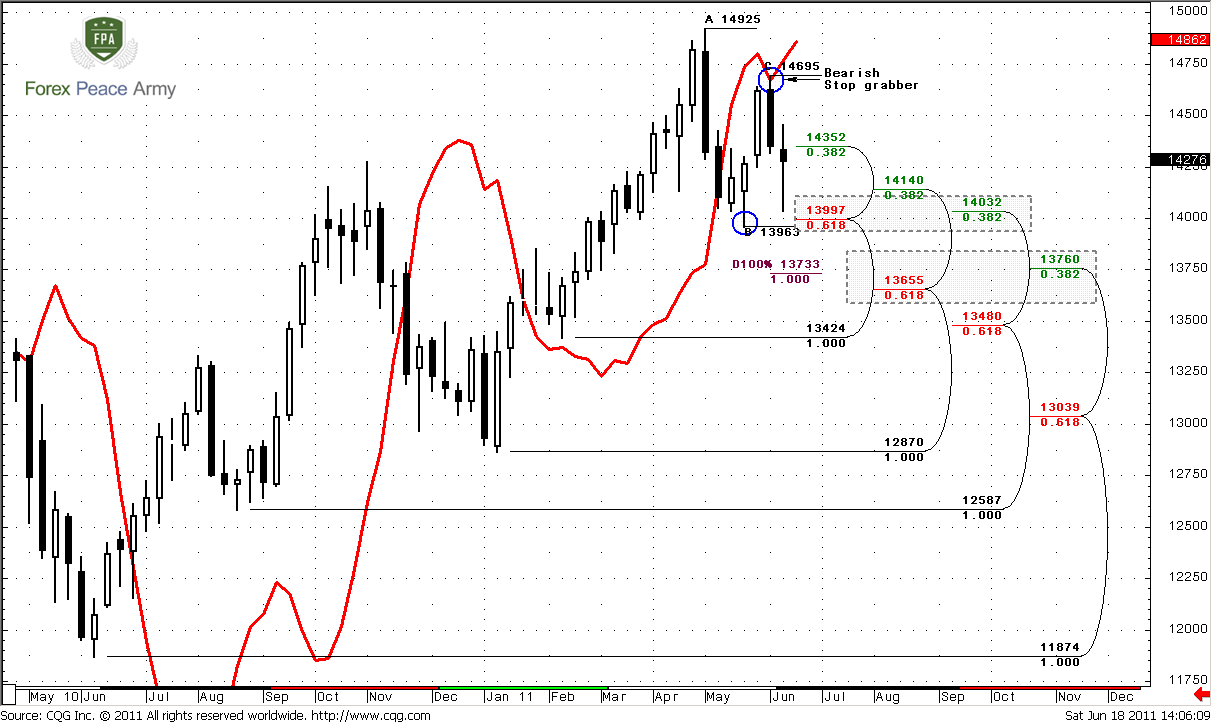
Weekly trend is bearish. Major pattern that is in action currently is a bearish stop grabber. Its potential target is 1.3963 low. But if market will reach it – it will cancel daily butterfly “Sell”, so I will not be surprised by move to 1.37 area. Still, nearest Confluence support at 1.40-1.4040 holds. By the way, 1.40 is a previous highs also. The way how market will behave in medium term tells us will we see move to 1.37 or not.
By now we still have a lot of bearish signs:
1. Initial huge bearish engulfing still valid;
2. Trend holds bearish;
3. We’ve got next bearish engulfing;
4. We’ve got stop grabber pattern
First and second points are the same while third and fourth are new. Stop grabber is particularly important, because it points us the target – usually this pattern leads to taking out of previous lows, i.e. 1.3963. “Take out” means move lower than that level. If we take a look at the chart, then we will see that just below this level stands weekly Confluence support 1.3655-1.3760, that is also an Agreement with 1.3733 AB=CD target. Combination of new bearish engulfing, stop grabber and bear trend probably tells that we’ll see 1.37. Although that anything could happen, common sense does not show me any other scenarios. Or, rather there is a variant of upward move, but now it looks shy.
Think about harmony between time frames. Monthly chart tells, that market has to reach 1.37 so that 3-Drive pattern will become perfect and it’s target 1.52. Monthly AB=CD also points at the same area. Weekly chart shows stop grabber and Agreement precisely at 1.37.
Daily
Trend is bearish, market neither oversold nor overbought. Market has hit the level that we’ve discussed as a crucial one. This is daily Confluence resistance, classical resistance, and ~50% resistance of nasty black candle. If market still has bearish bias then it should not break through that area. If it will and totally erase this black bar, then it will be look like shift in market momentum and we will have to worry about further move up. But to be honest, I’d return to speaking about Butterfly only if market will move above 1.45 again.
Still, AB=CD move to 1.4085 tells that market has greater odds to continue move down. Because such kind of acceleration from 0.618 to 1.0 target usually leads to 1.618 at 1.3856 after 0.618 retracement – precisely what market is doing now. Also, take a not how this 1.618 target agrees with weekly stop grabber…
#1
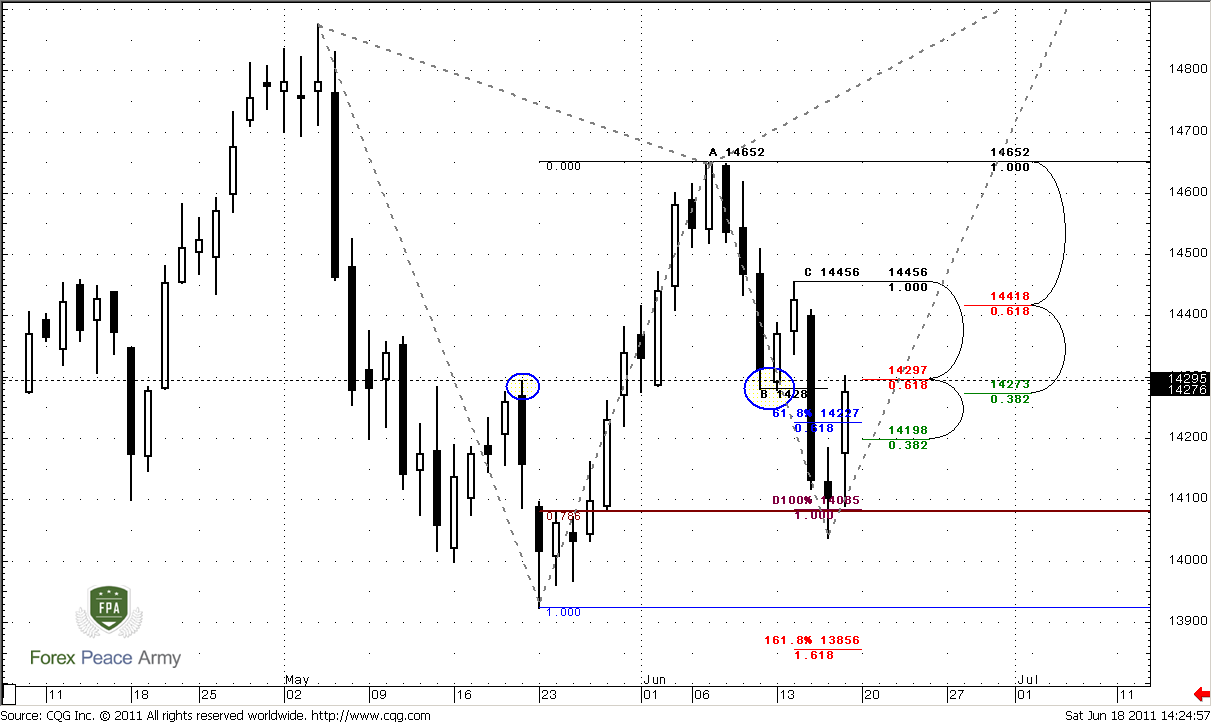
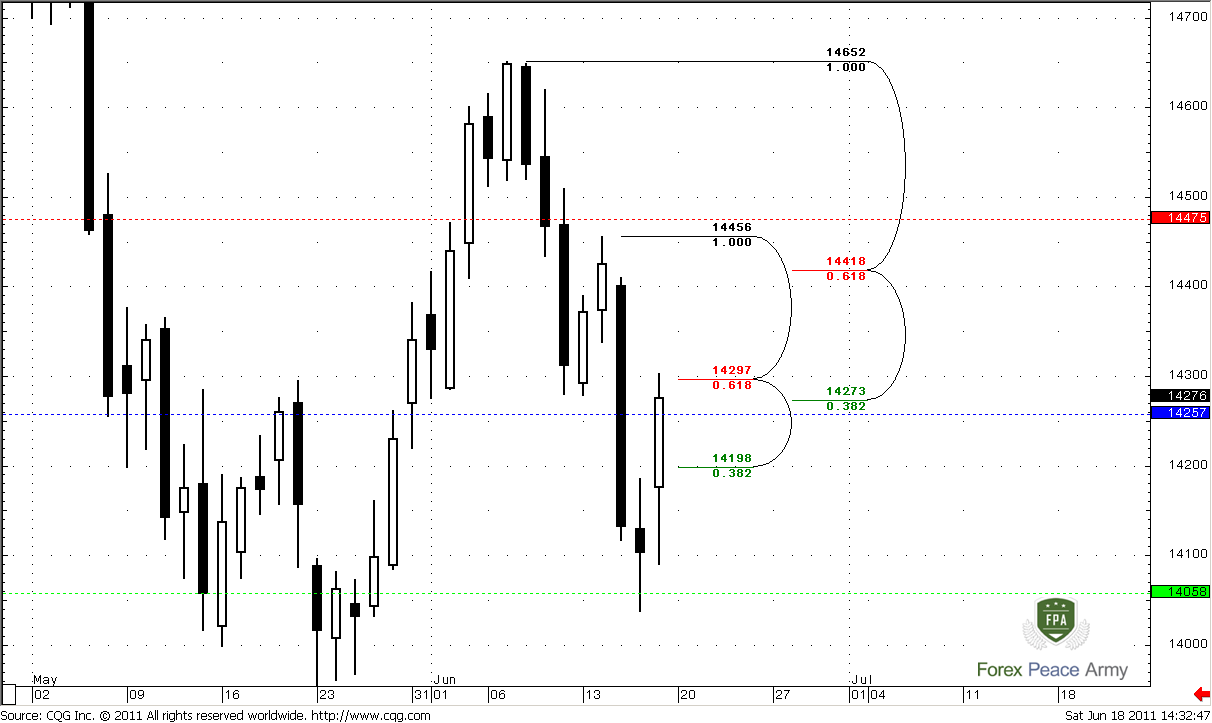
So, we have excellent bearish bias, all trends are bearish, market stands at resistance. We should search for sell signals. On chart #2 we clearly see that pivot point 1.4257 stands very close to Confluence resistance 1.4273-1.4297. This will be our first clue. If market will move below pivot and hold there – it gives us more confidence to enter short. All that we will remain to do is to find some patterns to enter.
#2
4-hour
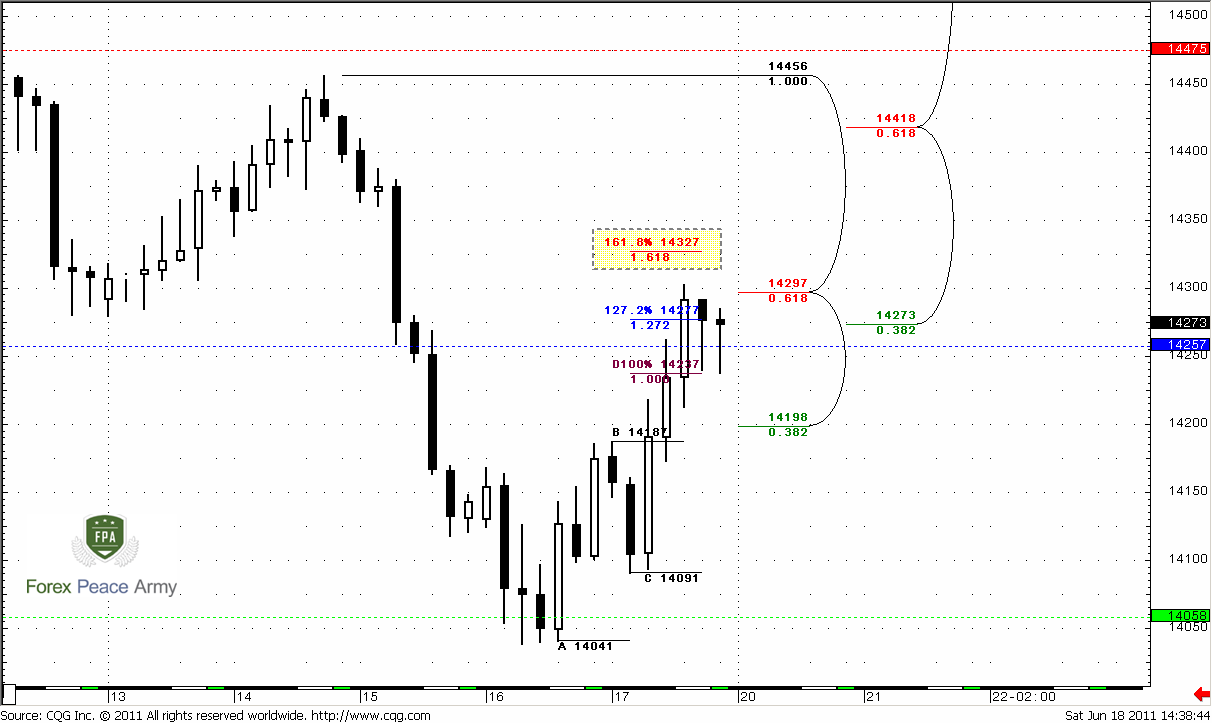
Trend is bullish. Here we could make only single observation. Move due AB-CD pattern is fast and market accelerates right to 1.0-1.272. So, before enter short I prefer to see achievement of 1.618 target at 1.4330. Only after that shift to search some bearish reversal patterns.
1-hour
Hourly environment also hints at some upward continuation. Market starts to form triangle that is continuation pattern. Also we see stop grabber, that prompt on upward breakout and at least clearing of 1.43 highs. Most recent AB-CD has a target at 1.4328 that agrees with 4-hour 1.618.
Conclusion:
Position traders:
Now move to 1.3650-1.37 looks more probable that week ago. Coming week should clarify that.
Intraday and daily traders:
We need to get confirmation of downward continuation. For that purpose wait on Monday reaching of 1.4330 area, move below weekly pivot and some bearish reversal patterns. Market should not continue move up. Otherwise, move to 1.37 area will be under question. Other words, our major task for beginning of the week is to get confirmation of market’s sentiment.
The technical portion of Sive's analysis owes a great deal to Joe DiNapoli's methods, and uses a number of Joe's proprietary indicators. Please note that Sive's analysis is his own view of the market and is not endorsed by Joe DiNapoli or any related companies.
Now September Futures is leading contract, so my quotes will be lower than on spot market.
EUR/USD comes in very crucial period of time and this is partially confirmed by technical analysis. Ahead of us should be decided such questions as QE II finish, Greece bailout and US debt ceiling. Any of these events could drastically affect future behavior of EUR/USD pair. You already see this nervous environment as on past week market action. One of our long-term scenarios is a move to 1.60 area. This could happen, for instance, due US technical default and rating downgrading to AA, or, otherwise, due super positive Greece problems decision. I’m telling all this stuff just to tune you on expectation of unexpected and be prepared to any scenario that just a couple of month ago have seemed as impossible. Don’t be deceived by summer period, when markets usually turn to calm and soft action.As we’ve appointed previously that the major task for us – to estimate will we see deeper AB-CD retracement to 1.37 level or market will continue move higher. Currently this possibility has not been cancelled yet, and still possible.
During the past two months market has shown retracement till nearest 3/8 Fib support at 1.4140 that stands very close to previous highs at 1.4276. Now it shows some bouncing from there. June as you can see now looks like inside trading month compares to May. Market stands in the same range after respecting of nearest Fib support at 1.4140.
Although we’ve counted to see bearish engulfing pattern, but its final view looks as insufficient. To confirm bearish bias we need close below 1.40. Downward possibility also implicitly confirms with market overbought. Usual retracement target during overbought is zero point of Detrended Oscillator and this level stands around monthly Confluence support. Also its worth to note here that trend will remain bullish, even if market will reach 1.37 area. Still, if market will hold on first Fib support, this will be much better for current bullish bias and Butterfly pattern.
Nearest target stands at 1.5272, but potentially it could turn to butterfly “Sell” pattern. The target of this pattern is 1.27 extension at 1.6024. Also it almost coincides with 1.27 target of recent bullish AB-CD at 1.5925.
Also take a note that overbought level for June stands at 1.5162 – right at previous highs 1.5144. Market should close above highs at 1.4925 to give us some confidence on bullish move continuation.
#1
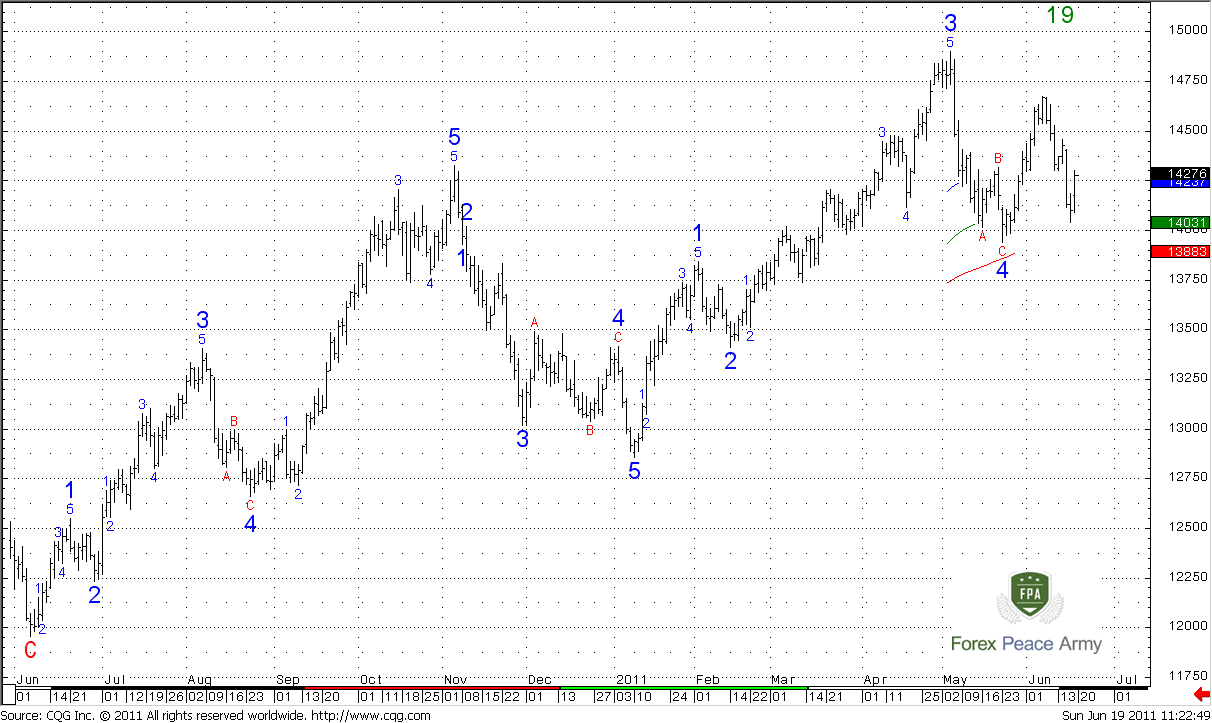
As an alternative scenario I want to show you a bit different picture. This scenario suggests possible reversal not at 1.60 but at 1.52 area. Also it suggests retracement to 1.37 monthly confluence support. This is 3-Drive “Sell”:
#2
See – for agreement of 1.618 of first drive and 1.27 of second drive market should show retracement to 1.37 before acceleration to 1.52. Let’s see, what lower time frames tell us.
Weekly
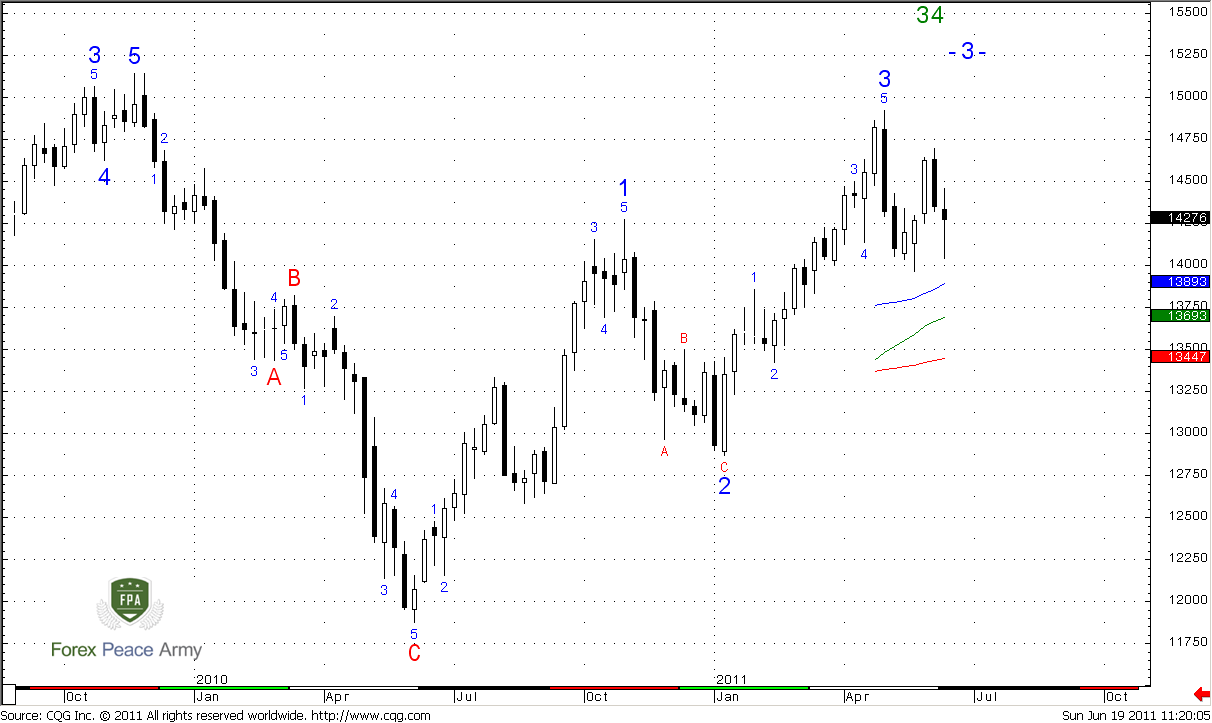
Weekly trend is bearish. Major pattern that is in action currently is a bearish stop grabber. Its potential target is 1.3963 low. But if market will reach it – it will cancel daily butterfly “Sell”, so I will not be surprised by move to 1.37 area. Still, nearest Confluence support at 1.40-1.4040 holds. By the way, 1.40 is a previous highs also. The way how market will behave in medium term tells us will we see move to 1.37 or not.
By now we still have a lot of bearish signs:
1. Initial huge bearish engulfing still valid;
2. Trend holds bearish;
3. We’ve got next bearish engulfing;
4. We’ve got stop grabber pattern
First and second points are the same while third and fourth are new. Stop grabber is particularly important, because it points us the target – usually this pattern leads to taking out of previous lows, i.e. 1.3963. “Take out” means move lower than that level. If we take a look at the chart, then we will see that just below this level stands weekly Confluence support 1.3655-1.3760, that is also an Agreement with 1.3733 AB=CD target. Combination of new bearish engulfing, stop grabber and bear trend probably tells that we’ll see 1.37. Although that anything could happen, common sense does not show me any other scenarios. Or, rather there is a variant of upward move, but now it looks shy.
Think about harmony between time frames. Monthly chart tells, that market has to reach 1.37 so that 3-Drive pattern will become perfect and it’s target 1.52. Monthly AB=CD also points at the same area. Weekly chart shows stop grabber and Agreement precisely at 1.37.
Daily
Trend is bearish, market neither oversold nor overbought. Market has hit the level that we’ve discussed as a crucial one. This is daily Confluence resistance, classical resistance, and ~50% resistance of nasty black candle. If market still has bearish bias then it should not break through that area. If it will and totally erase this black bar, then it will be look like shift in market momentum and we will have to worry about further move up. But to be honest, I’d return to speaking about Butterfly only if market will move above 1.45 again.
Still, AB=CD move to 1.4085 tells that market has greater odds to continue move down. Because such kind of acceleration from 0.618 to 1.0 target usually leads to 1.618 at 1.3856 after 0.618 retracement – precisely what market is doing now. Also, take a not how this 1.618 target agrees with weekly stop grabber…
#1
So, we have excellent bearish bias, all trends are bearish, market stands at resistance. We should search for sell signals. On chart #2 we clearly see that pivot point 1.4257 stands very close to Confluence resistance 1.4273-1.4297. This will be our first clue. If market will move below pivot and hold there – it gives us more confidence to enter short. All that we will remain to do is to find some patterns to enter.
#2
4-hour
Trend is bullish. Here we could make only single observation. Move due AB-CD pattern is fast and market accelerates right to 1.0-1.272. So, before enter short I prefer to see achievement of 1.618 target at 1.4330. Only after that shift to search some bearish reversal patterns.
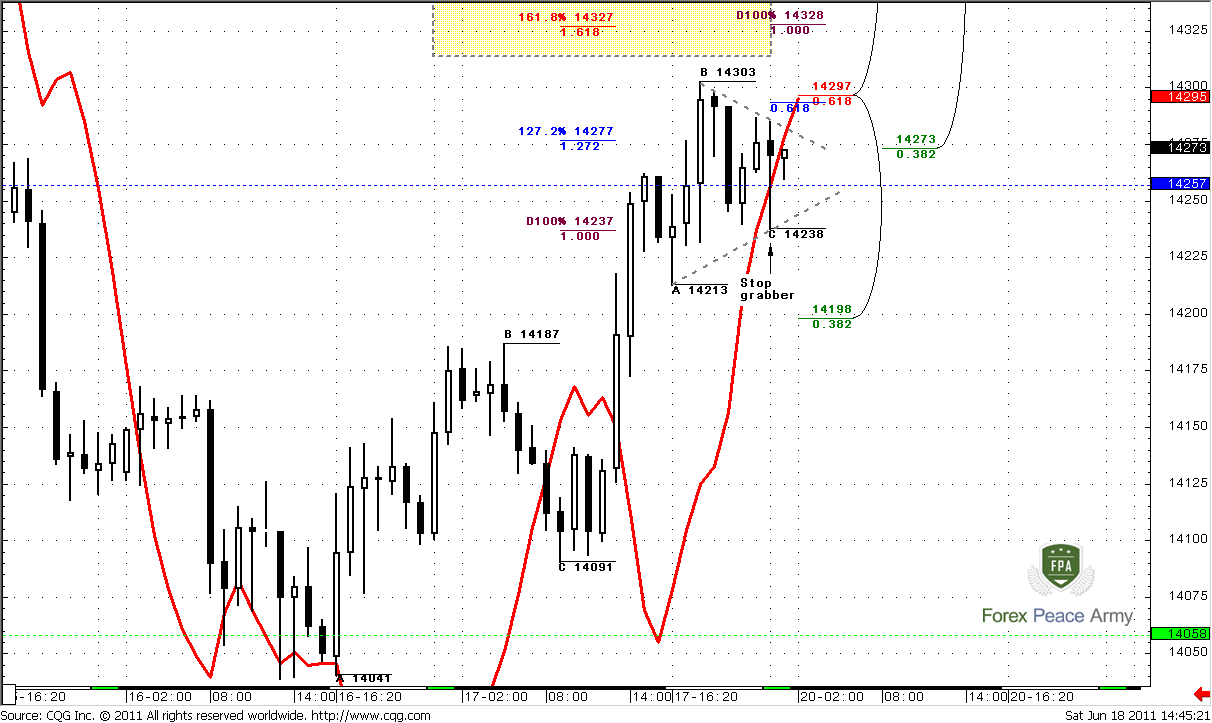
1-hour
Hourly environment also hints at some upward continuation. Market starts to form triangle that is continuation pattern. Also we see stop grabber, that prompt on upward breakout and at least clearing of 1.43 highs. Most recent AB-CD has a target at 1.4328 that agrees with 4-hour 1.618.
Conclusion:
Position traders:
Now move to 1.3650-1.37 looks more probable that week ago. Coming week should clarify that.
Intraday and daily traders:
We need to get confirmation of downward continuation. For that purpose wait on Monday reaching of 1.4330 area, move below weekly pivot and some bearish reversal patterns. Market should not continue move up. Otherwise, move to 1.37 area will be under question. Other words, our major task for beginning of the week is to get confirmation of market’s sentiment.
The technical portion of Sive's analysis owes a great deal to Joe DiNapoli's methods, and uses a number of Joe's proprietary indicators. Please note that Sive's analysis is his own view of the market and is not endorsed by Joe DiNapoli or any related companies.
Last edited:
")