Sive Morten
Special Consultant to the FPA
- Messages
- 18,664
Fundamentals
There is no need to be a prophet to say that situation on the markets remains tough. As a confirmation of that we can point on USD/CHF downward acceleration as strong increase in demand for franc has taken place. Franc, by the way shows greatest appreciation in value, compares to all other currencies. Second, take a look at the yield of short-term Swiss bonds and their correlation with EUR/CHF. Third, significant yield decrease in US Treasuries and its staying at the low levels also confirms worries among investors. So, let’s discuss major events and unexpected issues that could come in nearest future.
Looks like rally in CHF will continue until market will give some confidence of calming and coming stability. Early indication of that will be changing direction of Swiss notes, because this will tell that investors are ready to take some more risk. Until that will happen, CHF appreciation should continue. Besides, USD does not look currently like absolutely safe-haven currency due to debt lawmakers’ disagreement problems in US.
Let’s start from US. The major ghost is debt ceiling question. The point is that this problem has to be resolved not later than in the early August, because otherwise total debt, including accrued interest will reach limit and US formally will not be able to issue US Treasuries and have to only repay it. That currently leads to default, since US have no ability to do that. Still, most part of the market thinks that US will make a decision of increasing debt ceiling. Speaking about long-term perspective, take in mind that total debt of US is not just US Treasuries that is about 14 Trillion, but if we include different social programs (Medicare, Students, etc) that is about 100 Trillion USD. Second, to 2015 the value of official debt will reach 103% of US GDP, if Government will not take hard steps in reducing of Budget deficit. So, as you can see long-term perspective of USD is under question and rising of debt ceiling currently is just a half a measure – a technical step to calm down investors, but it does not change the foundation of the problem. During July I suggest, we should to keep an eye on Congress schedule meeting, especially on Budget committee.
Other events are relatively supporting for USD – Greece problems, threat of rate hike in China will resurrect old feelings of disdain for liquidity removal in times of softer economic numbers and, finally, flowing 60 mln Barrels of oil by IEA.
Speaking about EU, demand dominating for safe-haven will remain untouched. Although there could be some relief for EU on Wednesday, when vote on Greek austerity measures will take place, still more probable that trade will be driven by news as very often has happened during past few weeks. Note that inter-Parliament and populous resistance seems elevated. Unless there are positive headlines from the weekend suggesting progress euro could become weaker into the vote. Even if Greece passes the austerity package, second important moment is macro data on coming week from Germany – EU PMI and CPI. If there will be poor figures from the euro zone’s largest economy - this will take away support from the euro.
Monthly
EUR/USD comes in very crucial period of time and this is partially confirmed by technical analysis. Ahead of us should be decided such questions as QE II finish, Greece austerity measures and US debt ceiling. Any of these events could drastically affect future behavior of EUR/USD pair. You already see this nervous environment as on past week market action. One of our long-term scenarios is a move to 1.60 area. This could happen, for instance, due US technical default and rating downgrading to AA, or, otherwise, due super positive Greece problems decision. I’m telling all this stuff just to tune you on expectation of unexpected and be prepared to any scenario that just a couple of month ago have seemed as impossible. Don’t be deceived by summer period, when markets usually turn to calm and soft action.
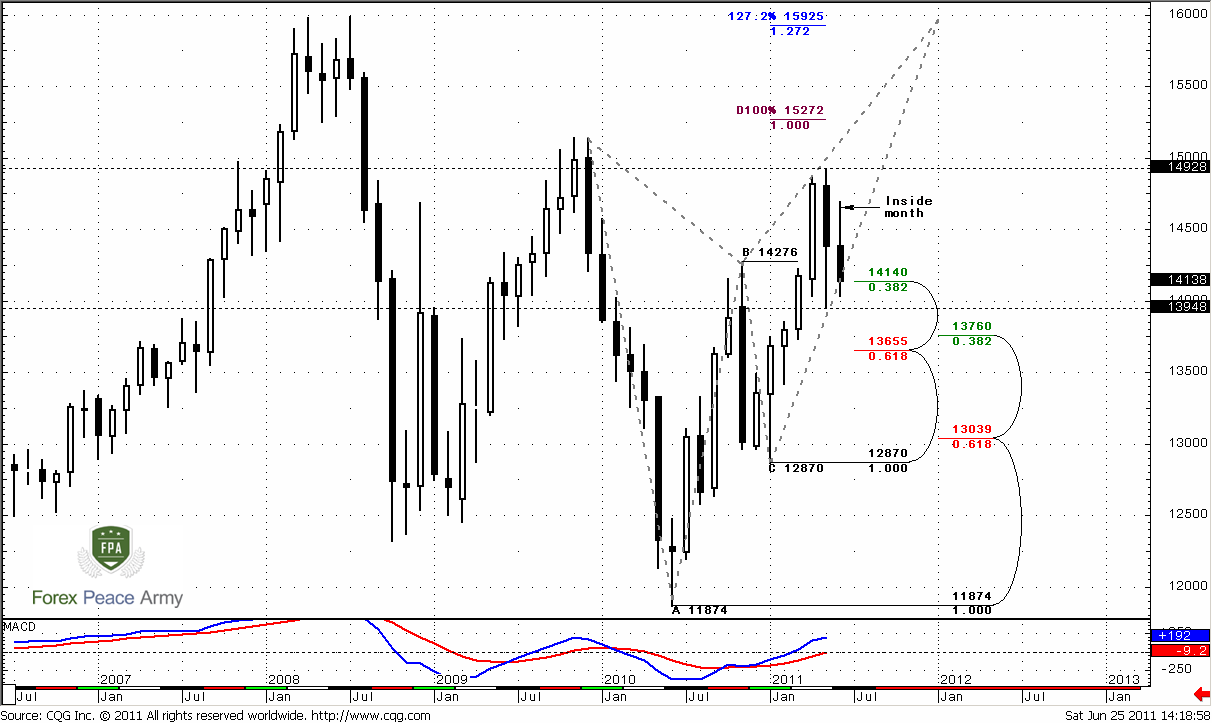
As we’ve appointed previously that the major task for us – to estimate will we see deeper AB-CD retracement to 1.37 level or market will continue move higher. Currently this possibility comes on first stage and becomes more and more probable.
During the past two months market has shown retracement till nearest 3/8 Fib support at 1.4140 that stands very close to previous highs at 1.4276. Now it shows some bouncing from there. June as you can see now looks like inside trading month compares to May. Currently market shows second testing of 1.4140 area. As oftener market tests it as it becomes weaker. So, as we’ve said deeper AB=CD retracement now looks very probable.
Still to absolutely be sure with bearish bias we need close below 1.40. Downward possibility also implicitly confirms with market overbought. Usual retracement target during overbought is zero point of Detrended Oscillator and this level stands around monthly Confluence support. Also its worth to note here that trend will remain bullish, even if market will reach 1.37 area. Still, if market will hold on first Fib support, this will be much better for current bullish bias and Butterfly pattern.
Nearest target stands at 1.5272, but potentially it could turn to butterfly “Sell” pattern. The target of this pattern is 1.27 extension at 1.6024. Also it almost coincides with 1.27 target of recent bullish AB-CD at 1.5925.
Also take a note that overbought level for June stands at 1.5162 – right at previous highs 1.5144. Market should close above highs at 1.4925 to give us some confidence on bullish move continuation.
As an alternative scenario I want to show you a bit different picture. This scenario suggests possible reversal not at 1.60 but at 1.52 area. Also it suggests retracement to 1.37 monthly confluence support. This is 3-Drive “Sell”:
#2
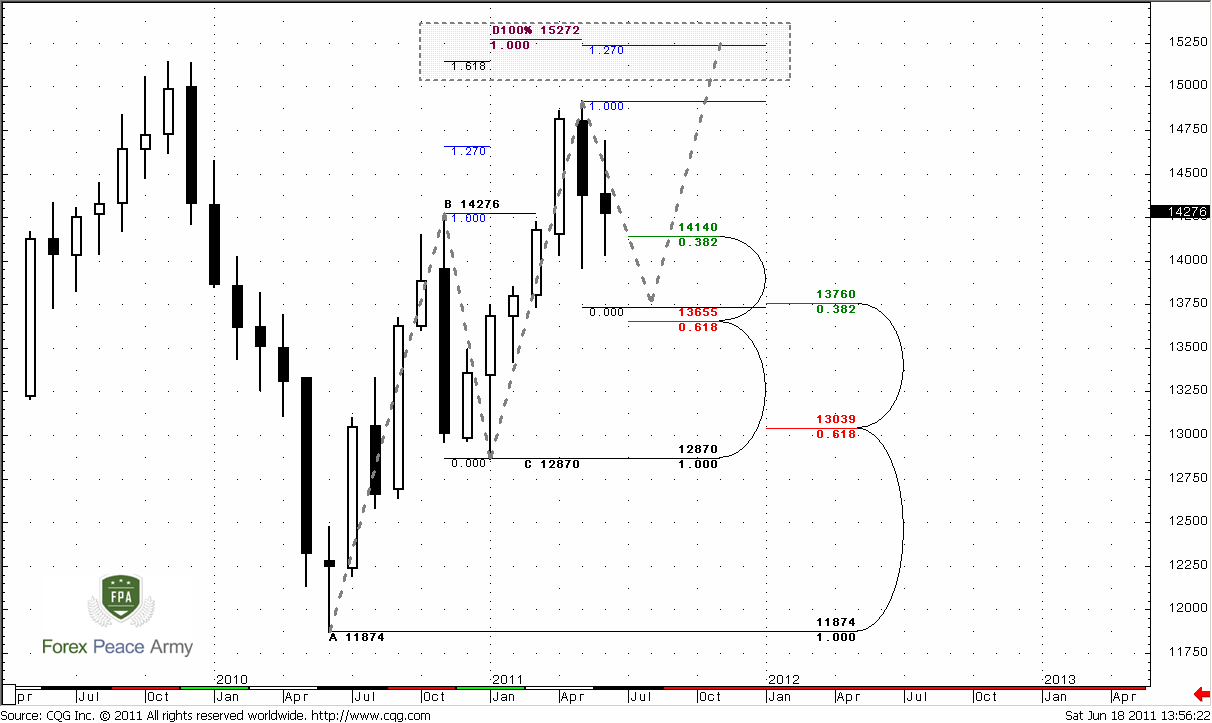
See – for agreement of 1.618 of first drive and 1.27 of second drive market should show retracement to 1.37 before acceleration to 1.52. Let’s see, what lower time frames tell us.
Weekly
Weekly trend is bearish. Major pattern that is in action currently is a bearish stop grabber. Its potential target is 1.3963 low. But if market will reach it – it will cancel daily butterfly “Sell”, so I will not be surprised by move to 1.37 area. Still, nearest Confluence support at 1.40-1.4040 holds, we can see that market has bounced from it once already, now is returning right back. By the way, 1.40 is a previous highs also. The way how market will behave in medium term tells us will we see move to 1.37 or not.
By now we still have a lot of bearish signs:
1. Initial huge bearish engulfing still valid;
2. Trend holds bearish;
3. We’ve got next bearish engulfing;
4. We’ve got stop grabber pattern
Stop grabber is particularly important, because it points us the target – usually this pattern leads to taking out of previous lows, i.e. 1.3963. “Take out” means move lower than that level. If we take a look at the chart, then we will see that just below this level stands weekly Confluence support 1.3655-1.3760, that is also an Agreement with 1.3733 AB=CD target. Combination of new bearish engulfing, stop grabber and bear trend probably tells that we’ll see 1.37. Although that anything could happen, common sense does not show me any other scenarios. Or, rather there is a variant of upward move, but now it looks shy.
Think about harmony between time frames. Monthly chart tells, that market has to reach 1.37 so that 3-Drive pattern will become perfect and it’s target 1.52. Monthly AB=CD also points at the same area. Weekly chart shows stop grabber and Agreement precisely at 1.37.
Daily
Trend is bearish, market neither oversold nor overbought. Currently we see solid bearish bias on this time frame. Potential target of current move is 1.37-1.38 area – two different AB=CD’s and potential of Butterfly “Buy”. If you’re a positional trader, then 1 .37 area is the one that you should keep an eye on.
In general, recent price action indirectly confirms bearish mood of the market. Move down develops logically, retracements hold around 0.618 resistance levels. Currently, I do not see any bullish signs, so I suppose we have only one direction in which to search a possibility for entering – down.
Still, as we’ve said in Fundamental part, current market will be traded by news mostly. That forces us to be extra careful.
4-hour
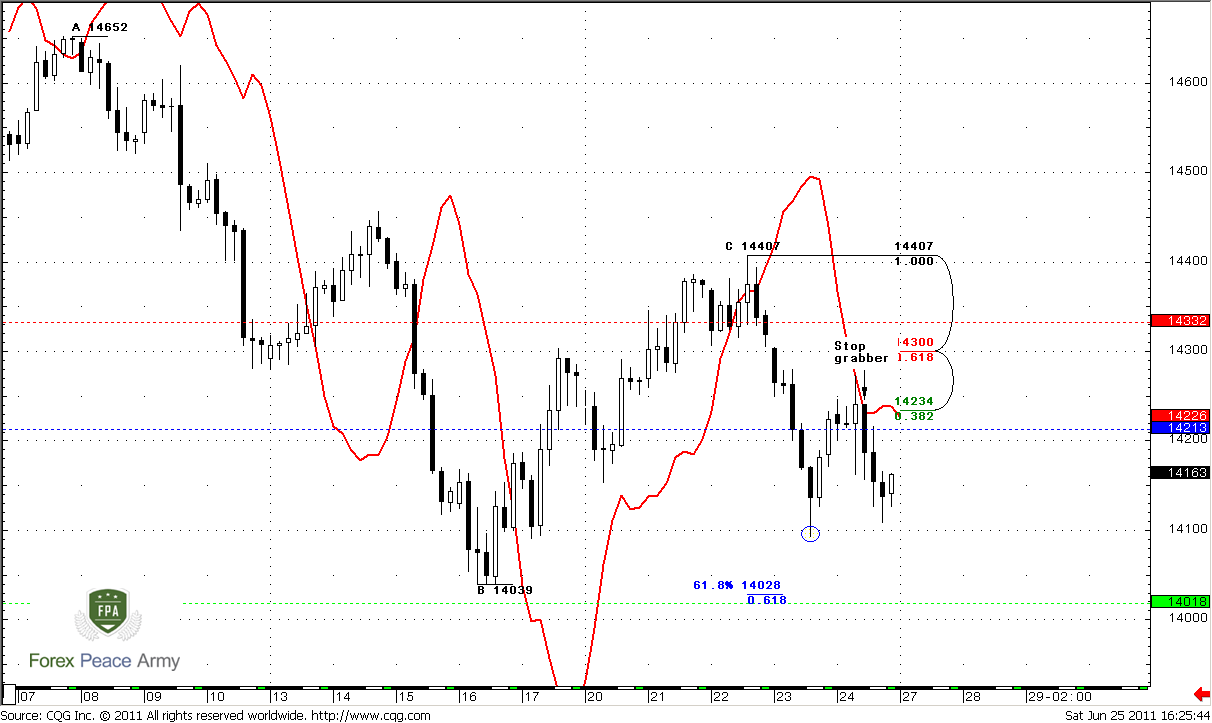
Trend is also bearish. Nearest target, that could be reached on Monday is 1.4020 – 0.618 target of AB=CD and weekly pivot support 1. That scenario agrees with stop-grabber on 4-hour chart, market should take out lows in blue circle on the chart.
Just above the market we see pivot at 1.4213 and 3/8 Fib resistance. Red dash line is pivot resistance 1 at 1.4332. Our preferable way to possess ourselves on the short side of the market is to wait retracement to pivot point, but currently is difficult to say – will market retrace to pivot first and then move to 1.4020 or vice versa.
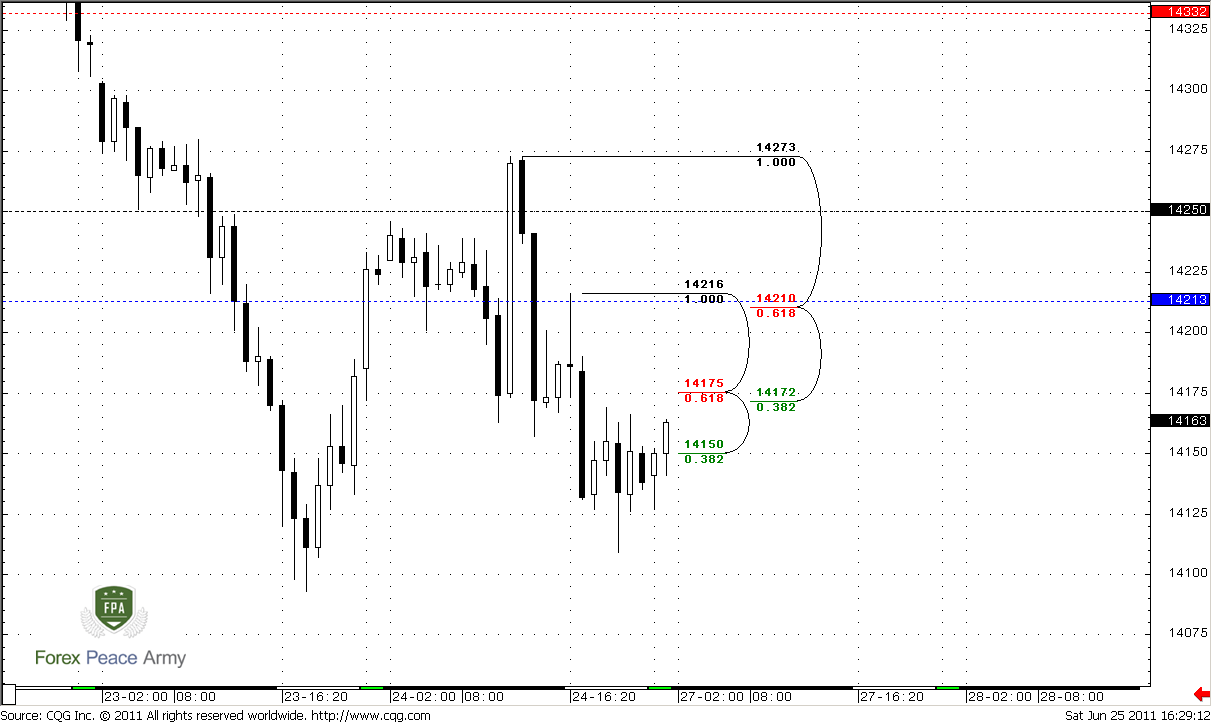
1-hour
Here we see some more details of last swing. 1.4172-1.4175 is Confluence resistance, 1.4210 – pivot + 5/8 Fib resistance. Since we have stop grabber on 4-hour chart, market is not at oversold, hence it should not show too deep retracement. That’s why, may be it makes some sense try to enter at 1.4175 with stop above 1.4250 or at least 1.4220 – this is one approach. Second way is more conservative – just wait till pivot point. As usual – this is compromise between two different ways. First way will give you more odds to be possessed for down move, while second way – more safe enter and tighter stop.
Conclusion:
Position traders:
Now move to 1.3650-1.37 looks more probable that week ago. Look for buy signals there.
Intraday and daily traders:
Nearest target is 1.4020 – market is not at oversold and there is no support levels below it (except 0.786 that was tested once already). 4-hour stop grabber gives us more confidence with down move. So, there are two levels that could be used to enter on the short side: Confluence at 1.4170 or 1.4213 – pivot point and 5/8 Fib resistance. It’s safer to wait the second one, but I also tell about the first, because in current environment, market could not reach the second, and also because that they are relatively close to each other.
The technical portion of Sive's analysis owes a great deal to Joe DiNapoli's methods, and uses a number of Joe's proprietary indicators. Please note that Sive's analysis is his own view of the market and is not endorsed by Joe DiNapoli or any related companies.
There is no need to be a prophet to say that situation on the markets remains tough. As a confirmation of that we can point on USD/CHF downward acceleration as strong increase in demand for franc has taken place. Franc, by the way shows greatest appreciation in value, compares to all other currencies. Second, take a look at the yield of short-term Swiss bonds and their correlation with EUR/CHF. Third, significant yield decrease in US Treasuries and its staying at the low levels also confirms worries among investors. So, let’s discuss major events and unexpected issues that could come in nearest future.
Looks like rally in CHF will continue until market will give some confidence of calming and coming stability. Early indication of that will be changing direction of Swiss notes, because this will tell that investors are ready to take some more risk. Until that will happen, CHF appreciation should continue. Besides, USD does not look currently like absolutely safe-haven currency due to debt lawmakers’ disagreement problems in US.
Let’s start from US. The major ghost is debt ceiling question. The point is that this problem has to be resolved not later than in the early August, because otherwise total debt, including accrued interest will reach limit and US formally will not be able to issue US Treasuries and have to only repay it. That currently leads to default, since US have no ability to do that. Still, most part of the market thinks that US will make a decision of increasing debt ceiling. Speaking about long-term perspective, take in mind that total debt of US is not just US Treasuries that is about 14 Trillion, but if we include different social programs (Medicare, Students, etc) that is about 100 Trillion USD. Second, to 2015 the value of official debt will reach 103% of US GDP, if Government will not take hard steps in reducing of Budget deficit. So, as you can see long-term perspective of USD is under question and rising of debt ceiling currently is just a half a measure – a technical step to calm down investors, but it does not change the foundation of the problem. During July I suggest, we should to keep an eye on Congress schedule meeting, especially on Budget committee.
Other events are relatively supporting for USD – Greece problems, threat of rate hike in China will resurrect old feelings of disdain for liquidity removal in times of softer economic numbers and, finally, flowing 60 mln Barrels of oil by IEA.
Speaking about EU, demand dominating for safe-haven will remain untouched. Although there could be some relief for EU on Wednesday, when vote on Greek austerity measures will take place, still more probable that trade will be driven by news as very often has happened during past few weeks. Note that inter-Parliament and populous resistance seems elevated. Unless there are positive headlines from the weekend suggesting progress euro could become weaker into the vote. Even if Greece passes the austerity package, second important moment is macro data on coming week from Germany – EU PMI and CPI. If there will be poor figures from the euro zone’s largest economy - this will take away support from the euro.
Monthly
EUR/USD comes in very crucial period of time and this is partially confirmed by technical analysis. Ahead of us should be decided such questions as QE II finish, Greece austerity measures and US debt ceiling. Any of these events could drastically affect future behavior of EUR/USD pair. You already see this nervous environment as on past week market action. One of our long-term scenarios is a move to 1.60 area. This could happen, for instance, due US technical default and rating downgrading to AA, or, otherwise, due super positive Greece problems decision. I’m telling all this stuff just to tune you on expectation of unexpected and be prepared to any scenario that just a couple of month ago have seemed as impossible. Don’t be deceived by summer period, when markets usually turn to calm and soft action.
As we’ve appointed previously that the major task for us – to estimate will we see deeper AB-CD retracement to 1.37 level or market will continue move higher. Currently this possibility comes on first stage and becomes more and more probable.
During the past two months market has shown retracement till nearest 3/8 Fib support at 1.4140 that stands very close to previous highs at 1.4276. Now it shows some bouncing from there. June as you can see now looks like inside trading month compares to May. Currently market shows second testing of 1.4140 area. As oftener market tests it as it becomes weaker. So, as we’ve said deeper AB=CD retracement now looks very probable.
Still to absolutely be sure with bearish bias we need close below 1.40. Downward possibility also implicitly confirms with market overbought. Usual retracement target during overbought is zero point of Detrended Oscillator and this level stands around monthly Confluence support. Also its worth to note here that trend will remain bullish, even if market will reach 1.37 area. Still, if market will hold on first Fib support, this will be much better for current bullish bias and Butterfly pattern.
Nearest target stands at 1.5272, but potentially it could turn to butterfly “Sell” pattern. The target of this pattern is 1.27 extension at 1.6024. Also it almost coincides with 1.27 target of recent bullish AB-CD at 1.5925.
Also take a note that overbought level for June stands at 1.5162 – right at previous highs 1.5144. Market should close above highs at 1.4925 to give us some confidence on bullish move continuation.
As an alternative scenario I want to show you a bit different picture. This scenario suggests possible reversal not at 1.60 but at 1.52 area. Also it suggests retracement to 1.37 monthly confluence support. This is 3-Drive “Sell”:
#2
See – for agreement of 1.618 of first drive and 1.27 of second drive market should show retracement to 1.37 before acceleration to 1.52. Let’s see, what lower time frames tell us.
Weekly
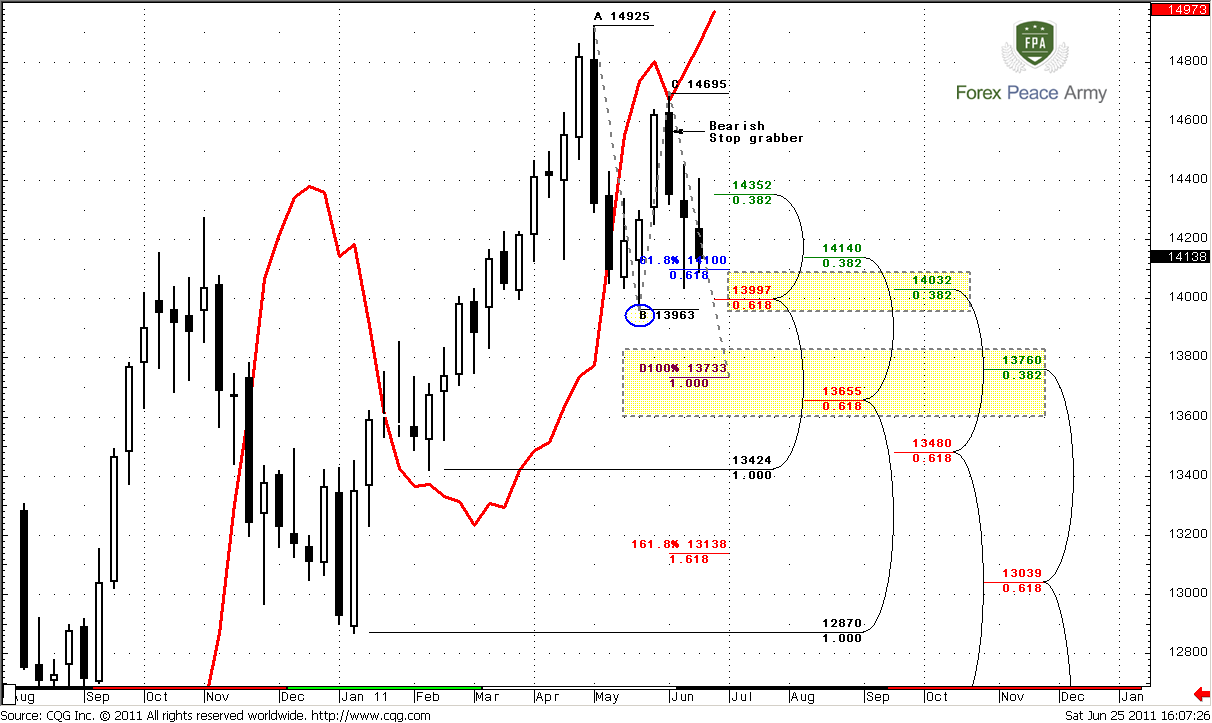
Weekly trend is bearish. Major pattern that is in action currently is a bearish stop grabber. Its potential target is 1.3963 low. But if market will reach it – it will cancel daily butterfly “Sell”, so I will not be surprised by move to 1.37 area. Still, nearest Confluence support at 1.40-1.4040 holds, we can see that market has bounced from it once already, now is returning right back. By the way, 1.40 is a previous highs also. The way how market will behave in medium term tells us will we see move to 1.37 or not.
By now we still have a lot of bearish signs:
1. Initial huge bearish engulfing still valid;
2. Trend holds bearish;
3. We’ve got next bearish engulfing;
4. We’ve got stop grabber pattern
Stop grabber is particularly important, because it points us the target – usually this pattern leads to taking out of previous lows, i.e. 1.3963. “Take out” means move lower than that level. If we take a look at the chart, then we will see that just below this level stands weekly Confluence support 1.3655-1.3760, that is also an Agreement with 1.3733 AB=CD target. Combination of new bearish engulfing, stop grabber and bear trend probably tells that we’ll see 1.37. Although that anything could happen, common sense does not show me any other scenarios. Or, rather there is a variant of upward move, but now it looks shy.
Think about harmony between time frames. Monthly chart tells, that market has to reach 1.37 so that 3-Drive pattern will become perfect and it’s target 1.52. Monthly AB=CD also points at the same area. Weekly chart shows stop grabber and Agreement precisely at 1.37.
Daily
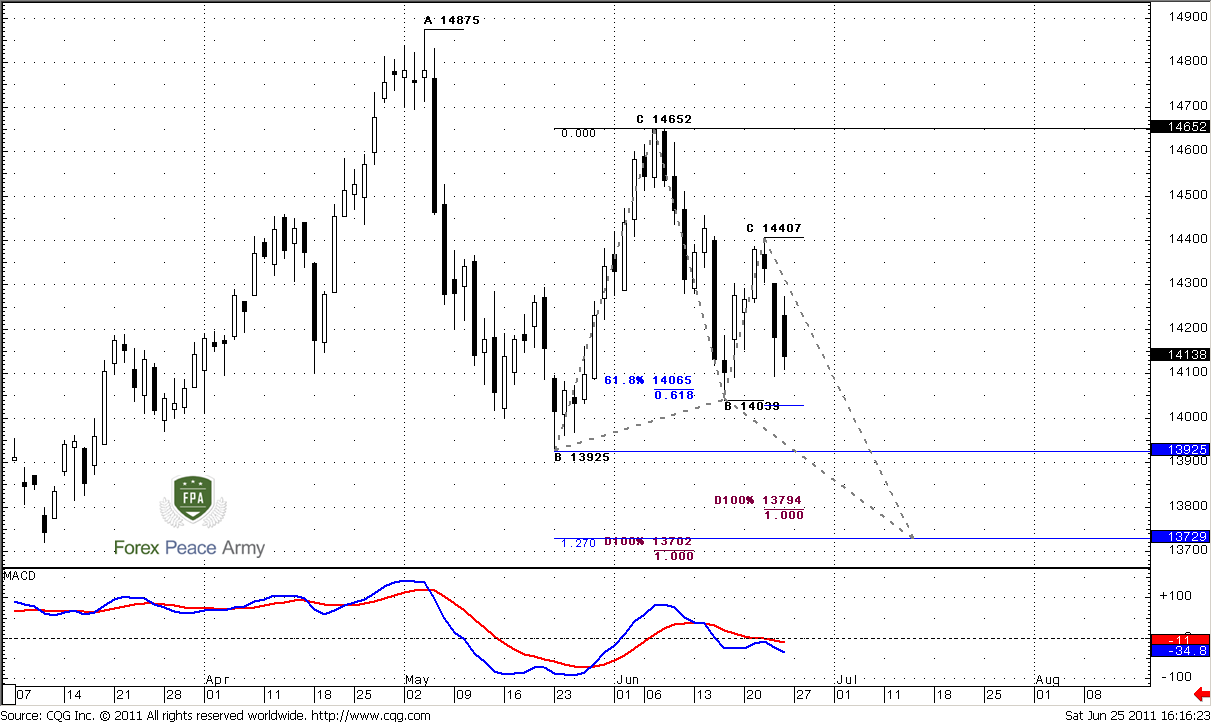
Trend is bearish, market neither oversold nor overbought. Currently we see solid bearish bias on this time frame. Potential target of current move is 1.37-1.38 area – two different AB=CD’s and potential of Butterfly “Buy”. If you’re a positional trader, then 1 .37 area is the one that you should keep an eye on.
In general, recent price action indirectly confirms bearish mood of the market. Move down develops logically, retracements hold around 0.618 resistance levels. Currently, I do not see any bullish signs, so I suppose we have only one direction in which to search a possibility for entering – down.
Still, as we’ve said in Fundamental part, current market will be traded by news mostly. That forces us to be extra careful.
4-hour
Trend is also bearish. Nearest target, that could be reached on Monday is 1.4020 – 0.618 target of AB=CD and weekly pivot support 1. That scenario agrees with stop-grabber on 4-hour chart, market should take out lows in blue circle on the chart.
Just above the market we see pivot at 1.4213 and 3/8 Fib resistance. Red dash line is pivot resistance 1 at 1.4332. Our preferable way to possess ourselves on the short side of the market is to wait retracement to pivot point, but currently is difficult to say – will market retrace to pivot first and then move to 1.4020 or vice versa.
1-hour
Here we see some more details of last swing. 1.4172-1.4175 is Confluence resistance, 1.4210 – pivot + 5/8 Fib resistance. Since we have stop grabber on 4-hour chart, market is not at oversold, hence it should not show too deep retracement. That’s why, may be it makes some sense try to enter at 1.4175 with stop above 1.4250 or at least 1.4220 – this is one approach. Second way is more conservative – just wait till pivot point. As usual – this is compromise between two different ways. First way will give you more odds to be possessed for down move, while second way – more safe enter and tighter stop.
Conclusion:
Position traders:
Now move to 1.3650-1.37 looks more probable that week ago. Look for buy signals there.
Intraday and daily traders:
Nearest target is 1.4020 – market is not at oversold and there is no support levels below it (except 0.786 that was tested once already). 4-hour stop grabber gives us more confidence with down move. So, there are two levels that could be used to enter on the short side: Confluence at 1.4170 or 1.4213 – pivot point and 5/8 Fib resistance. It’s safer to wait the second one, but I also tell about the first, because in current environment, market could not reach the second, and also because that they are relatively close to each other.
The technical portion of Sive's analysis owes a great deal to Joe DiNapoli's methods, and uses a number of Joe's proprietary indicators. Please note that Sive's analysis is his own view of the market and is not endorsed by Joe DiNapoli or any related companies.
") *****
*****