Sive Morten
Special Consultant to the FPA
- Messages
- 18,644
Monthly
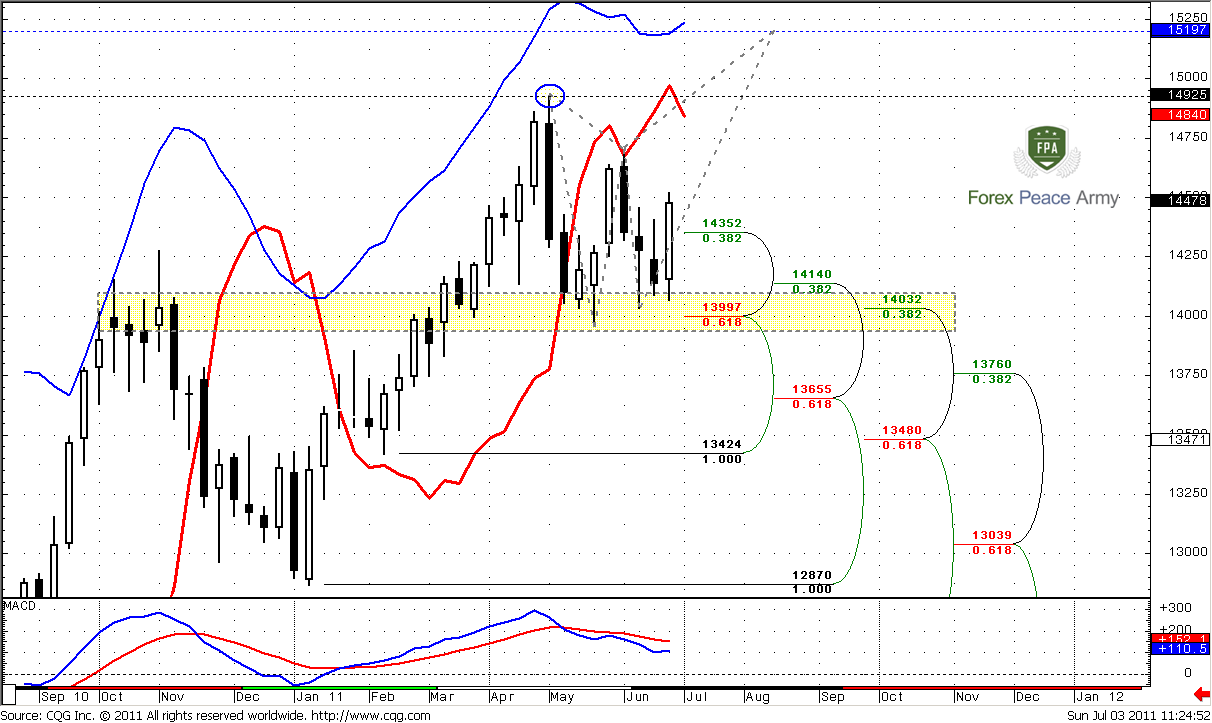
Trend holds bullish, there are no many changes on monthly chart. As you know, we have two major scenarios. The first one is a move to 1.60 area, the second – deeper AB-CD retracement to 1.37
During the past two months market has shown retracement till nearest 3/8 Fib support at 1.4140 that stands very close to previous highs at 1.4276. Now it shows some bouncing from there. June month has become an inside one, as three past months in general stand in limited range. Current price action makes me think, that the probability of further move down becomes weaker. Think by yourself, market has hit monthly overbought, 0.88 Fib resistance, and after all it just has reached nearest Fib support at 1.4140 and stands there currently. This is not very typical for situations when market really intends to move lower. Forming inside month tells us that market now stands indecision or building energy. So, it looks like the downward power is not so great, at least currently Nearest target stands at 1.5272, but potentially it could turn to butterfly “Sell” pattern. The target of this pattern is 1.27 extension at 1.6027. Also it almost coincides with 1.27 target of recent bullish AB-CD at 1.5925.
Speaking about bearish bias we need close below 1.40. Downward possibility also implicitly confirms with market overbought. Usual retracement target during overbought is zero point of Detrended Oscillator and this level stands around monthly Confluence support. Also its worth to note here that trend will remain bullish, even if market will reach 1.37 area. Still, if market will hold on first Fib support, this will be much better for current bullish bias and Butterfly pattern.
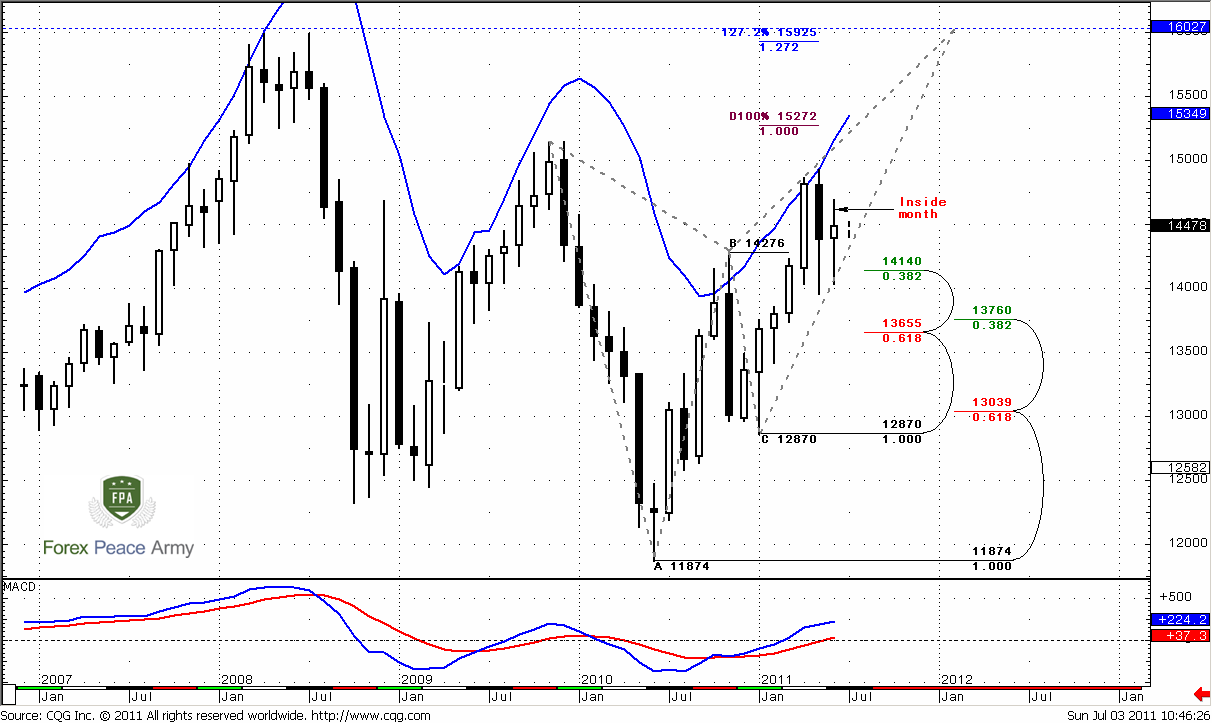
As an alternative scenario I want to show you a bit different picture. This scenario suggests possible reversal not at 1.60 but at 1.52 area. Also it suggests retracement to 1.37 monthly confluence support. This is 3-Drive “Sell”:
#2
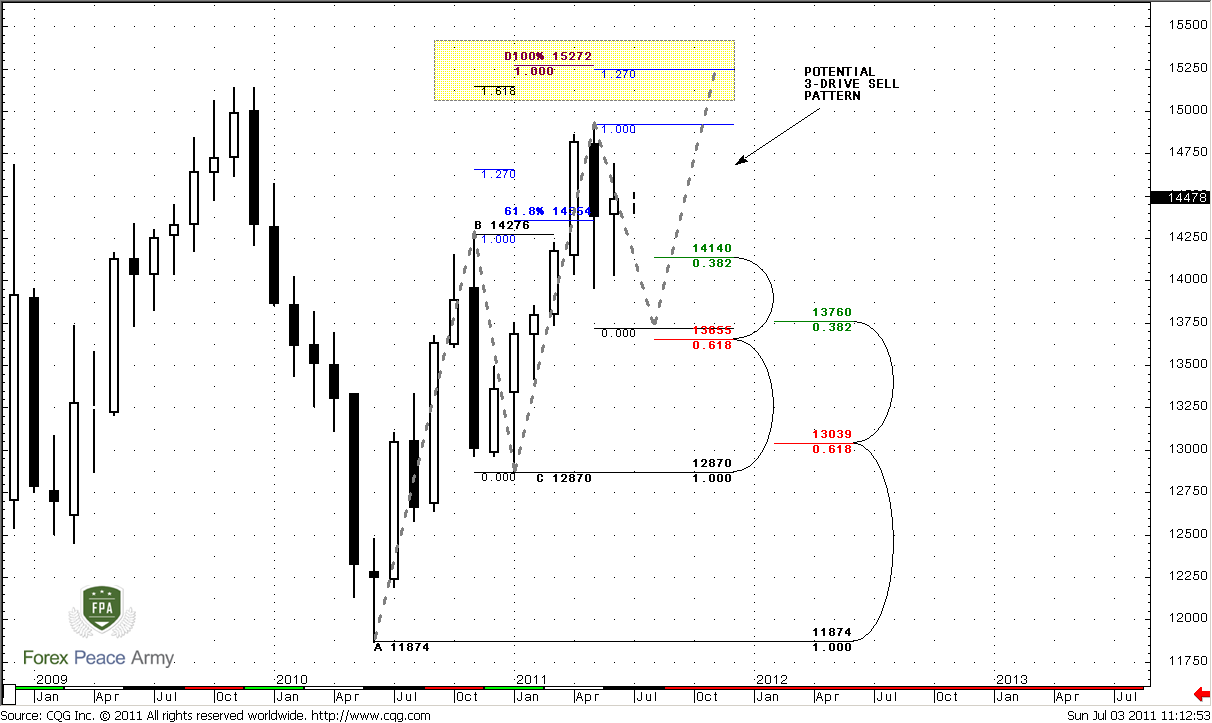
See – for agreement of 1.618 of first drive and 1.27 of second drive market should show retracement to 1.37 before acceleration to 1.52.
Weekly
It’s better if you re-read first weekly analysis for previous week. Trend is still bearish, but recent market price action makes me worry about near-term bearish perspectives on the market. And here is why. As we’ve estimated in monthly part of research, forming of inside month and standing at nearest Fib support after overbought is not very typical. Now look at weekly chart – market has hit 1.40 support once. I do not doubt the strength of support – this is weekly Confluence and previous highs, but during second touch market was not able to show lower lows, although we have stop grabber. Second, market just hit 0.618 target of downward AB-CD and now we see strong pullback from that area. Third, although market holds bearish, price action reminds triangle consolidation and does not support that.
This kind of price action is very typical for last bullish gasp Butterfly “Sell” (or may be even not for last gasp), with 1.52 target – the same target as AB-CD and 3-Drive on monthly and weekly oversold. And this scenario starts to seem more and more probable.
Still, we can’t just shake off and idea of down move because pretty harmony here is also exists. If we take a look at the chart, then we will see that just below this level stands weekly Confluence support 1.3655-1.3760, that is also an Agreement with 1.3733 AB=CD target. Monthly chart does not exclude, that market could reach it.
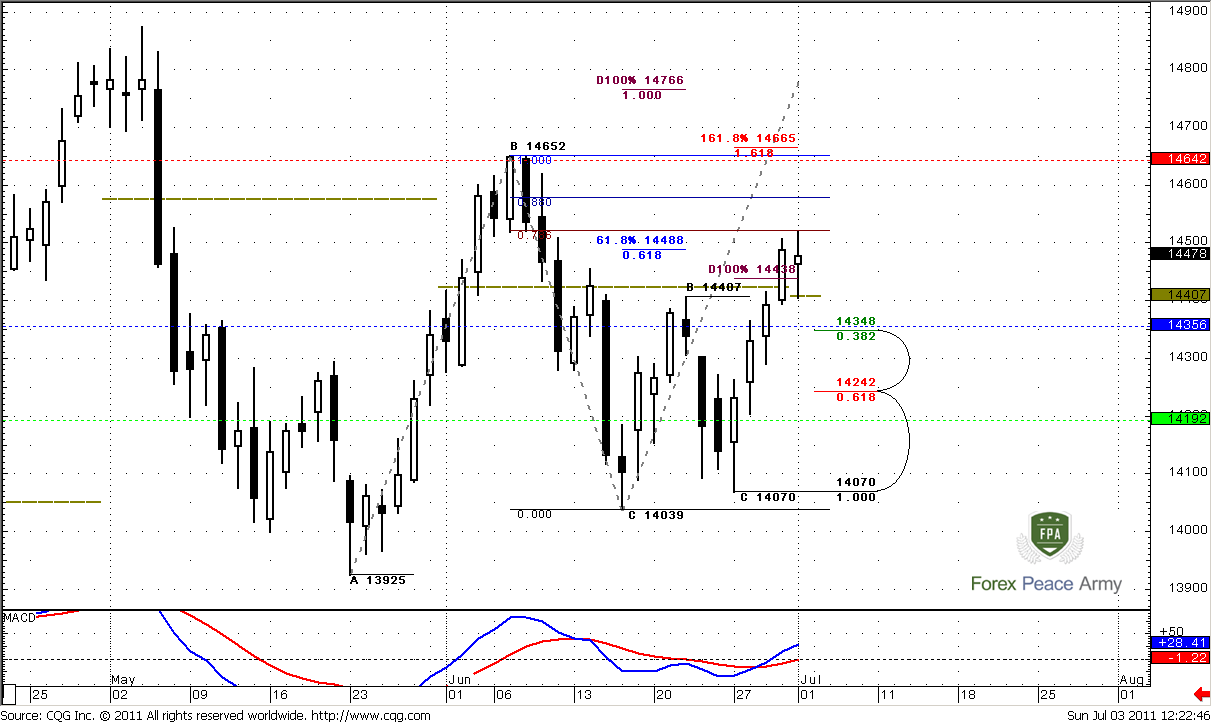
Daily
Current environment on daily time frame is rather sophisticated. If you will apply your vision you easily can find couple of butterflies and 3 AB-CD patterns with different terms and duration – treat it as your homework. When market relatively often changes direction it’s better to make a trading plan just for nearest time 1-2 days, do not build an air castles and long-term targets. That’s why in such circumstances is better to act as simple as possible.
Let’s start from what we do know. Trend is bullish, market is above monthly pivot, although weekly pivot for coming week is below close price at 1.4356. Market has hit 0.618 target of greater upward AB=CD and 0.786 Fib resistance and formed high wave. This is a sign of indecision. Although market is not at overbought, we can count on pullback, but it should not be too deep. Nearest fib support is 1.4348. So, what kind of conclusion could we make? Direction is – up, but there is a signs that market could turn to retracement. Nearest area to watch for – agreement of pivot point and nearest Fib support at 1.4350.
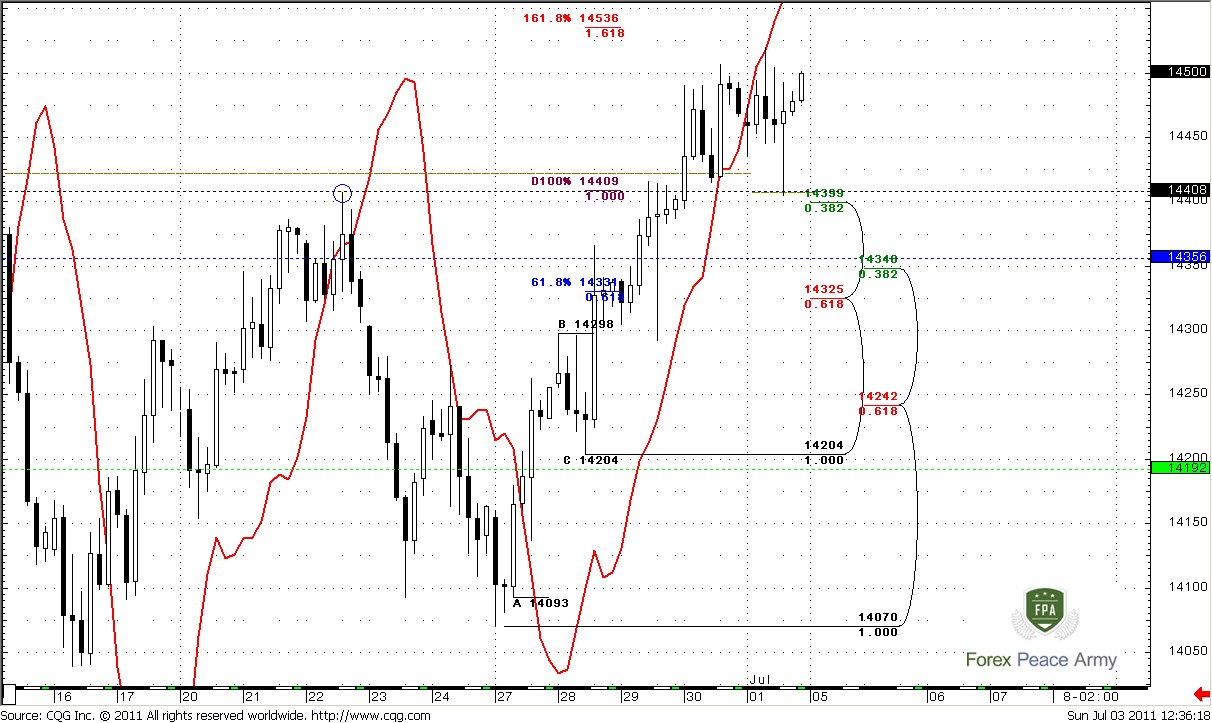
4-hour
Trend has turned bearish, but price action is not. Here we see smaller AB=CD pattern. The fact that market solidly holds above 1.0 extension target and does not move lower tells that market should hit 1.4536 target. Also here we can see, that 1.44-1.4410 is previous high, monthly pivot and 1.0 target. 1.4325-1.4356 – Confluence support and weekly pivot point. Market could show retracement to any of those areas, but for bullish bias it should not break it.
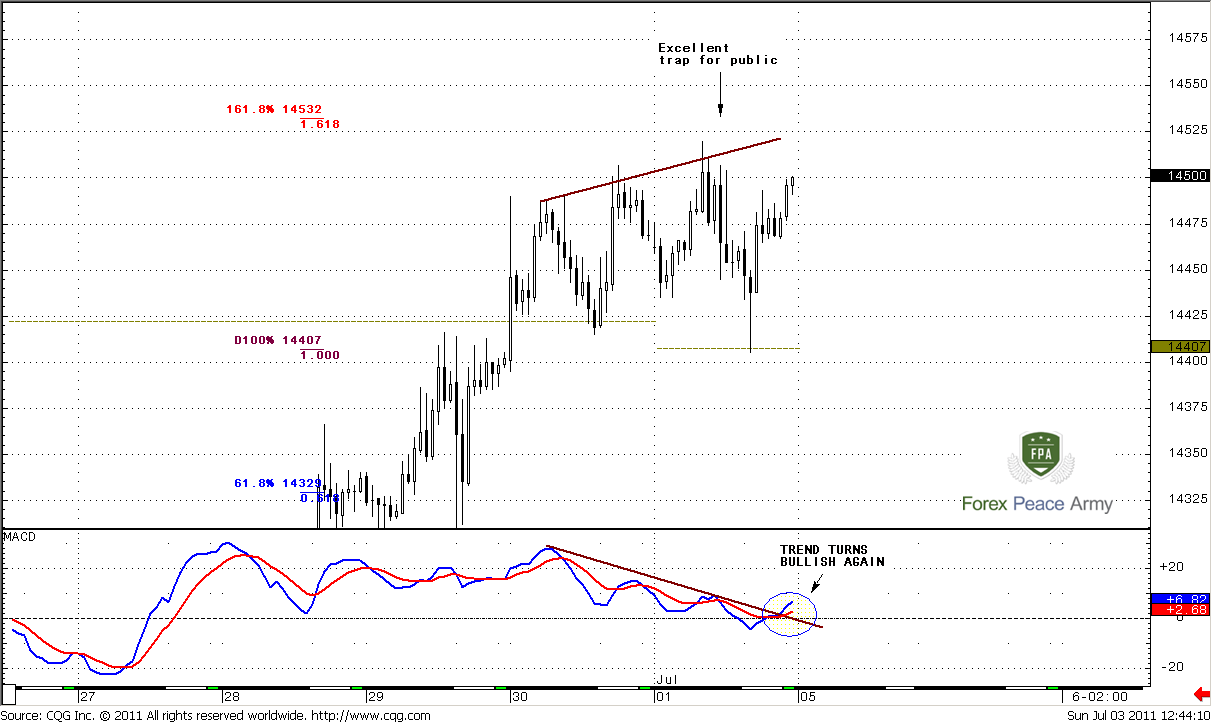
1-hour
Trend has reestablished on bullish side. This time frame gives us additional details. Here you can see perfect example, why it is dangerous to rely on Divergences alone. This situation gives me even more confidence that market could jump up to 1.4530-1.4550 area before retracement will really start. So, we have divergence and public already has entered short, besides someone already has been stopped-out once already, if he/she has entered on second or third top. Stops have been placed by public just above the highs. 1.618 target stands right above their stops. The rest of this idea you can bethink yourself.
So, if you’re bearish and intend to short this potential retracement to 1.4350 – place stops above 1.618 target.
Conclusion:
Position traders:
Markets start to show sign of strength. Now perspectives to reach 1.37 are not so strong.
Intraday and daily traders:
1. Wait when market will hit 1.618 target around 1.4530-1.4550
2. Retracement should take place, but not deeper than 1.4330-1.4360. It could even stop at 1.44. Since it has not even started it’s difficult to say currently what level it could reach. Keep an eye on the way how it will develop.
3. Hence couple of trading possibilities – if you’re bearish, you can take a risk and try to short move to 1.44 or 1.4350. But this will be counter daily trend trade, so be careful and don’t be surprise if you will catch a loss;
4. If you’re bullish, wait when retracement will end and then try to enter long.
Track for daily updates in this thread, together we will keep an eye on development of situation.
The technical portion of Sive's analysis owes a great deal to Joe DiNapoli's methods, and uses a number of Joe's proprietary indicators. Please note that Sive's analysis is his own view of the market and is not endorsed by Joe DiNapoli or any related companies.
Trend holds bullish, there are no many changes on monthly chart. As you know, we have two major scenarios. The first one is a move to 1.60 area, the second – deeper AB-CD retracement to 1.37
During the past two months market has shown retracement till nearest 3/8 Fib support at 1.4140 that stands very close to previous highs at 1.4276. Now it shows some bouncing from there. June month has become an inside one, as three past months in general stand in limited range. Current price action makes me think, that the probability of further move down becomes weaker. Think by yourself, market has hit monthly overbought, 0.88 Fib resistance, and after all it just has reached nearest Fib support at 1.4140 and stands there currently. This is not very typical for situations when market really intends to move lower. Forming inside month tells us that market now stands indecision or building energy. So, it looks like the downward power is not so great, at least currently Nearest target stands at 1.5272, but potentially it could turn to butterfly “Sell” pattern. The target of this pattern is 1.27 extension at 1.6027. Also it almost coincides with 1.27 target of recent bullish AB-CD at 1.5925.
Speaking about bearish bias we need close below 1.40. Downward possibility also implicitly confirms with market overbought. Usual retracement target during overbought is zero point of Detrended Oscillator and this level stands around monthly Confluence support. Also its worth to note here that trend will remain bullish, even if market will reach 1.37 area. Still, if market will hold on first Fib support, this will be much better for current bullish bias and Butterfly pattern.
As an alternative scenario I want to show you a bit different picture. This scenario suggests possible reversal not at 1.60 but at 1.52 area. Also it suggests retracement to 1.37 monthly confluence support. This is 3-Drive “Sell”:
#2
See – for agreement of 1.618 of first drive and 1.27 of second drive market should show retracement to 1.37 before acceleration to 1.52.
Weekly
It’s better if you re-read first weekly analysis for previous week. Trend is still bearish, but recent market price action makes me worry about near-term bearish perspectives on the market. And here is why. As we’ve estimated in monthly part of research, forming of inside month and standing at nearest Fib support after overbought is not very typical. Now look at weekly chart – market has hit 1.40 support once. I do not doubt the strength of support – this is weekly Confluence and previous highs, but during second touch market was not able to show lower lows, although we have stop grabber. Second, market just hit 0.618 target of downward AB-CD and now we see strong pullback from that area. Third, although market holds bearish, price action reminds triangle consolidation and does not support that.
This kind of price action is very typical for last bullish gasp Butterfly “Sell” (or may be even not for last gasp), with 1.52 target – the same target as AB-CD and 3-Drive on monthly and weekly oversold. And this scenario starts to seem more and more probable.
Still, we can’t just shake off and idea of down move because pretty harmony here is also exists. If we take a look at the chart, then we will see that just below this level stands weekly Confluence support 1.3655-1.3760, that is also an Agreement with 1.3733 AB=CD target. Monthly chart does not exclude, that market could reach it.
Daily
Current environment on daily time frame is rather sophisticated. If you will apply your vision you easily can find couple of butterflies and 3 AB-CD patterns with different terms and duration – treat it as your homework. When market relatively often changes direction it’s better to make a trading plan just for nearest time 1-2 days, do not build an air castles and long-term targets. That’s why in such circumstances is better to act as simple as possible.
Let’s start from what we do know. Trend is bullish, market is above monthly pivot, although weekly pivot for coming week is below close price at 1.4356. Market has hit 0.618 target of greater upward AB=CD and 0.786 Fib resistance and formed high wave. This is a sign of indecision. Although market is not at overbought, we can count on pullback, but it should not be too deep. Nearest fib support is 1.4348. So, what kind of conclusion could we make? Direction is – up, but there is a signs that market could turn to retracement. Nearest area to watch for – agreement of pivot point and nearest Fib support at 1.4350.
4-hour
Trend has turned bearish, but price action is not. Here we see smaller AB=CD pattern. The fact that market solidly holds above 1.0 extension target and does not move lower tells that market should hit 1.4536 target. Also here we can see, that 1.44-1.4410 is previous high, monthly pivot and 1.0 target. 1.4325-1.4356 – Confluence support and weekly pivot point. Market could show retracement to any of those areas, but for bullish bias it should not break it.
1-hour
Trend has reestablished on bullish side. This time frame gives us additional details. Here you can see perfect example, why it is dangerous to rely on Divergences alone. This situation gives me even more confidence that market could jump up to 1.4530-1.4550 area before retracement will really start. So, we have divergence and public already has entered short, besides someone already has been stopped-out once already, if he/she has entered on second or third top. Stops have been placed by public just above the highs. 1.618 target stands right above their stops. The rest of this idea you can bethink yourself.
So, if you’re bearish and intend to short this potential retracement to 1.4350 – place stops above 1.618 target.
Conclusion:
Position traders:
Markets start to show sign of strength. Now perspectives to reach 1.37 are not so strong.
Intraday and daily traders:
1. Wait when market will hit 1.618 target around 1.4530-1.4550
2. Retracement should take place, but not deeper than 1.4330-1.4360. It could even stop at 1.44. Since it has not even started it’s difficult to say currently what level it could reach. Keep an eye on the way how it will develop.
3. Hence couple of trading possibilities – if you’re bearish, you can take a risk and try to short move to 1.44 or 1.4350. But this will be counter daily trend trade, so be careful and don’t be surprise if you will catch a loss;
4. If you’re bullish, wait when retracement will end and then try to enter long.
Track for daily updates in this thread, together we will keep an eye on development of situation.
The technical portion of Sive's analysis owes a great deal to Joe DiNapoli's methods, and uses a number of Joe's proprietary indicators. Please note that Sive's analysis is his own view of the market and is not endorsed by Joe DiNapoli or any related companies.
Last edited: