Sive Morten
Special Consultant to the FPA
- Messages
- 18,639
Monthly
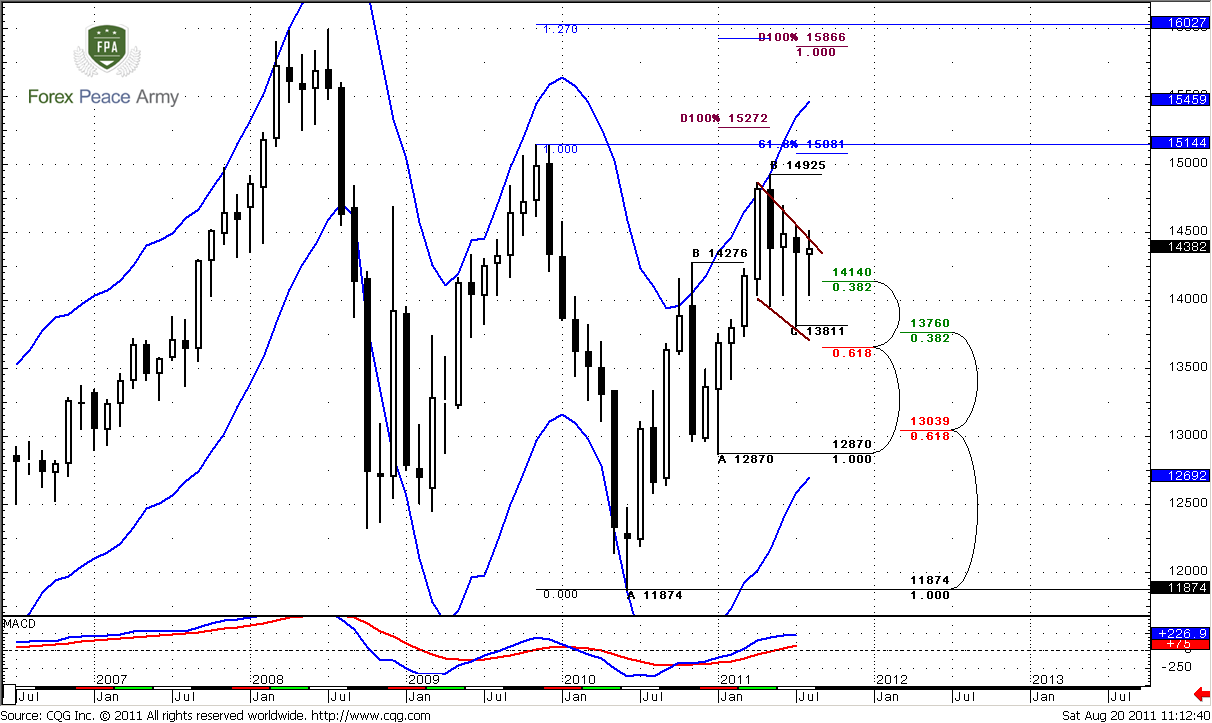
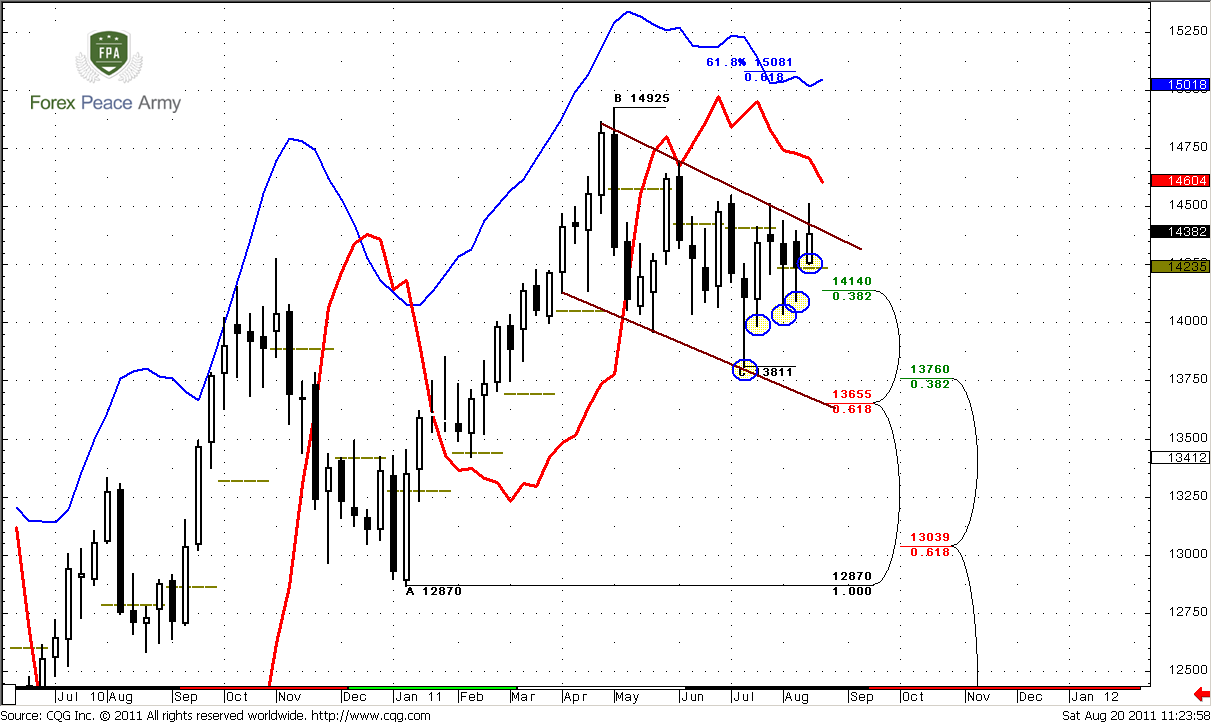
As we’ve said previously current trading environment on monthly time frame is a bright example of indecisive sentiment of market participants. Since as US as EU hit market with turmoil, traders just can’t decide which problems are worse. Trading range on monthly chart has contracted significantly, June was inside month and August has all chances to become inside one also.
Monthly trend remains bullish so as price action. Recent AB-CD pattern develops strictly as in book – market has hit 0.618 Fib extension target and monthly overbought and turned to retracement. But this retracement is very shallow – as it has to be. Market could not even reach Confluence support and holds above nearest Fib support 1.4140 - it looks more like W&R of previous lows on lower time frames. Furthermore, price action shows strong purchases by candles’ long tales during recent 4 months. Bullish pennant is forming currently here. Market has corrected overbought and reached the middle between the blue bands of oscillator predictor.
So, as we’ve said in previous research recent price action is not match to market that turns in reversal. It’s more common for continuation market. Although overall small signs, if we will take them together, tell that up move continuation is very probable, I better treat current price action as “indecision”. May be it looks like bullish pennant and so on, but this is not just retracement – inside months and choppy behavior on daily time frame tell that although investors are not ready to sell, but they are not sure that EUR is better either. I dare to suggest that when market will get any EUR supportive news or something – price will continue move higher.
Nearest target stands at 1.5081 – just above the previous highs – this is 0.618 extension from most recent AB-CD pattern. Next area to watch is 1.5272, but potentially it could turn to butterfly “Sell” pattern. The target of this pattern is 1.27 extension at 1.6027. Also it almost coincides with 1.27 target of bullish AB-CD at 1.5925 and with 1.0 Fib extension of most recent smaller AB-CD. By the way, from classical standpoint upward move should be equal to the mast of the pennant – that is 1.5866 area.
The crucial area for bullish perspectives is 1.3650 – down break of pennant and Confluence support will tell us that probably we can’t count on upward move in nearest time.
Weekly
Weekly trend holds bearish. First, I just want to remind you our suspicions that we’ve discussed in previous research. If we will take a look at overall picture then we’ll see that the nature of up move and current move is different. Current action is not thrust. It looks like retracement, and probably upward move could continue. Who knows, may be current pullback is just a respect of strong support, but market has not quite reach it (monthly Confluence support). That’s why it’s hardly so. I don’t know but currently personally for me this environment looks more bullish rather than bearish. Here are some reasons for that. First, we clear see bullish dynamic pressure here. Look, market holds bear trend, but price action does not support that, market does not accelerate lower. Second, from classical perspectives, we see that bullish wedge or flag is forming. This is a consolidation but not an impulse move. Hence, this is a retracement.
Also we can treat this recent price action as Gartley “222” “Buy”.
Take a look at recent price action – market is forming higher lows with bear trend, so that has happened during recent week also. This is a confirmation of dynamic pressure. Now we have to keep an eye on that – will this tendency continue or not. That’s important.
And finally, pay attention to monthly pivot point. Do you see something different with it? Right, August is a first month in current consolidation, when price holds above the pivot for three consecutive weeks, although it has tried to press it down.
Also if you switch on your imagination you can find Butterfly “sell” pattern that is forming currently here…
Speaking about the targets – nearest one is 1.5081 – 0.618 Fib extension from AB-CD pattern, that is also a weekly overbought. Although dynamic pressure minimum target is clearing out the highs at 1.4925 – there are a lot of stops just above it. So, since they will be triggered, market definitely will accelerate further. Second area of targets is 1.5250-1.5270 - monthly AB-CD target.
Daily
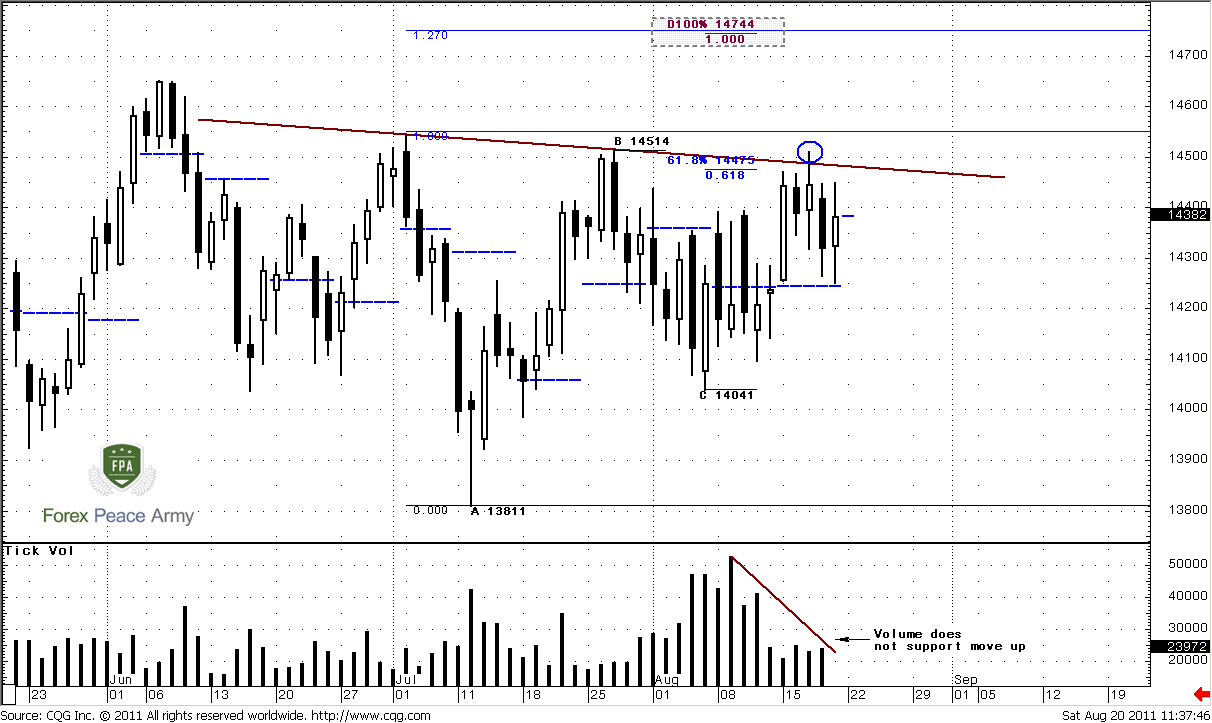
This time frame remains as most difficult for analysis on coming week also. Some worry signs continue to exist on the market. Our H&S pattern has to come to some resolving, since right shoulder time has expired – 18 days (left shoulder lasts for 17 days). It should come to some solid move sooner rather than later and as I said, I do not like this splash outside of neckline. Although it has not reached previous highs and that was not W&R, this is not very well for H&S pattern.
Trading volume does not support typical H&S behavior. Particularly, during right shoulder, when market moves up, trading volume should increase. Here we do not see it. It’s vice versa – trading volume decreases, when market has tried to move higher. Further more – just look at trading volume during previous week, it was anemic.
From another point of view – daily trend has turned bullish, and market has stand above pivot during whole week.
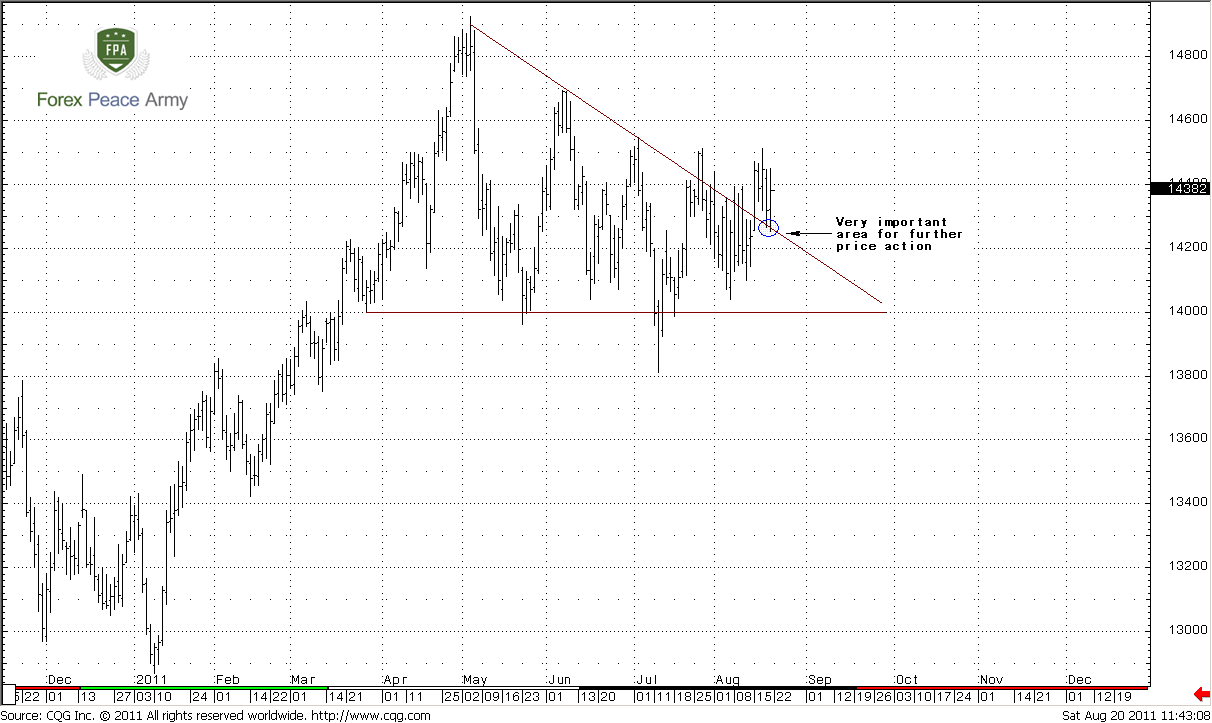
On second chart we see that triangle was broken to the upside, but it has happened too lazy and market has revisited the line from the other side. From that point of view, lows around 1.42 area are extremely important, since if market will return back in the body of triangle, this will be huge disadvantage for bulls.
Also, I suggest you to re-read previous research, because both daily scenarios with butterflies are still valid, since market has not reached crucial points and has not canceled any of them. As downward as upward butterfly still could materialize.
4-hour
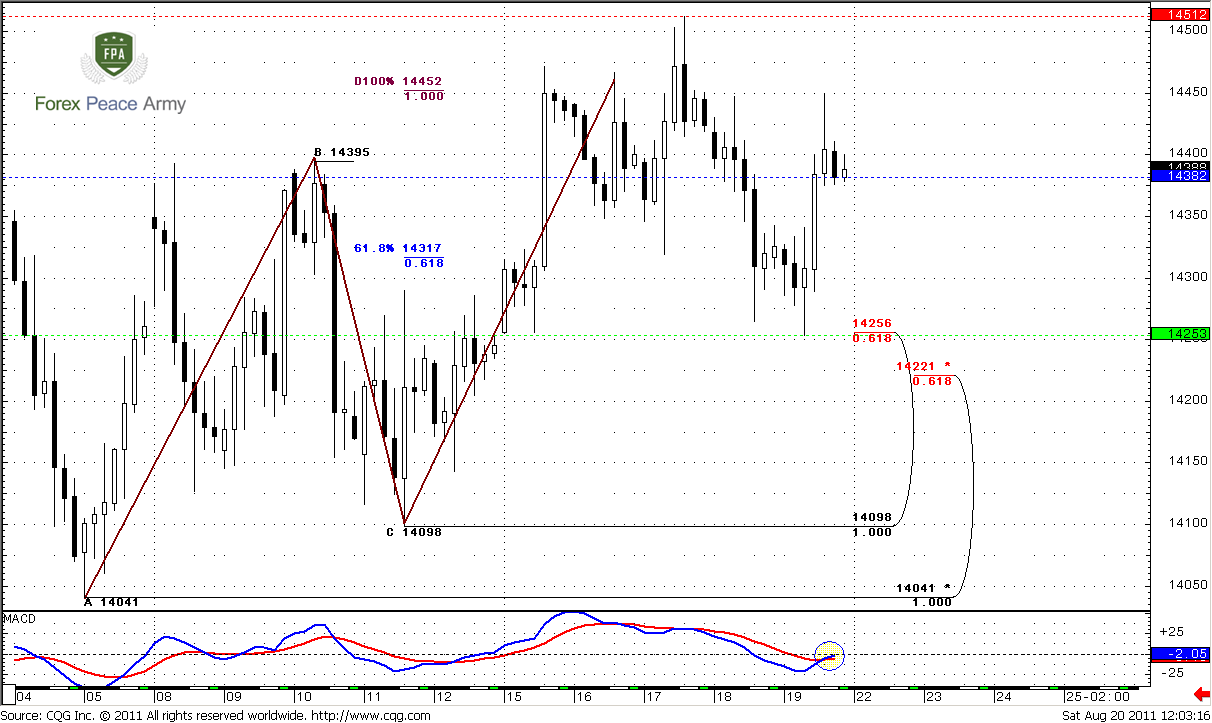
Trend has turned bullish with nice thrusting bar right from 0.618 Fib support. Here I do not see any clear patterns, just sideways consolidation after market has completed AB=CD pattern. Retracement to 0.618 level looks logical. The major question here could market hold this bull trend… The risky approach is to use recent swing up to try entering Long (look hourly chart), safe way – do nothing, wait for clear signals, since market could show downward AB-CD, who knows… Other words we have nothing but the trend – daily is bullish so as 4-hour. Pull the trigger based just on trend a bit risky, so decide by yourself to take this risk or not.
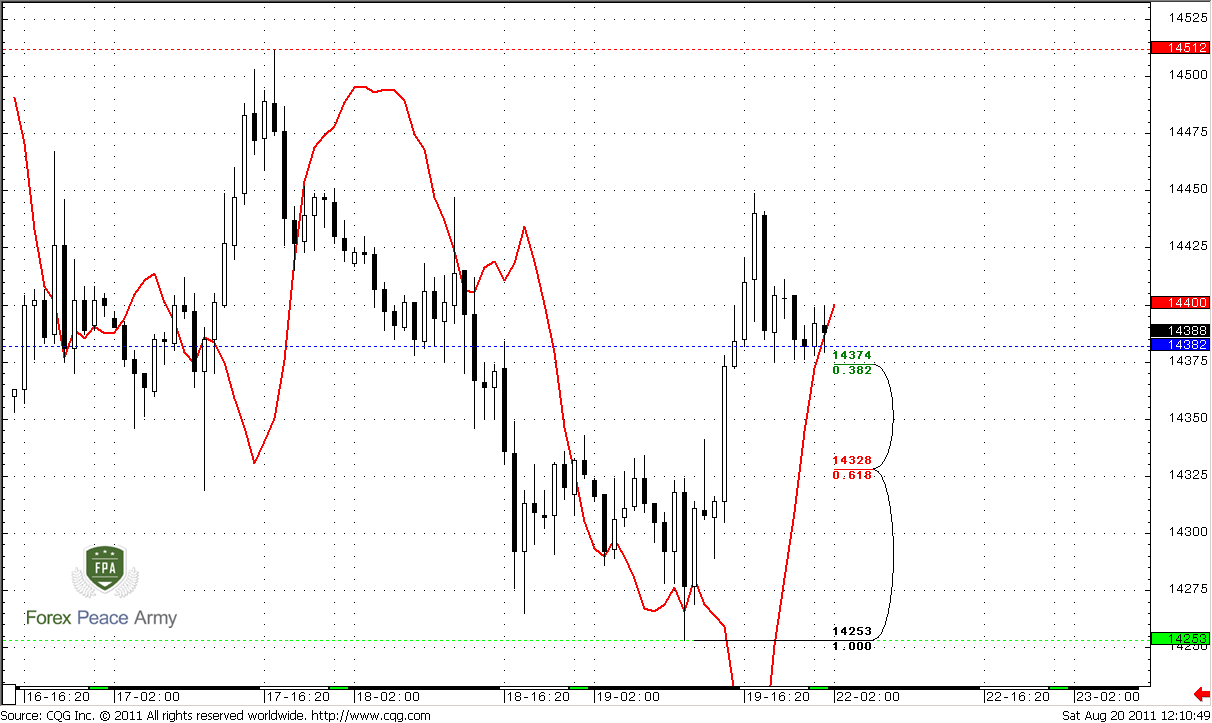
1-hour
Trend also has turned bullish. Market has reached nearest Fib support that is also a pivot for coming week at 1.4374-1.4382. Still we can’t exclude that market could show deeper AB-CD retracement. So, you may either drop your time frame to 5-min chart or try to catch particular buy patterns around support levels or enter here but hide your stop around 1.43 level, although this a bit expensive. That is only if you want to take part in this risky bullish trade.
Conclusion:
Market still stands indecision. Safe way to trade current market is to wait breakout of crucial areas – 1.4514 or 1.3811. So, currently the better approach is to trade intraday with scalp trade, for instance like those that we’ve appointed in hourly analysis.
Keep a close eye on possible market’s return back into triangle. This could turn everything.
The technical portion of Sive's analysis owes a great deal to Joe DiNapoli's methods, and uses a number of Joe's proprietary indicators. Please note that Sive's analysis is his own view of the market and is not endorsed by Joe DiNapoli or any related companies.
As we’ve said previously current trading environment on monthly time frame is a bright example of indecisive sentiment of market participants. Since as US as EU hit market with turmoil, traders just can’t decide which problems are worse. Trading range on monthly chart has contracted significantly, June was inside month and August has all chances to become inside one also.
Monthly trend remains bullish so as price action. Recent AB-CD pattern develops strictly as in book – market has hit 0.618 Fib extension target and monthly overbought and turned to retracement. But this retracement is very shallow – as it has to be. Market could not even reach Confluence support and holds above nearest Fib support 1.4140 - it looks more like W&R of previous lows on lower time frames. Furthermore, price action shows strong purchases by candles’ long tales during recent 4 months. Bullish pennant is forming currently here. Market has corrected overbought and reached the middle between the blue bands of oscillator predictor.
So, as we’ve said in previous research recent price action is not match to market that turns in reversal. It’s more common for continuation market. Although overall small signs, if we will take them together, tell that up move continuation is very probable, I better treat current price action as “indecision”. May be it looks like bullish pennant and so on, but this is not just retracement – inside months and choppy behavior on daily time frame tell that although investors are not ready to sell, but they are not sure that EUR is better either. I dare to suggest that when market will get any EUR supportive news or something – price will continue move higher.
Nearest target stands at 1.5081 – just above the previous highs – this is 0.618 extension from most recent AB-CD pattern. Next area to watch is 1.5272, but potentially it could turn to butterfly “Sell” pattern. The target of this pattern is 1.27 extension at 1.6027. Also it almost coincides with 1.27 target of bullish AB-CD at 1.5925 and with 1.0 Fib extension of most recent smaller AB-CD. By the way, from classical standpoint upward move should be equal to the mast of the pennant – that is 1.5866 area.
The crucial area for bullish perspectives is 1.3650 – down break of pennant and Confluence support will tell us that probably we can’t count on upward move in nearest time.
Weekly
Weekly trend holds bearish. First, I just want to remind you our suspicions that we’ve discussed in previous research. If we will take a look at overall picture then we’ll see that the nature of up move and current move is different. Current action is not thrust. It looks like retracement, and probably upward move could continue. Who knows, may be current pullback is just a respect of strong support, but market has not quite reach it (monthly Confluence support). That’s why it’s hardly so. I don’t know but currently personally for me this environment looks more bullish rather than bearish. Here are some reasons for that. First, we clear see bullish dynamic pressure here. Look, market holds bear trend, but price action does not support that, market does not accelerate lower. Second, from classical perspectives, we see that bullish wedge or flag is forming. This is a consolidation but not an impulse move. Hence, this is a retracement.
Also we can treat this recent price action as Gartley “222” “Buy”.
Take a look at recent price action – market is forming higher lows with bear trend, so that has happened during recent week also. This is a confirmation of dynamic pressure. Now we have to keep an eye on that – will this tendency continue or not. That’s important.
And finally, pay attention to monthly pivot point. Do you see something different with it? Right, August is a first month in current consolidation, when price holds above the pivot for three consecutive weeks, although it has tried to press it down.
Also if you switch on your imagination you can find Butterfly “sell” pattern that is forming currently here…
Speaking about the targets – nearest one is 1.5081 – 0.618 Fib extension from AB-CD pattern, that is also a weekly overbought. Although dynamic pressure minimum target is clearing out the highs at 1.4925 – there are a lot of stops just above it. So, since they will be triggered, market definitely will accelerate further. Second area of targets is 1.5250-1.5270 - monthly AB-CD target.
Daily
This time frame remains as most difficult for analysis on coming week also. Some worry signs continue to exist on the market. Our H&S pattern has to come to some resolving, since right shoulder time has expired – 18 days (left shoulder lasts for 17 days). It should come to some solid move sooner rather than later and as I said, I do not like this splash outside of neckline. Although it has not reached previous highs and that was not W&R, this is not very well for H&S pattern.
Trading volume does not support typical H&S behavior. Particularly, during right shoulder, when market moves up, trading volume should increase. Here we do not see it. It’s vice versa – trading volume decreases, when market has tried to move higher. Further more – just look at trading volume during previous week, it was anemic.
From another point of view – daily trend has turned bullish, and market has stand above pivot during whole week.
On second chart we see that triangle was broken to the upside, but it has happened too lazy and market has revisited the line from the other side. From that point of view, lows around 1.42 area are extremely important, since if market will return back in the body of triangle, this will be huge disadvantage for bulls.
Also, I suggest you to re-read previous research, because both daily scenarios with butterflies are still valid, since market has not reached crucial points and has not canceled any of them. As downward as upward butterfly still could materialize.
4-hour
Trend has turned bullish with nice thrusting bar right from 0.618 Fib support. Here I do not see any clear patterns, just sideways consolidation after market has completed AB=CD pattern. Retracement to 0.618 level looks logical. The major question here could market hold this bull trend… The risky approach is to use recent swing up to try entering Long (look hourly chart), safe way – do nothing, wait for clear signals, since market could show downward AB-CD, who knows… Other words we have nothing but the trend – daily is bullish so as 4-hour. Pull the trigger based just on trend a bit risky, so decide by yourself to take this risk or not.
1-hour
Trend also has turned bullish. Market has reached nearest Fib support that is also a pivot for coming week at 1.4374-1.4382. Still we can’t exclude that market could show deeper AB-CD retracement. So, you may either drop your time frame to 5-min chart or try to catch particular buy patterns around support levels or enter here but hide your stop around 1.43 level, although this a bit expensive. That is only if you want to take part in this risky bullish trade.
Conclusion:
Market still stands indecision. Safe way to trade current market is to wait breakout of crucial areas – 1.4514 or 1.3811. So, currently the better approach is to trade intraday with scalp trade, for instance like those that we’ve appointed in hourly analysis.
Keep a close eye on possible market’s return back into triangle. This could turn everything.
The technical portion of Sive's analysis owes a great deal to Joe DiNapoli's methods, and uses a number of Joe's proprietary indicators. Please note that Sive's analysis is his own view of the market and is not endorsed by Joe DiNapoli or any related companies.
") .
.