Sive Morten
Special Consultant to the FPA
- Messages
- 18,648
Monthly
As we’ve said previously current trading environment on monthly time frame is a bright example of indecisive sentiment of market participants. Since as US as EU hit market with turmoil, traders just can’t decide which problems are worse. Trading range on monthly chart has contracted significantly, June was inside month and August has all chances to become inside one also.
On Friday everybody has expected Bernanke speech in Jackson Hole, it has come, but it was blank – no information at all. The major conclusion is that Fed is trying to buy time. This tells us that on September 20th we have to be aware of some radical information from the Fed, and probably they will be bad for dollar. Otherwise, why to postpone some supportive and good news? The fact of postponing is already negative of USD. As with Congress decision about debt ceil, as now, when Fed can’t pronounce their program tells that they indecision and don’t know what to do. That makes investors nervous, since investors like stability and transparency - they like to see that economy stands in strong hands on government and central bank and those authorities do know what to do. Now we don’t see it.
Also I have long-term suspicion that something really bad could happen with dollar, somewhere around Nov 2012 – election time. $2 Trillion dollars of debt ceil increasing will be sufficient right till election time. It could turn that Fed will continue to buy time with uncertainty and to not take any significant steps. US will never be able to get out from debt pit, and increasing of debt ceil is just postponement of catastrophe. It will happen sooner rather than later, and since debt growth with geometric progression, it obvious that they can’t safe dollar strength and payout all debt. 14 trillion is just Government debt, surplus here healthcare program and other social programs and you come to approximately 50 Trillion. If we will decide just total government debt among all Americans, it turns that each citizen of US owes around 176 thousand dollars, including accrued interest. That’s really scared - U.S. National Debt Clock : Real Time
The strength of dollar now supports artificially. Additional confirmation to this is strength of Swiss franc and Japan Yen (even after tsunami), rally in precious metals. Try to recalculate oil prices in terms of gold and you’ll see that there is almost total absence of price fluctuation – no huge trends and collapses. It stands stable! Hence, the reason is in USD and its wastage. Before 1970 we had Dollar that was backed with gold and other currencies were backed by Dollar. Now (after 70s) we have Currencies that are backed with dollar, but dollar is backed with nothing.
I suspect, that US have some actuating levers, may be political, may be financial or both to weak EUR. All that panic with Greece, Ireland, Spain, Italy and now France has come from rating agencies. S&P is US company, and I can’t believe that they can’t use it for own purposes. That’s why currently it looks like all remain the same – EUR and USD stands in the same average levels. But in reality, USD has lost a lot of value. This is a bit long-term reasoning and arguments, but it’s better to remember about them and to assess any events from that standpoint also. If we will take a look at rate decreasing by S&P to AA+, it will come out with quite other colors – as a preparation of dollar abandoning policy and greatest fraud of all times. But enough horrors and let’s pass to technical picture.
It’s very difficult to say something new, especially when market stands in tight range during 2-3 weeks even in terms of daily time frame. So, weekly and monthly charts stand almost totally unchanged.
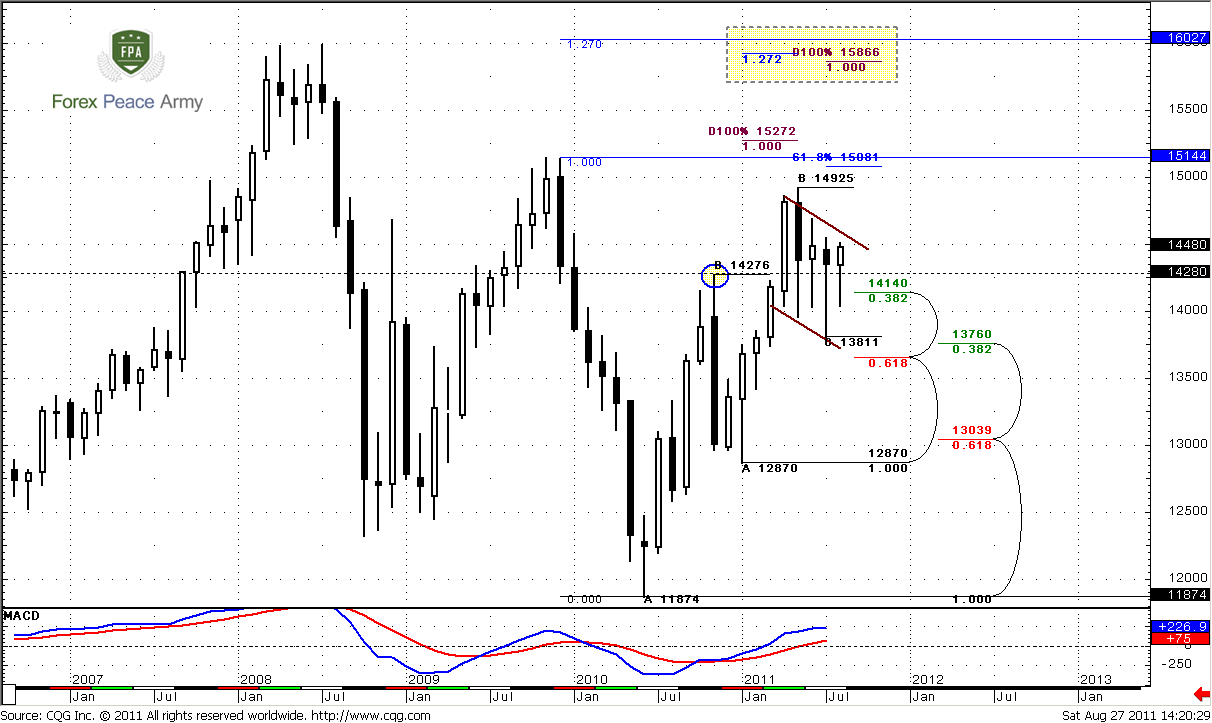
Monthly trend remains bullish so as price action. Recent AB-CD pattern develops strictly as in book – market has hit 0.618 Fib extension target and monthly overbought and turned to retracement. But this retracement is very shallow – as it has to be. Market could not even reach Confluence support and holds above nearest Fib support 1.4140. Also pay attention to previous highs at 1.4276 – although market has penetrated it, but could not close below that level for 4 month in a row. Furthermore, price action shows strong purchases by candles’ long tales during recent 4 months. Bullish pennant is forming currently here. Market has corrected overbought already. Since it has happened with flat price action but not with downward retracement – this is also a bullish sign.
So, as we’ve said in previous research recent price action is not match to market that turns in reversal. It’s more common for continuation market. Although overall small signs, if we will take them together, tell that up move continuation is very probable, I better treat current price action as “indecision”. May be it looks like bullish pennant and so on, but this is not just retracement – inside months and choppy behavior on daily time frame tell that although investors are not ready to sell, but they are not sure that EUR is better either. Mostly this is due uncertainty with USD.
Nearest target stands at 1.5081 – just above the previous highs – this is 0.618 extension from most recent AB-CD pattern. Next area to watch is 1.5272, but potentially it could turn to butterfly “Sell” pattern. The target of this pattern is 1.27 extension at 1.6027. Also it almost coincides with 1.27 target of bullish AB-CD at 1.5925 and with 1.0 Fib extension of most recent smaller AB-CD. By the way, from classical standpoint upward move should be equal to the mast of the pennant – that is 1.5866 area.
The crucial area for bullish perspectives is 1.3650 – down break of pennant and Confluence support will tell us that probably we can’t count on upward move in nearest time.
Weekly
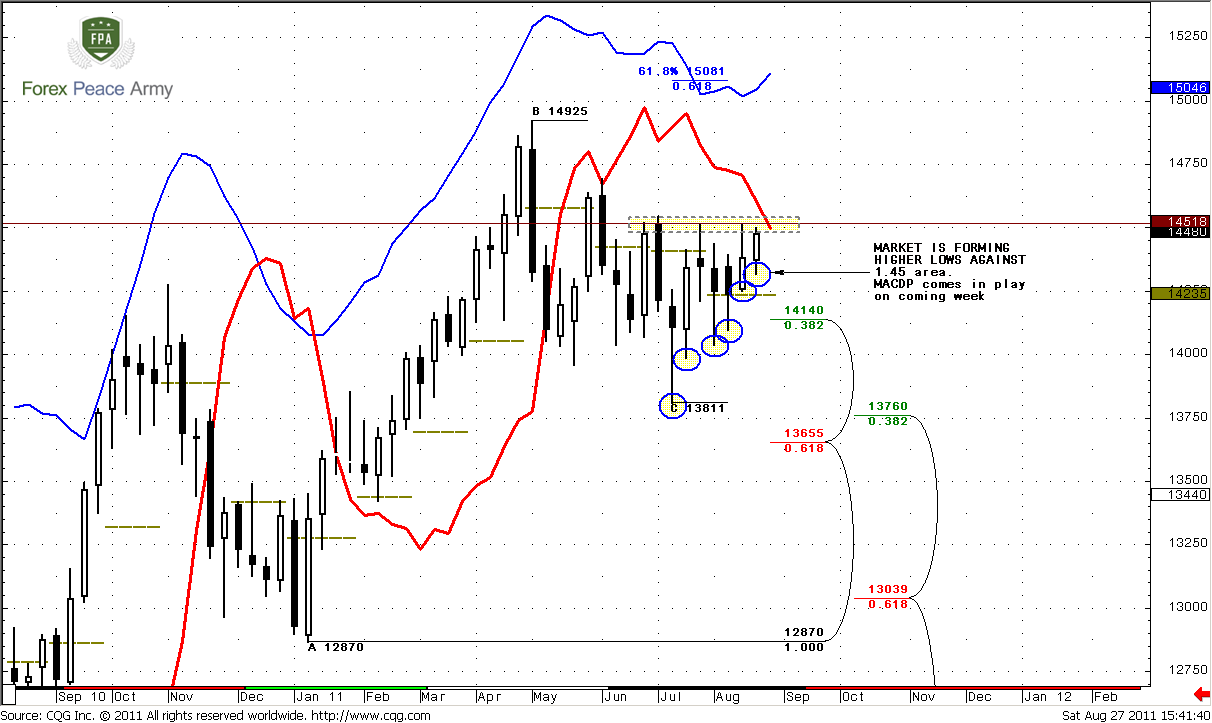
Weekly trend holds bearish. First, I just want to remind you our suspicions that we’ve discussed in previous research. If we will take a look at overall picture then we’ll see that the nature of up move and current move is different. Current action is not thrust. It looks like retracement, and probably upward move could continue. Who knows, may be current pullback is just a respect of strong support on monthly time frame, but market has not quite reach it (monthly Confluence support). That’s why it’s hardly so. I don’t know but currently personally for me this environment looks more bullish rather than bearish. Here are some reasons for that. First, we clear see bullish dynamic pressure here. Look, market holds bear trend, but price action does not support that, market does not accelerate lower. Second, from classical perspectives, we see that bullish wedge or flag is forming. This is a consolidation but not an impulse move. Hence, this is a retracement.
Also we can treat this recent price action as Gartley “222” “Buy”.
Take a look at recent price action – market is forming higher lows with bear trend, so that has happened during recent week also. This is a confirmation of dynamic pressure. Now we have to keep an eye on that – will this tendency continue or not. That’s important.
And finally, pay attention to monthly pivot point. Do you see something different with it? Right, August is a first month in current consolidation, when price holds above the pivot for whole month, although it has tried to press it down.
Pay attention that MACDP will come in play on coming week, trend could turn north – that’s important.
Speaking about the targets – nearest one is 1.5081 – 0.618 Fib extension from AB-CD pattern, that is also a weekly overbought. Although dynamic pressure minimum target is clearing out the highs at 1.4925 – there are a lot of stops just above it. So, since they will be triggered, market definitely will accelerate further. Second area of targets is 1.5250-1.5270 - monthly AB-CD target.
Daily
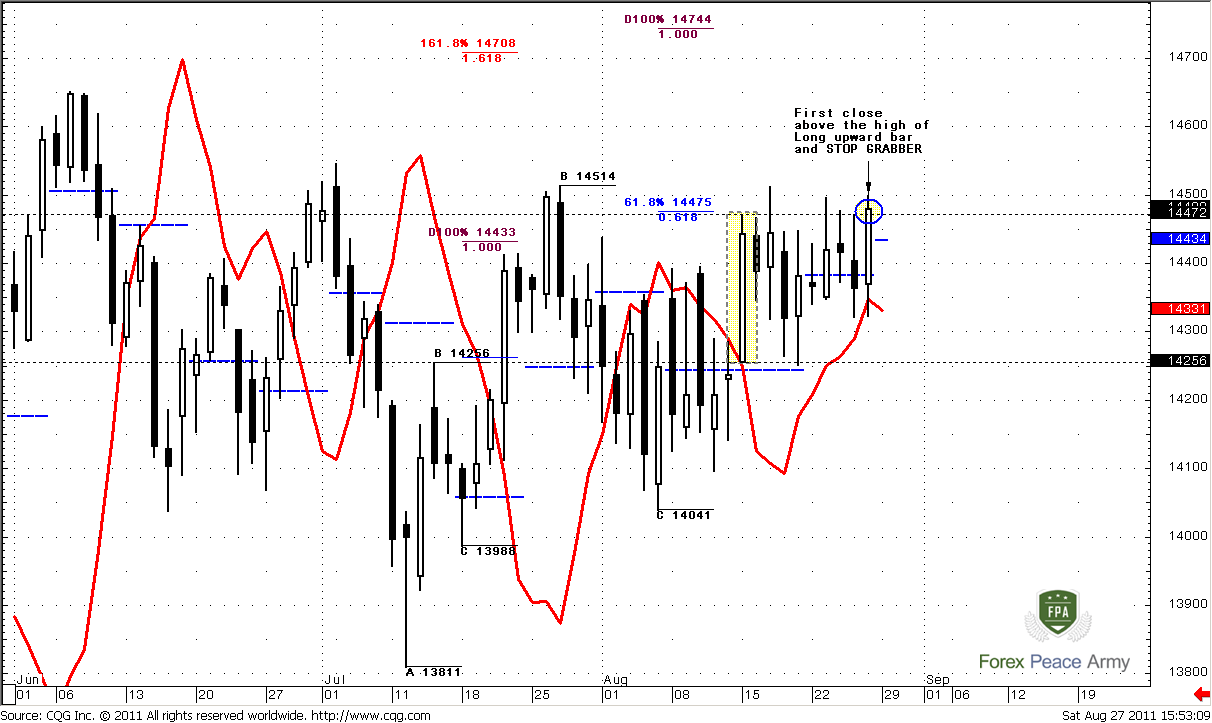
This time frame has couple of moments that are important, and one of them is a short term signal, at least initially. So, trend holds bullish. Remember what we’ve discussed on Friday – possibility for bullish stop grabber, so that has happened and market has formed it. This makes our task much easier. The minimum target of stop grabber is previous highs around 1.4515 area. But, it could be a start point of longer move up. Second, pay attention that second week in a row market closes above pivot. Also it stands above monthly pivot. Third, is look like as small detail, but it’s very significant. On Friday market has closed above the range of long white daily bar. All recent price action has stand inside that range for 2 weeks. Yes, market has penetrated it, but never has closed beyond it. So that has happened. Our task on lower time frame is to find out how to enter Long.
Speaking about the targets, the nearest ones stand at 1.47-1.4750 – 1.618 target of smaller AB-CD, 1.0 target of AB=CD, based on H&S pattern and daily overbought. If, off cause stop grabber will not stop just at 1.4515 area clearing…
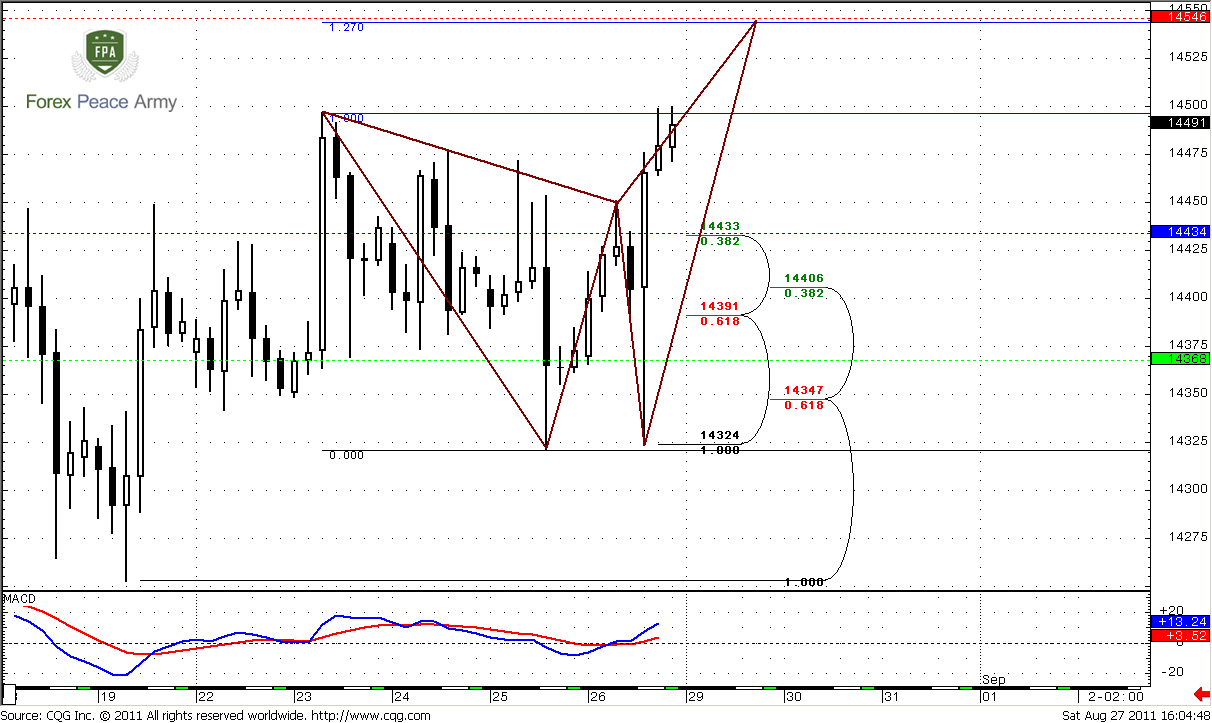
4-hour
Trend is bullish. Daily stop grabber lets us focus just on recent swing up. We should use it to enter long. There are two levels to watch for – 1.4433 nearest Fib support and Pivot point and 1.4390-1.4406 Confluence support. Also here is potential Butterfly “Sell” with 1.27 target right at pivot resistance 1.4550 area.
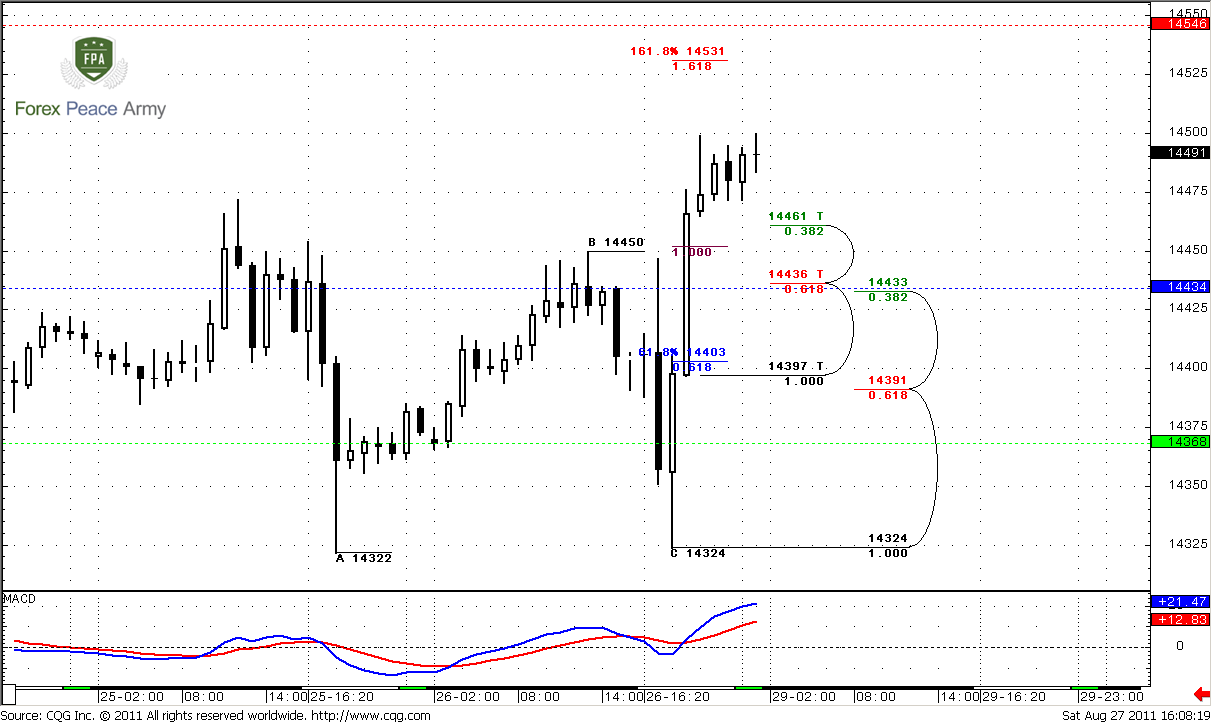
1-hour
Hourly trend is also bullish. 1. 618 AB-CD target stands at 1.4531. Also this chart shows that 1.4433-1.4436 is also a Confluence support. So what do we have – daily, 4 hour and hourly trends are bullish, market is not at overbought, hence it’s better to use nearest Fib support to enter long, probably even 1.4460
Conclusion:
Short term analysis gives an excellent bias to enter Long. 1.4430-1.4460 is an area to search for buy signals. Stop is better place below 1.4380. Nearest target is 1.4550, while in general, it could continue to 1.47-1.4750 if daily stop grabber will not end just with highs clearing.
The technical portion of Sive's analysis owes a great deal to Joe DiNapoli's methods, and uses a number of Joe's proprietary indicators. Please note that Sive's analysis is his own view of the market and is not endorsed by Joe DiNapoli or any related companies.
As we’ve said previously current trading environment on monthly time frame is a bright example of indecisive sentiment of market participants. Since as US as EU hit market with turmoil, traders just can’t decide which problems are worse. Trading range on monthly chart has contracted significantly, June was inside month and August has all chances to become inside one also.
On Friday everybody has expected Bernanke speech in Jackson Hole, it has come, but it was blank – no information at all. The major conclusion is that Fed is trying to buy time. This tells us that on September 20th we have to be aware of some radical information from the Fed, and probably they will be bad for dollar. Otherwise, why to postpone some supportive and good news? The fact of postponing is already negative of USD. As with Congress decision about debt ceil, as now, when Fed can’t pronounce their program tells that they indecision and don’t know what to do. That makes investors nervous, since investors like stability and transparency - they like to see that economy stands in strong hands on government and central bank and those authorities do know what to do. Now we don’t see it.
Also I have long-term suspicion that something really bad could happen with dollar, somewhere around Nov 2012 – election time. $2 Trillion dollars of debt ceil increasing will be sufficient right till election time. It could turn that Fed will continue to buy time with uncertainty and to not take any significant steps. US will never be able to get out from debt pit, and increasing of debt ceil is just postponement of catastrophe. It will happen sooner rather than later, and since debt growth with geometric progression, it obvious that they can’t safe dollar strength and payout all debt. 14 trillion is just Government debt, surplus here healthcare program and other social programs and you come to approximately 50 Trillion. If we will decide just total government debt among all Americans, it turns that each citizen of US owes around 176 thousand dollars, including accrued interest. That’s really scared - U.S. National Debt Clock : Real Time
The strength of dollar now supports artificially. Additional confirmation to this is strength of Swiss franc and Japan Yen (even after tsunami), rally in precious metals. Try to recalculate oil prices in terms of gold and you’ll see that there is almost total absence of price fluctuation – no huge trends and collapses. It stands stable! Hence, the reason is in USD and its wastage. Before 1970 we had Dollar that was backed with gold and other currencies were backed by Dollar. Now (after 70s) we have Currencies that are backed with dollar, but dollar is backed with nothing.
I suspect, that US have some actuating levers, may be political, may be financial or both to weak EUR. All that panic with Greece, Ireland, Spain, Italy and now France has come from rating agencies. S&P is US company, and I can’t believe that they can’t use it for own purposes. That’s why currently it looks like all remain the same – EUR and USD stands in the same average levels. But in reality, USD has lost a lot of value. This is a bit long-term reasoning and arguments, but it’s better to remember about them and to assess any events from that standpoint also. If we will take a look at rate decreasing by S&P to AA+, it will come out with quite other colors – as a preparation of dollar abandoning policy and greatest fraud of all times. But enough horrors and let’s pass to technical picture.
It’s very difficult to say something new, especially when market stands in tight range during 2-3 weeks even in terms of daily time frame. So, weekly and monthly charts stand almost totally unchanged.
Monthly trend remains bullish so as price action. Recent AB-CD pattern develops strictly as in book – market has hit 0.618 Fib extension target and monthly overbought and turned to retracement. But this retracement is very shallow – as it has to be. Market could not even reach Confluence support and holds above nearest Fib support 1.4140. Also pay attention to previous highs at 1.4276 – although market has penetrated it, but could not close below that level for 4 month in a row. Furthermore, price action shows strong purchases by candles’ long tales during recent 4 months. Bullish pennant is forming currently here. Market has corrected overbought already. Since it has happened with flat price action but not with downward retracement – this is also a bullish sign.
So, as we’ve said in previous research recent price action is not match to market that turns in reversal. It’s more common for continuation market. Although overall small signs, if we will take them together, tell that up move continuation is very probable, I better treat current price action as “indecision”. May be it looks like bullish pennant and so on, but this is not just retracement – inside months and choppy behavior on daily time frame tell that although investors are not ready to sell, but they are not sure that EUR is better either. Mostly this is due uncertainty with USD.
Nearest target stands at 1.5081 – just above the previous highs – this is 0.618 extension from most recent AB-CD pattern. Next area to watch is 1.5272, but potentially it could turn to butterfly “Sell” pattern. The target of this pattern is 1.27 extension at 1.6027. Also it almost coincides with 1.27 target of bullish AB-CD at 1.5925 and with 1.0 Fib extension of most recent smaller AB-CD. By the way, from classical standpoint upward move should be equal to the mast of the pennant – that is 1.5866 area.
The crucial area for bullish perspectives is 1.3650 – down break of pennant and Confluence support will tell us that probably we can’t count on upward move in nearest time.
Weekly
Weekly trend holds bearish. First, I just want to remind you our suspicions that we’ve discussed in previous research. If we will take a look at overall picture then we’ll see that the nature of up move and current move is different. Current action is not thrust. It looks like retracement, and probably upward move could continue. Who knows, may be current pullback is just a respect of strong support on monthly time frame, but market has not quite reach it (monthly Confluence support). That’s why it’s hardly so. I don’t know but currently personally for me this environment looks more bullish rather than bearish. Here are some reasons for that. First, we clear see bullish dynamic pressure here. Look, market holds bear trend, but price action does not support that, market does not accelerate lower. Second, from classical perspectives, we see that bullish wedge or flag is forming. This is a consolidation but not an impulse move. Hence, this is a retracement.
Also we can treat this recent price action as Gartley “222” “Buy”.
Take a look at recent price action – market is forming higher lows with bear trend, so that has happened during recent week also. This is a confirmation of dynamic pressure. Now we have to keep an eye on that – will this tendency continue or not. That’s important.
And finally, pay attention to monthly pivot point. Do you see something different with it? Right, August is a first month in current consolidation, when price holds above the pivot for whole month, although it has tried to press it down.
Pay attention that MACDP will come in play on coming week, trend could turn north – that’s important.
Speaking about the targets – nearest one is 1.5081 – 0.618 Fib extension from AB-CD pattern, that is also a weekly overbought. Although dynamic pressure minimum target is clearing out the highs at 1.4925 – there are a lot of stops just above it. So, since they will be triggered, market definitely will accelerate further. Second area of targets is 1.5250-1.5270 - monthly AB-CD target.
Daily
This time frame has couple of moments that are important, and one of them is a short term signal, at least initially. So, trend holds bullish. Remember what we’ve discussed on Friday – possibility for bullish stop grabber, so that has happened and market has formed it. This makes our task much easier. The minimum target of stop grabber is previous highs around 1.4515 area. But, it could be a start point of longer move up. Second, pay attention that second week in a row market closes above pivot. Also it stands above monthly pivot. Third, is look like as small detail, but it’s very significant. On Friday market has closed above the range of long white daily bar. All recent price action has stand inside that range for 2 weeks. Yes, market has penetrated it, but never has closed beyond it. So that has happened. Our task on lower time frame is to find out how to enter Long.
Speaking about the targets, the nearest ones stand at 1.47-1.4750 – 1.618 target of smaller AB-CD, 1.0 target of AB=CD, based on H&S pattern and daily overbought. If, off cause stop grabber will not stop just at 1.4515 area clearing…
4-hour
Trend is bullish. Daily stop grabber lets us focus just on recent swing up. We should use it to enter long. There are two levels to watch for – 1.4433 nearest Fib support and Pivot point and 1.4390-1.4406 Confluence support. Also here is potential Butterfly “Sell” with 1.27 target right at pivot resistance 1.4550 area.
1-hour
Hourly trend is also bullish. 1. 618 AB-CD target stands at 1.4531. Also this chart shows that 1.4433-1.4436 is also a Confluence support. So what do we have – daily, 4 hour and hourly trends are bullish, market is not at overbought, hence it’s better to use nearest Fib support to enter long, probably even 1.4460
Conclusion:
Short term analysis gives an excellent bias to enter Long. 1.4430-1.4460 is an area to search for buy signals. Stop is better place below 1.4380. Nearest target is 1.4550, while in general, it could continue to 1.47-1.4750 if daily stop grabber will not end just with highs clearing.
The technical portion of Sive's analysis owes a great deal to Joe DiNapoli's methods, and uses a number of Joe's proprietary indicators. Please note that Sive's analysis is his own view of the market and is not endorsed by Joe DiNapoli or any related companies.