Sive Morten
Special Consultant to the FPA
- Messages
- 18,644
Monthly
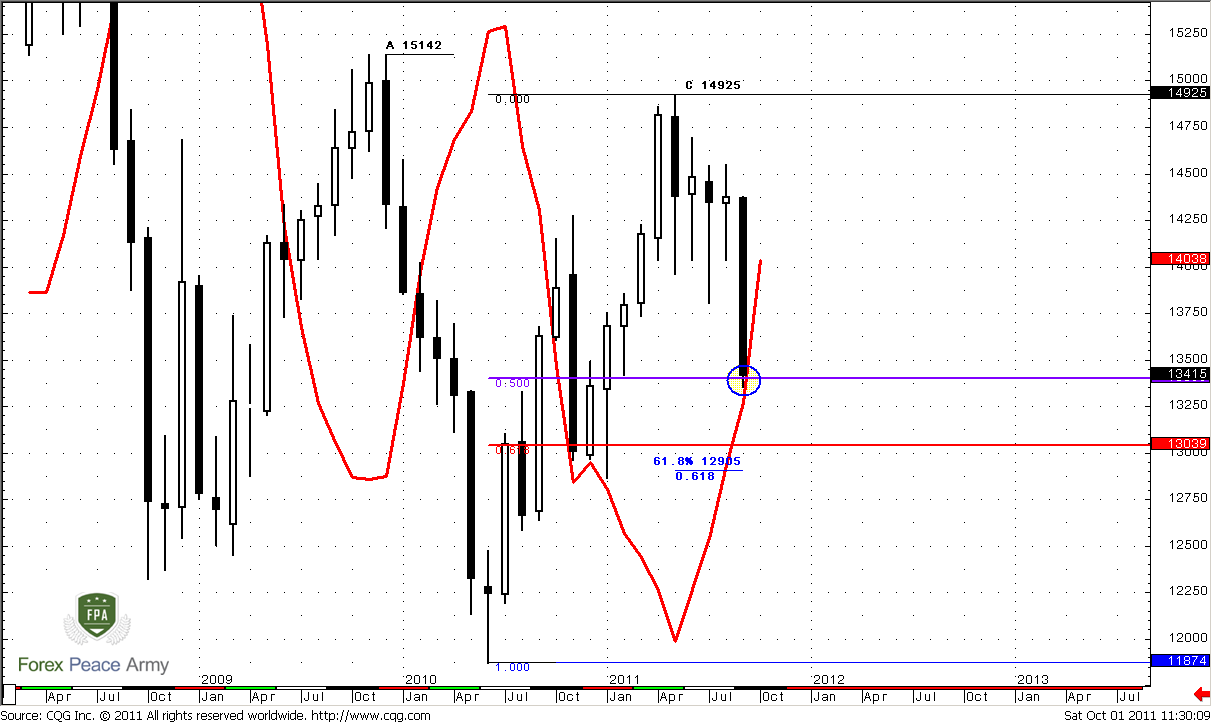
Monthly trend still stands bullish. Although on Monday we will see unconfirmed bear trend, we will be able to speak about trend change only at the end of October if market will close lower than 1.40 level. Current situation usually treats as “confirmed trend is bullish – unconfirmed trend is bearish”. Still, for most of us monthly trend is not very important, since there are not much traders who trade precisely on monthly chart. Significant Fib levels and areas of overbought/oversold are rather more interesting and important for us.
September month has closed at low and shown plunge that looks impressive. What we could expect from October from that standpoint? Well, only two things – downward continuation or consolidation. Monthly chart is not at oversold, so formally market has room to continue move down. We hardly could count on drastic reversal, since now monthly price action has downward momentum, and to reverse it needs to decrease pace first. Take a look at price action after strong down months, for example in April 2010 or October 2008 – they are doji. They are months of previous pace decreasing before reversal. Something like that market should to do if it will intend to change direction. If this will not be the case, then market will show downward continuation, and honestly speaking this looks more probable.
Still, market now stands at next support level – 50% at 1.34 from whole move up. As we will see later this is also weekly Agreement area.
On previous week we’ve posted that “standing at monthly and weekly support tells that on lower time frames market could show some respect of it, even you will not see it in terms on high time frames. That’s why, if this respect will appear at all, it should appear at nearest 1-2 weeks”. So, one week has passed, and this still has chances to happen, since there are some technical issues that could become a reasons for that. For instance, new monthly pivot point, so market could show some retracement up in the beginning of October, touch it and then continue down move.
Simultaneously we have to keep mind open for opposite price action, if bears are really strong – we should not be too surprised if market will break all supports and accelerates down further. Nearest target on monthly chart stands at 1.2905 from large AB-CD pattern – near major 0.618 Fib support 1.3039, so we might say that this is also a monthly Agreement. Current price action looks like Gartley “222” from AB swing on chart.
Weekly
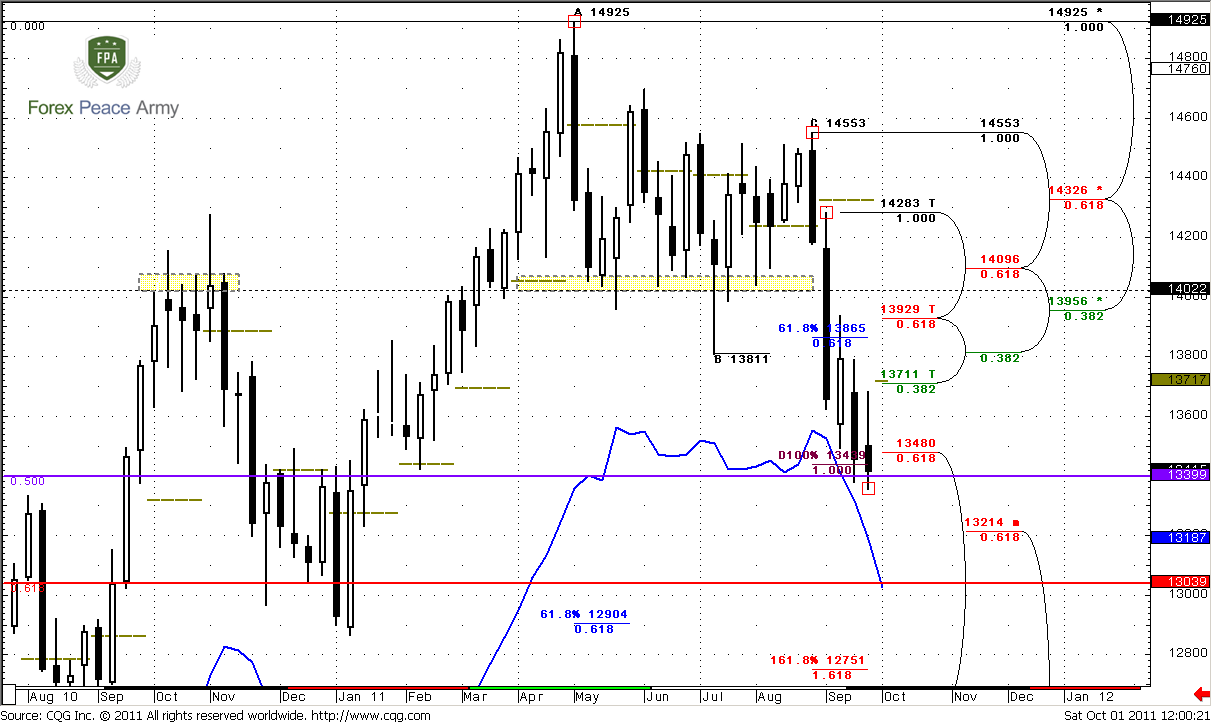
This chart is a bit overload with details, but all of them are important for us. Trend is extremely bearish, so that I even not draw MACD indicator here. From that standpoint we should be interested in shorting this market. The nearest target that market could achieve during week is 1.29-1.30 Agreement area. This area is also weekly oversold and contains monthly pivot support. This is too early to speak about 1.618 target at 1.2750, since it stands beyond weekly oversold area.
Still there are some reasons to expect some retracement up also. They are:
1. Market still at support – weekly Agreement and monthly 50% support level. Reaching of AB-CD 1.0 target and 1.3480 in most cases leads to some, at least shallow retracement up;
2. Pivot point of new month stands slightly above the market at 1.3717. We know that market trades pivots in 70% of cases during the period. So this is logical to assume that market still could touch pivot before downward continuation. Very often, especially when market shows solid moves, it tests pivots in the beginning of period, it calls as “test and go”.
Hence, from this point of view, retracement up, even small, could happen. What levels market could reach? There are only two of them – nearest Fib resistance that coincides with pivot at 1.3711-1.3717, and, second one is K-area at 1.3929-1.41. This area is very strong, since it includes Fib Confluence resistance, classical resistance level (see yellow rectangles) and monthly pivot resistance. If market will break it to upside then we should refuse bearish sentiment.
Why we suggest that market could show such deep retracement at all?
First is, because market has a tendency to show - 0.618 retracement after reaching AB-CD 1.0 targets. This happens very often. Second, during strong down moves pivot resistance 1 holds the rallies (upward retracements).
From weekly analysis we can make followed conclusions:
- Downward target is 1.29-1.30
- Upward retracement levels are 1.3715 or 1.3950-1.40.
- True breakout of second level will erase bearish bias.
Now we have to answer on two questions –how significant the chances of upward retracement and how deep it will be.
Daily
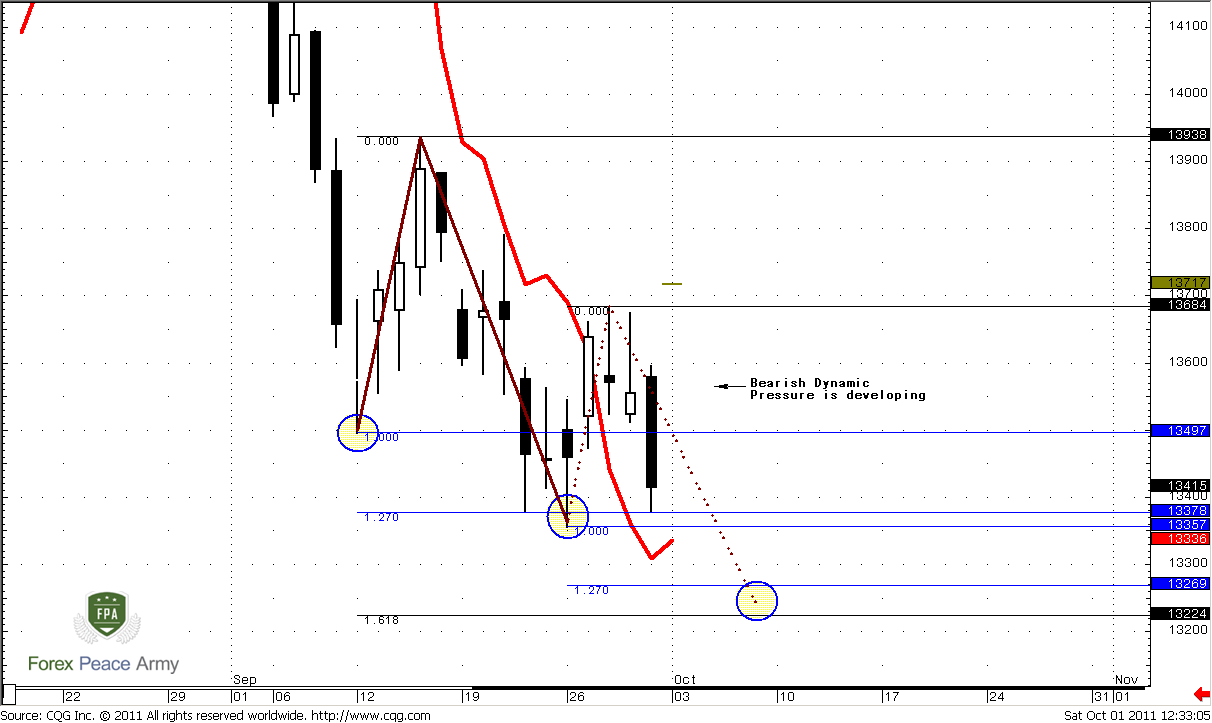
This chart gives us nice example why Divergence is not very reliable signal, and why is better to use it only in combination with other tools and stronger context. First, let’s speak about the pattern that could allow us to catch the start point of potential upward retracement. This pattern is 3-Drive “Buy”. Here you can see how Butterfly could shift by its failure to 3-Drive pattern. Now we see, that market couldn’t continue move up as it was suggested by Butterfly “Buy”. Instead of that it continues move down. I’ve marked by the circles the drives of 3-Drive pattern. Second drive stands at 1.27 extension of first drive, while third drive should appear at coincidence of 1.618 of first drive and 1.27 of second one. This is 1.3234-1.3269. May be it will form somewhere in this area, possibly at 1.3250, this is not a big deal. Our advantage here is in area. Now we know the area where to watch for Buy signals. If market will not show them and accelerates down - this will tell us that probably there will not be a retracement that we count on. At least, we will not have any more patterns that could confirm that.
Second signal that confirms further move down and creation of a new low is Bearish dynamic pressure. We see that trend is bullish (price stands above red line of MACD Predictor), but price action is not – market creates lower highs. This is why I do not rely on divergences too much. Dynamic pressure does not point for us a possible target - it just tells that market at least will create a new low.
Now let’s talk about a target of 3-Drive pattern. At minimum, if this pattern will work, market should reach the top between second and third drives. That is where precisely monthly pivot stands – 1.3717. If market will accomplish the first part of plan and reach that area, later we can investigate will it continue to 1.40 or not, but currently let’s stop with this.
4-hour and 1-hour
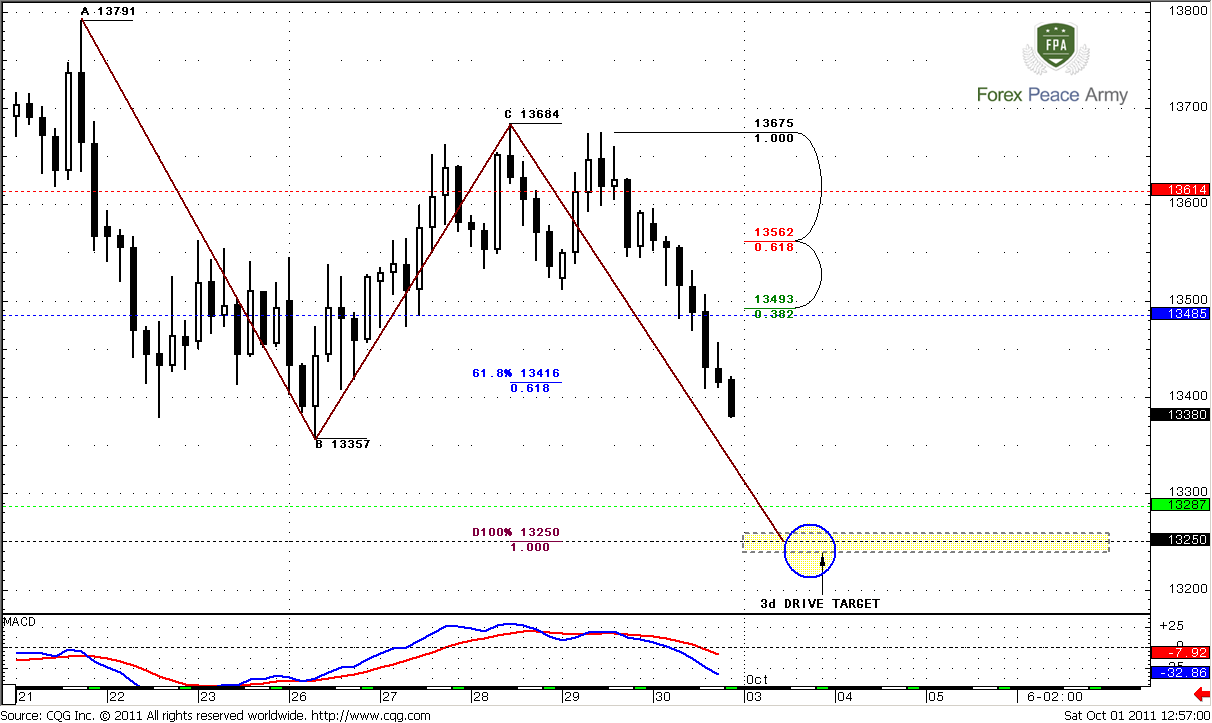
I’ve posted only 4-hour chart, since on hourly one there is no any significant add-on to 4-hour, but we will speak about both of them. So, 4-hour and hourly trends are bearish now. Here could be two possibilities. First, market will show small retracement at open on Monday. If this will happen, then scalpers could watch over 1.3485-1.3493 Fib resistance and weekly pivot for searching “Sell” possibility. Simultaneously if this level will be reached not by gap opening, market could show hourly DRPO “Buy” pattern and retracement could start due this signal.
For others, who do not trade very short-term, is better to wait reaching of 1.3250 level – this is also a target of AB-CD pattern, by the way. IF market will open with gap low, then it will not give you any choice, but wait for 1.3250…
Daily 3-Drive pattern has a failure point also, and this is 1.3684 – the high of second drive. If market will move above it before it will establish the third drive, then our suggestions about this pattern will appear to be wrong.
Conclusion:
On the higher time frames market has chances to show some upward retracement. This retracement could be either to 1.3711 or to 1.40 level.
On daily time frame market is forming the potential 3-Drive pattern, that could be a trigger pattern that could launch this retracement. Its minimum target agrees with 1.3711 area.
On Monday there are multiple possibilities to trade, depending on how market will open.
For most of us it’s better to wait reaching of third drive area - 1.3225-1.3270, then drop time frame and watch for “Buy” signals. For instance, it could be a 4-hour DRPO “Buy”, since thrust on 4-hour chart looks nice.
If you’re scalper and if market will show retracement at open on Monday, you may try to enter short from 1.35 area with hope that market will continue move to 1.3250. But be extra careful, use only solid patterns on short-term charts to enter.
If market will move above 1.3684 initially – it will erase assumption about 3-Drive pattern, and we will need to search for something else.
The technical portion of Sive's analysis owes a great deal to Joe DiNapoli's methods, and uses a number of Joe's proprietary indicators. Please note that Sive's analysis is his own view of the market and is not endorsed by Joe DiNapoli or any related companies.
Monthly trend still stands bullish. Although on Monday we will see unconfirmed bear trend, we will be able to speak about trend change only at the end of October if market will close lower than 1.40 level. Current situation usually treats as “confirmed trend is bullish – unconfirmed trend is bearish”. Still, for most of us monthly trend is not very important, since there are not much traders who trade precisely on monthly chart. Significant Fib levels and areas of overbought/oversold are rather more interesting and important for us.
September month has closed at low and shown plunge that looks impressive. What we could expect from October from that standpoint? Well, only two things – downward continuation or consolidation. Monthly chart is not at oversold, so formally market has room to continue move down. We hardly could count on drastic reversal, since now monthly price action has downward momentum, and to reverse it needs to decrease pace first. Take a look at price action after strong down months, for example in April 2010 or October 2008 – they are doji. They are months of previous pace decreasing before reversal. Something like that market should to do if it will intend to change direction. If this will not be the case, then market will show downward continuation, and honestly speaking this looks more probable.
Still, market now stands at next support level – 50% at 1.34 from whole move up. As we will see later this is also weekly Agreement area.
On previous week we’ve posted that “standing at monthly and weekly support tells that on lower time frames market could show some respect of it, even you will not see it in terms on high time frames. That’s why, if this respect will appear at all, it should appear at nearest 1-2 weeks”. So, one week has passed, and this still has chances to happen, since there are some technical issues that could become a reasons for that. For instance, new monthly pivot point, so market could show some retracement up in the beginning of October, touch it and then continue down move.
Simultaneously we have to keep mind open for opposite price action, if bears are really strong – we should not be too surprised if market will break all supports and accelerates down further. Nearest target on monthly chart stands at 1.2905 from large AB-CD pattern – near major 0.618 Fib support 1.3039, so we might say that this is also a monthly Agreement. Current price action looks like Gartley “222” from AB swing on chart.
Weekly
This chart is a bit overload with details, but all of them are important for us. Trend is extremely bearish, so that I even not draw MACD indicator here. From that standpoint we should be interested in shorting this market. The nearest target that market could achieve during week is 1.29-1.30 Agreement area. This area is also weekly oversold and contains monthly pivot support. This is too early to speak about 1.618 target at 1.2750, since it stands beyond weekly oversold area.
Still there are some reasons to expect some retracement up also. They are:
1. Market still at support – weekly Agreement and monthly 50% support level. Reaching of AB-CD 1.0 target and 1.3480 in most cases leads to some, at least shallow retracement up;
2. Pivot point of new month stands slightly above the market at 1.3717. We know that market trades pivots in 70% of cases during the period. So this is logical to assume that market still could touch pivot before downward continuation. Very often, especially when market shows solid moves, it tests pivots in the beginning of period, it calls as “test and go”.
Hence, from this point of view, retracement up, even small, could happen. What levels market could reach? There are only two of them – nearest Fib resistance that coincides with pivot at 1.3711-1.3717, and, second one is K-area at 1.3929-1.41. This area is very strong, since it includes Fib Confluence resistance, classical resistance level (see yellow rectangles) and monthly pivot resistance. If market will break it to upside then we should refuse bearish sentiment.
Why we suggest that market could show such deep retracement at all?
First is, because market has a tendency to show - 0.618 retracement after reaching AB-CD 1.0 targets. This happens very often. Second, during strong down moves pivot resistance 1 holds the rallies (upward retracements).
From weekly analysis we can make followed conclusions:
- Downward target is 1.29-1.30
- Upward retracement levels are 1.3715 or 1.3950-1.40.
- True breakout of second level will erase bearish bias.
Now we have to answer on two questions –how significant the chances of upward retracement and how deep it will be.
Daily
This chart gives us nice example why Divergence is not very reliable signal, and why is better to use it only in combination with other tools and stronger context. First, let’s speak about the pattern that could allow us to catch the start point of potential upward retracement. This pattern is 3-Drive “Buy”. Here you can see how Butterfly could shift by its failure to 3-Drive pattern. Now we see, that market couldn’t continue move up as it was suggested by Butterfly “Buy”. Instead of that it continues move down. I’ve marked by the circles the drives of 3-Drive pattern. Second drive stands at 1.27 extension of first drive, while third drive should appear at coincidence of 1.618 of first drive and 1.27 of second one. This is 1.3234-1.3269. May be it will form somewhere in this area, possibly at 1.3250, this is not a big deal. Our advantage here is in area. Now we know the area where to watch for Buy signals. If market will not show them and accelerates down - this will tell us that probably there will not be a retracement that we count on. At least, we will not have any more patterns that could confirm that.
Second signal that confirms further move down and creation of a new low is Bearish dynamic pressure. We see that trend is bullish (price stands above red line of MACD Predictor), but price action is not – market creates lower highs. This is why I do not rely on divergences too much. Dynamic pressure does not point for us a possible target - it just tells that market at least will create a new low.
Now let’s talk about a target of 3-Drive pattern. At minimum, if this pattern will work, market should reach the top between second and third drives. That is where precisely monthly pivot stands – 1.3717. If market will accomplish the first part of plan and reach that area, later we can investigate will it continue to 1.40 or not, but currently let’s stop with this.
4-hour and 1-hour
I’ve posted only 4-hour chart, since on hourly one there is no any significant add-on to 4-hour, but we will speak about both of them. So, 4-hour and hourly trends are bearish now. Here could be two possibilities. First, market will show small retracement at open on Monday. If this will happen, then scalpers could watch over 1.3485-1.3493 Fib resistance and weekly pivot for searching “Sell” possibility. Simultaneously if this level will be reached not by gap opening, market could show hourly DRPO “Buy” pattern and retracement could start due this signal.
For others, who do not trade very short-term, is better to wait reaching of 1.3250 level – this is also a target of AB-CD pattern, by the way. IF market will open with gap low, then it will not give you any choice, but wait for 1.3250…
Daily 3-Drive pattern has a failure point also, and this is 1.3684 – the high of second drive. If market will move above it before it will establish the third drive, then our suggestions about this pattern will appear to be wrong.
Conclusion:
On the higher time frames market has chances to show some upward retracement. This retracement could be either to 1.3711 or to 1.40 level.
On daily time frame market is forming the potential 3-Drive pattern, that could be a trigger pattern that could launch this retracement. Its minimum target agrees with 1.3711 area.
On Monday there are multiple possibilities to trade, depending on how market will open.
For most of us it’s better to wait reaching of third drive area - 1.3225-1.3270, then drop time frame and watch for “Buy” signals. For instance, it could be a 4-hour DRPO “Buy”, since thrust on 4-hour chart looks nice.
If you’re scalper and if market will show retracement at open on Monday, you may try to enter short from 1.35 area with hope that market will continue move to 1.3250. But be extra careful, use only solid patterns on short-term charts to enter.
If market will move above 1.3684 initially – it will erase assumption about 3-Drive pattern, and we will need to search for something else.
The technical portion of Sive's analysis owes a great deal to Joe DiNapoli's methods, and uses a number of Joe's proprietary indicators. Please note that Sive's analysis is his own view of the market and is not endorsed by Joe DiNapoli or any related companies.

")